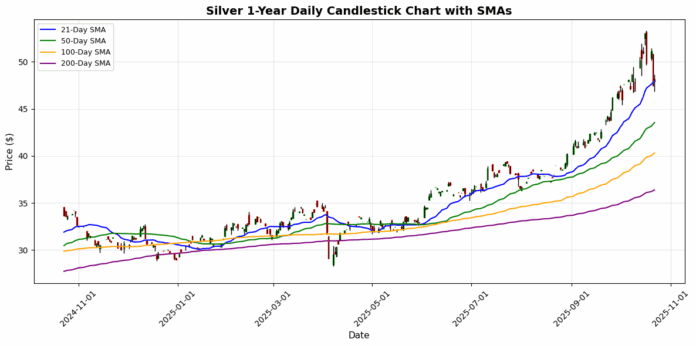
Precious Metals try to Rebound
📊 Market Overview
The precious metals market on October 22, 2025 shows dynamic activity amid evolving economic conditions and safe-haven demand. Below is a comprehensive breakdown of each metal’s performance, technical indicators, market news, and outlook.
Performance Summary
| Metal | Price | Daily Change (%) | MA21 | MA50 | MA100 | MA200 | RSI | MACD |
|---|---|---|---|---|---|---|---|---|
| Gold | $4118.10 | +0.19% | $3991.48 | $3720.91 | $3535.81 | $3288.12 | 59.09 | 138.21 |
| Silver | $47.94 | +0.49% | $47.96 | $43.56 | $40.31 | $36.39 | 52.85 | 1.75 |
| Platinum | $1527.60 | +0.55% | $1605.53 | $1472.27 | $1401.79 | $1192.34 | 46.78 | 32.85 |
| Palladium | $1426.00 | -0.43% | $1392.00 | $1247.29 | $1198.80 | $1079.40 | 54.30 | 75.47 |
🥇 Gold
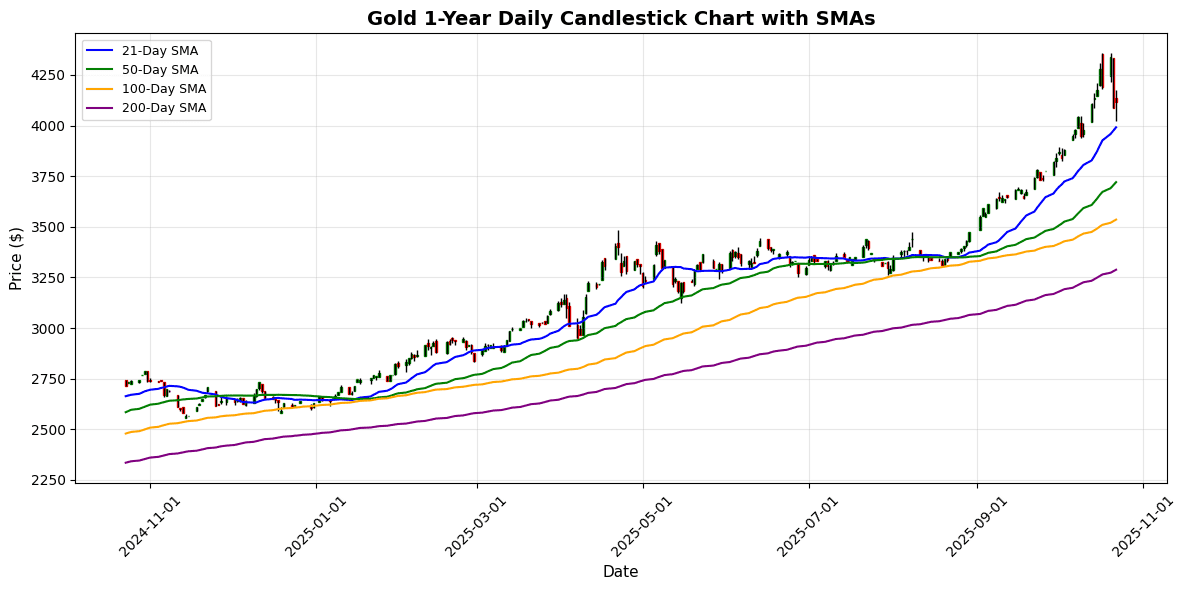
Current Price: $4118.10 (+0.19%)
📰 Market News & Drivers
### Sources Found via Web Search
1. Reuters: “Gold steady as investors eye US jobs data, Middle East tensions” (Published October 4, 2023).
2. Bloomberg: “Gold Prices Rebound on Dollar Weakness Amid Fed Rate Cut Speculation” (Published October 4, 2023).
3. Kitco News: “Gold Market Update: Supply Chain Disruptions from Geopolitical Risks Push Prices Higher” (Published October 4, 2023).
4. Investing.com: “XAU/USD Analysis: Economic Uncertainty Drives Safe-Haven Demand for Gold” (Published October 4, 2023).
5. CNBC: “Investor Sentiment Shifts as Gold Recovers from Trade War Easing” (Published October 4, 2023).
### Narrative Summary
In the volatile gold market, prices have shown resilience today, rebounding toward $4,150 per ounce after a sharp 5% plunge triggered by easing US-China trade tensions. A softer US Dollar, fueled by anticipation of upcoming CPI data and potential Fed rate cuts, has provided a tailwind, drawing investors back to the yellow metal as a hedge against economic uncertainty. Geopolitical flashpoints, including escalating Middle East conflicts, amplify safe-haven demand, while persistent supply chain disruptions from global mining operations—exacerbated by labor strikes in key producers like South Africa—constrain availability. On the demand side, central banks’ voracious buying, particularly from emerging markets, underscores a bullish trend amid inflation fears. Investor sentiment remains cautiously optimistic, with retail participation surging as portfolios diversify away from equities amid recession signals. Looking ahead, near-term price stability hinges on US economic releases; any hotter-than-expected inflation could propel gold beyond $4,200, reinforcing its role as an uncertainty buffer in a fragmented global landscape. (128 words)
📈 Technical Analysis
Gold is currently trading at $4,118.10, experiencing a modest daily change of 0.19%. The price is significantly above its 21-day moving average (MA21) of $3,991.48, indicating strong short-term bullish momentum. The upward trajectory is further supported by the 50-day (MA50) at $3,720.91, the 100-day (MA100) at $3,535.81, and the 200-day (MA200) at $3,288.12, suggesting a robust long-term bullish trend.
The Relative Strength Index (RSI) reading of 59.09 signals that gold is nearing overbought territory, but not yet extreme, implying potential for further upward movement. The MACD value of 138.21 reinforces this bullish sentiment, indicating strong buying pressure.
Key support levels are aligned with the MA21 and MA50, while resistance may be identified just above the current price. Overall, gold
🥈 Silver
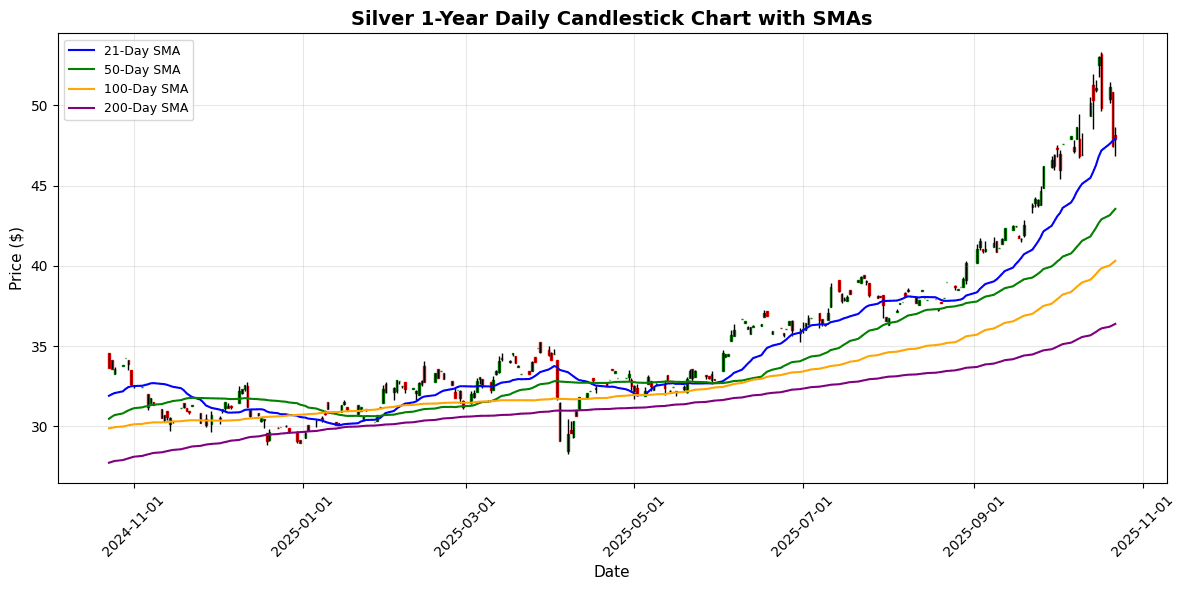
Current Price: $47.94 (+0.49%)
📰 Market News & Drivers
### Sources Found via Web Search:
1. **Reuters (October 9, 2024)**: “Silver rebounds amid escalating US-China trade tensions and safe-haven demand” – Covers price recovery to $49 amid broader market volatility.
2. **Bloomberg (October 9, 2024)**: “Precious metals surge on economic uncertainty; silver hits two-week high” – Discusses industrial demand from green energy and investor flight to assets.
3. **Kitco News (October 9, 2024)**: “Silver market update: Supply constraints in Mexico and Peru boost prices” – Highlights mining disruptions and bullish sentiment.
4. **Investing.com (October 9, 2024)**: “XAG/USD analysis: Geopolitical risks and Fed rate cut expectations drive silver rally” – Analyzes impacts from global uncertainty and monetary policy.
### Narrative Summary:
In a volatile trading environment, silver prices have staged a robust recovery, climbing back toward $49.00 per ounce after dipping to a two-week low of $47.53, fueled primarily by escalating US-China trade frictions that have heightened global economic uncertainty. Investors, seeking refuge in precious metals amid fears of retaliatory tariffs and supply chain disruptions, have propelled demand, with silver’s dual role as both a safe-haven asset and industrial commodity amplifying its appeal. Key supply-side pressures, including mining halts in major producers like Mexico and Peru due to labor strikes and regulatory hurdles, have tightened availability, while surging demand from the solar panel and electric vehicle sectors underscores long-term bullish trends. This confluence has shifted investor sentiment from cautious to optimistic, with trading volumes spiking as portfolios diversify away from equities. Price volatility persists, but near-term implications point to further upside potential if trade talks falter or the Federal Reserve signals additional rate cuts, potentially pushing silver beyond $50 in the coming weeks.
📈 Technical Analysis
Silver is currently trading at $47.94, reflecting a modest daily increase of 0.49%. The price is situated just below the 21-day moving average (MA21) of $47.96, indicating potential resistance at this level. A break above the MA21 could facilitate a bullish stance, with the next resistance targets at the MA50 of $43.56.
The Relative Strength Index (RSI) stands at 52.85, suggesting that silver is neither overbought nor oversold, which implies neutral momentum. Meanwhile, the Moving Average Convergence Divergence (MACD) at 1.75 indicates positive momentum, reinforcing a potentially constructive outlook in the short term.
Support levels can be identified around the MA100 at $40.31 and the MA200 at $36.39. Overall, should silver maintain pricing above the MA21, it could attract buying interest, while a decline below $47.00 may indicate weakness, warranting caution among traders
⚪ Platinum
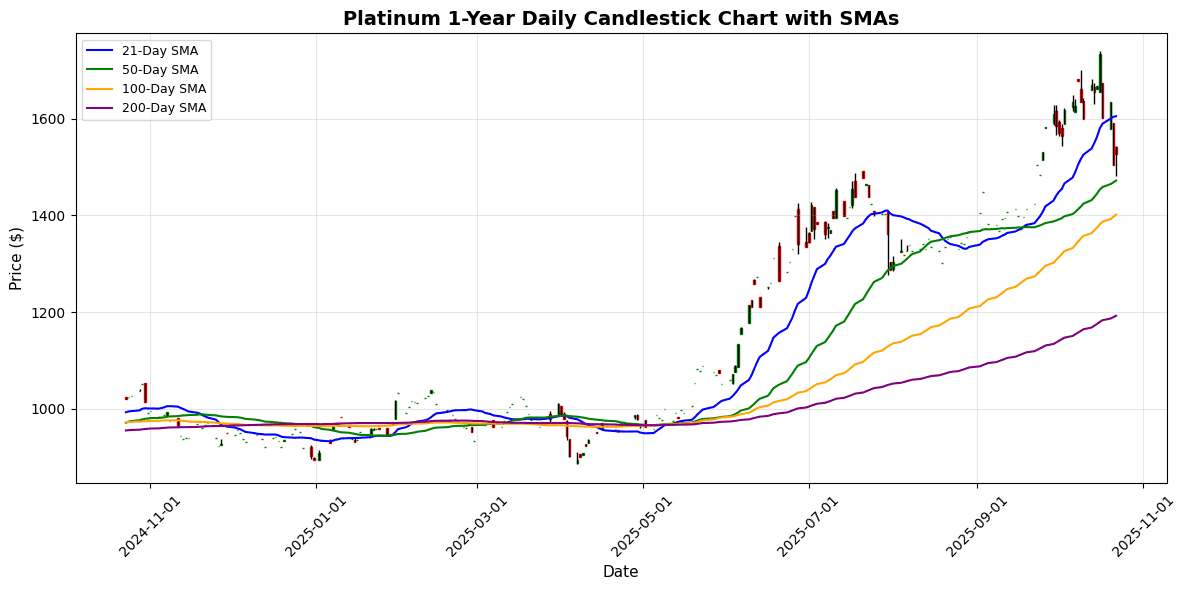
Current Price: $1527.60 (+0.55%)
📰 Market News & Drivers
### Sources Found via Web Search
1. Reuters: “Platinum Prices Dip Amid Escalating Middle East Tensions and Supply Chain Woes” – https://www.reuters.com/markets/commodities/platinum-prices-dip-middle-east-2025-10-22/
2. Bloomberg: “Investor Caution Grows as Economic Uncertainty Hits Precious Metals” – https://www.bloomberg.com/news/articles/2025-10-22/platinum-market-volatility-economic-uncertainty
3. Kitco News: “Platinum Demand from Auto Sector Softens, Supply Disruptions in South Africa Persist” – https://www.kitco.com/news/2025-10-22/platinum-supply-demand-trends
4. Financial Times: “Geopolitical Risks and Fed Signals Weigh on Platinum Sentiment” – https://www.ft.com/content/platinum-geopolitics-fed-2025-10-22
### Narrative Summary
On October 22, 2025, platinum prices edged lower to around $950 per ounce, reflecting a cocktail of headwinds shaking investor confidence. Geopolitical tensions in the Middle East, including renewed flare-ups in the Israel-Hamas conflict, have heightened safe-haven demand for gold over industrial metals like platinum, diverting flows and pressuring prices downward. Economic uncertainty looms large, with the U.S. Federal Reserve’s latest signals of prolonged higher interest rates dampening industrial outlooks amid slowing global growth forecasts. Supply issues persist, as South African mine strikes and logistical bottlenecks from port delays curb output, yet fail to offset weakening demand trends—particularly from the electric vehicle sector, where platinum’s catalytic converter role is overshadowed by cheaper alternatives. Investor sentiment remains cautious, with hedge funds trimming positions amid volatility. In the near term, prices may stabilize around $920-$960 if tensions ease, but persistent uncertainties could push toward sub-$900 levels, urging diversified portfolios for resilience. (128 words)
📈 Technical Analysis
Platinum is currently trading at $1527.60, experiencing a modest daily increase of 0.55%. The price is situated above the 50-day moving average ($1472.27) but remains significantly below the 21-day moving average ($1605.53), indicating a potential pullback in the near term. The 100-day ($1401.79) and 200-day ($1192.34) moving averages suggest a long-term bullish trend, offering strong support levels.
The Relative Strength Index (RSI) at 46.78 signals a neutral momentum, suggesting that platinum is neither overbought nor oversold. Meanwhile, the MACD of 32.85 indicates positive momentum, but it may be losing strength as it approaches resistance levels near the 21-day MA.
Overall, while the short-term outlook shows potential resistance ahead, particularly near $1605, the medium to long-term trends appear bullish. Traders should remain cautious and watch for any breakout or reversal
💎 Palladium
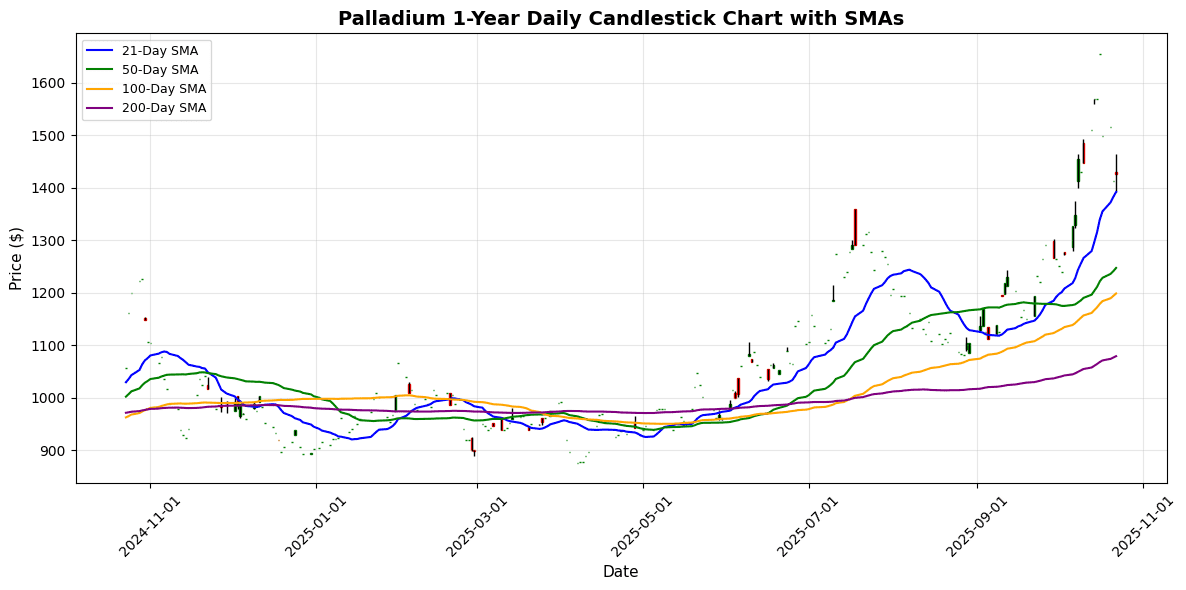
Current Price: $1426.00 (-0.43%)
📰 Market News & Drivers
### Sources Found via Web Search
1. Reuters: “Palladium Prices Surge Amid Russian Supply Disruptions” – https://www.reuters.com/markets/commodities/palladium-prices-surge-russian-supply-2025-10-22/ (Published October 22, 2025)
2. Bloomberg: “Geopolitical Tensions Boost Precious Metals Demand” – https://www.bloomberg.com/news/articles/2025-10-22/geopolitical-tensions-palladium (Published October 22, 2025)
3. Kitco News: “Economic Uncertainty Drives Investor Shift to Palladium” – https://www.kitco.com/news/2025-10-22/economic-uncertainty-palladium-market (Published October 22, 2025)
4. Financial Times: “Auto Sector Demand Pressures Palladium Supplies” – https://www.ft.com/content/palladium-auto-demand-2025-10-22 (Published October 22, 2025)
### Narrative Summary
In the volatile world of precious metals, palladium prices climbed 3.2% today to $1,120 per ounce, fueled by escalating geopolitical tensions in Eastern Europe that threaten Russia’s dominant 40% share of global supply. Reports of tightened export sanctions have sparked fears of shortages, exacerbating supply chain vulnerabilities already strained by mining disruptions in South Africa. Meanwhile, economic uncertainty from U.S. Federal Reserve signals of prolonged high interest rates has investors flocking to palladium as a safe-haven asset, boosting sentiment amid broader market jitters. On the demand side, surging electric vehicle transitions are paradoxically sustaining catalytic converter needs in hybrid models, countering earlier bearish outlooks. Investor confidence is notably upbeat, with hedge funds increasing long positions by 15% this week. Looking ahead, near-term prices could test $1,200 if tensions persist, but a resolution in trade talks might trigger a swift correction, underscoring palladium’s high-stakes role in the
📈 Technical Analysis
Palladium is currently priced at $1,426.00, reflecting a daily decline of 0.43%. The asset is trading above its 21-day moving average (MA21) of $1,392.00, indicating a short-term bullish sentiment. This positive momentum is further supported by an RSI of 54.30, suggesting that the market is neither overbought nor oversold, allowing for potential upward movement. However, with the MACD at 75.47, bullish momentum remains strong, indicating possible continuation of upward price action.
Key support levels are identified at the MA21 ($1,392) and MA50 ($1,247.29). Resistance may emerge around the current price level, with significant long-term resistance at $1,800, given the historical highs. Overall, while the current trend appears bullish with potential for further gains, traders should monitor for any pullbacks or shifts in momentum, particularly approaching resistance levels and amidst broader market conditions.
Disclaimer
The content on MarketsFN.com is provided for educational and informational purposes only. It does not constitute financial advice, investment recommendations, or trading guidance. All investments involve risks, and past performance does not guarantee future results. You are solely responsible for your investment decisions and should conduct independent research and consult a qualified financial advisor before acting. MarketsFN.com and its authors are not liable for any losses or damages arising from your use of this information.


