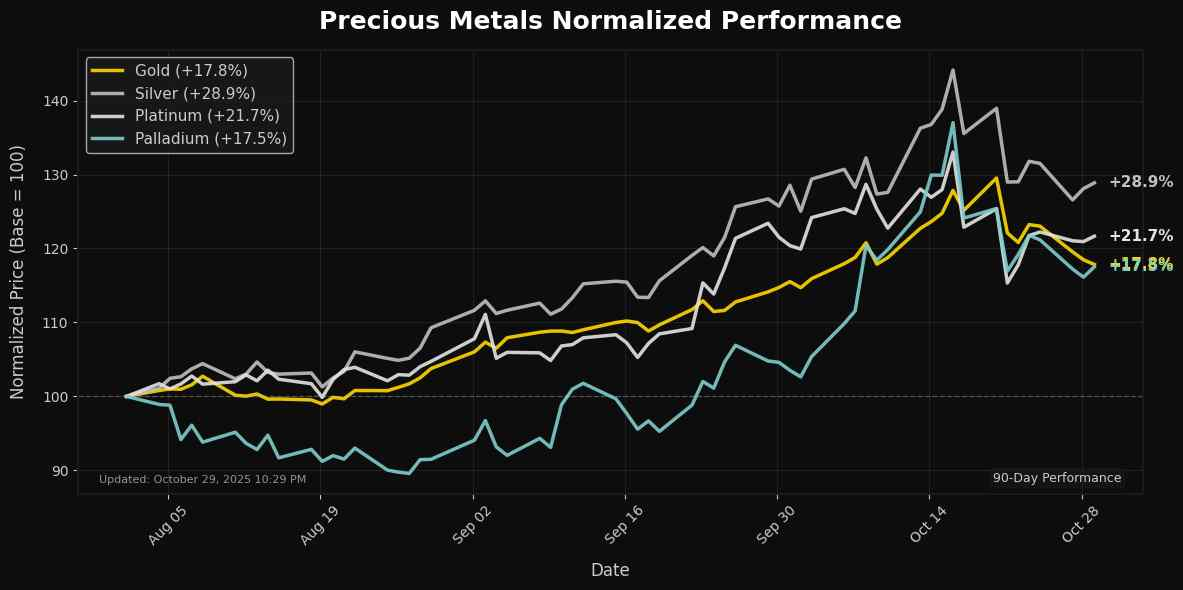
Precious Metals Update: Palladium Declines 1.80% –

📊 Market Overview
Report Date: October 29, 2025
| Metal | Price | Daily Change (%) | MA21 | MA50 | MA100 | MA200 | RSI | MACD |
|---|---|---|---|---|---|---|---|---|
| Gold | $3944.80 | -1.32% | $4047.53 | $3789.07 | $3569.35 | $3321.50 | 48.23 | 67.98 |
| Silver | $47.41 | -0.85% | $48.43 | $44.51 | $40.92 | $36.82 | 50.94 | 0.82 |
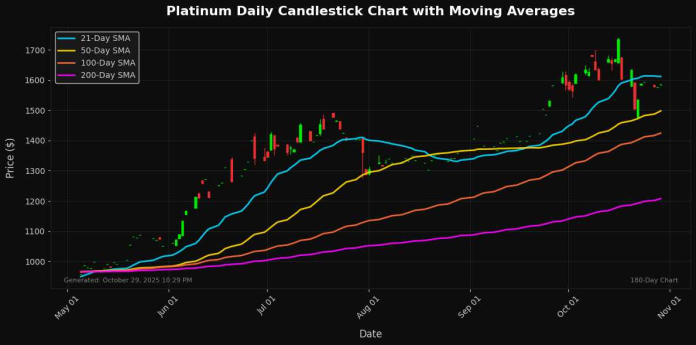
| Platinum | $1586.50 | -0.77% | $1612.20 | $1498.01 | $1424.37 | $1207.90 | 51.76 | 18.61 |
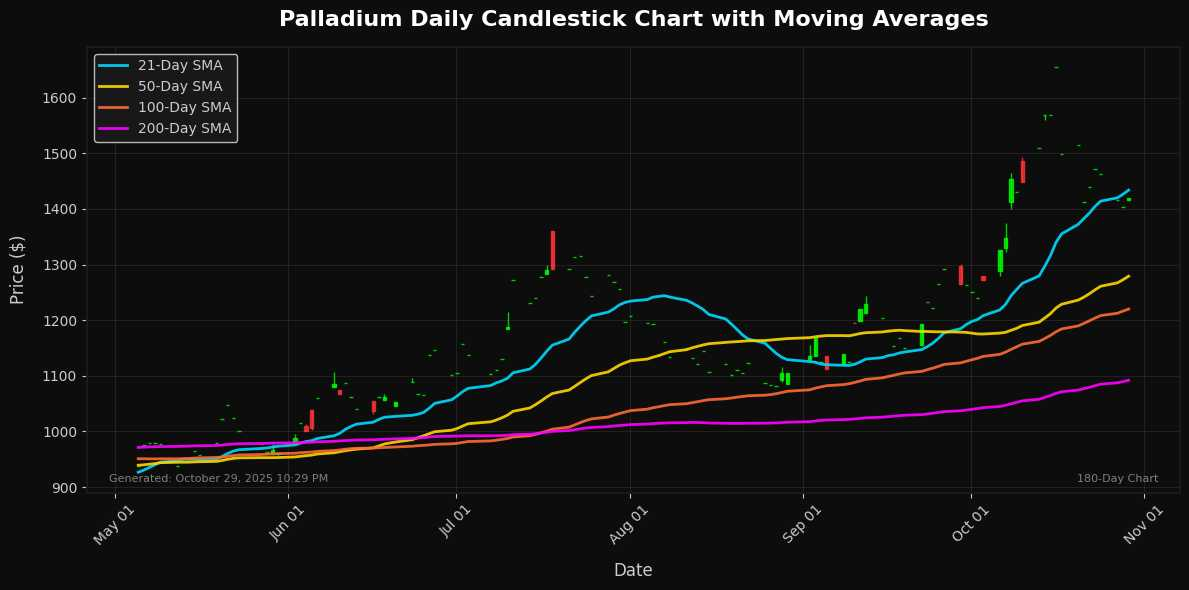
| Palladium | $1419.50 | -1.80% | $1433.90 | $1279.09 | $1219.95 | $1092.01 | 52.50 | 43.89 |
🔸 Palladium

Technical Analysis
Palladium is currently priced at $1419.50, reflecting a daily decline of 1.80%. The technical indicators suggest a mixed outlook. The price is trading above the 21-day moving average (MA21) of $1433.90, indicating short-term bullish sentiment. However, it is also significantly elevated above longer-term moving averages with the 50-day (MA50) at $1279.09, 100-day (MA100) at $1219.95, and 200-day (MA200) at $1092.01—highlighting potential overextension and susceptibility to correction.
The Relative Strength Index (RSI) at 52.50 indicates neutral momentum, suggesting there is room for movement in either direction. The MACD value of 43.89 is positive, further supporting the potential for upward momentum, though caution is warranted given the recent daily decrease. Key support is located near the MA50, while resistance can be identified around the current
Disclaimer
The content on MarketsFN.com is provided for educational and informational purposes only. It does not constitute financial advice, investment recommendations, or trading guidance. All investments involve risks, and past performance does not guarantee future results. You are solely responsible for your investment decisions and should conduct independent research and consult a qualified financial advisor before acting. MarketsFN.com and its authors are not liable for any losses or damages arising from your use of this information.


