Precious Metals Update: Platinum Advances 1.91% – RSI at 49
📊 Market Overview
Report Date: November 07, 2025
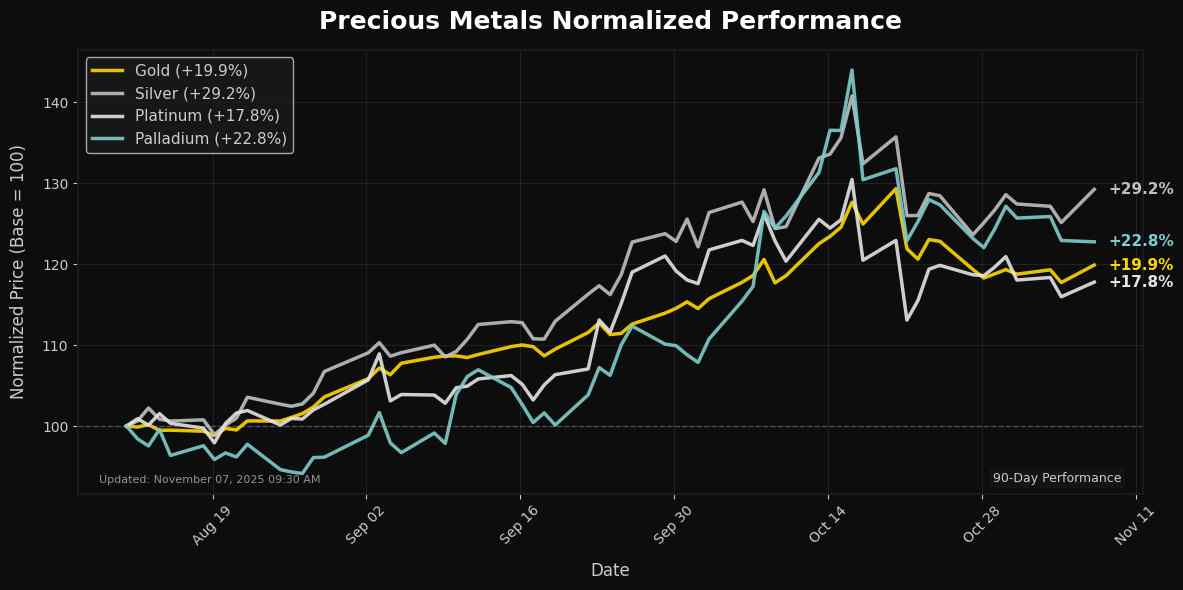
| Metal | Price | Daily Change (%) | MA21 | MA50 | MA100 | MA200 | RSI | MACD |
|---|---|---|---|---|---|---|---|---|
| Gold | $4020.00 | +0.73% | $4070.26 | $3852.54 | $3600.74 | $3352.82 | 52.71 | 32.78 |
| Silver | $48.67 | +1.51% | $48.63 | $45.48 | $41.50 | $37.24 | 54.85 | 0.56 |
| Platinum | $1566.40 | +1.91% | $1605.11 | $1521.03 | $1440.99 | $1223.56 | 49.47 | 6.60 |
| Palladium | $1411.00 | +1.15% | $1469.58 | $1312.59 | $1238.41 | $1104.00 | 50.45 | 26.50 |
🔸 Gold
Technical Analysis
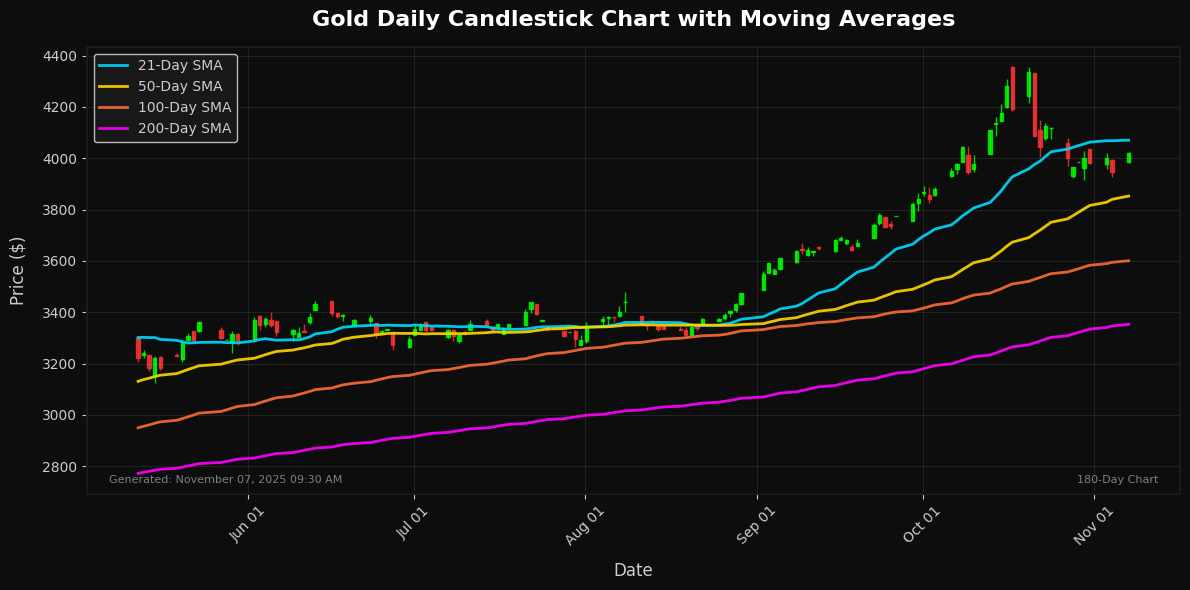
Gold is currently trading at $4020.00, reflecting a daily change of 0.73%. The price is situated near the short-term moving average (MA21) of $4070.26, indicating potential resistance at this level. If gold can break above this resistance, the next target could be the MA50 at $3852.54, which may serve as robust support. The MA100 and MA200 further establish longer-term support levels at $3600.74 and $3352.82, respectively.
The Relative Strength Index (RSI) at 52.71 suggests that gold is in a neutral zone, indicating that it lacks strong overbought or oversold momentum. Meanwhile, the MACD at 32.78 supports a bullish trend, reflecting positive momentum.
In summary, gold displays a cautious upward trend, but breaking through the MA21 resistance could unlock further gains. Traders should watch for momentum shifts and market sentiment for a clearer directional outlook.
🔸 Silver
Technical Analysis
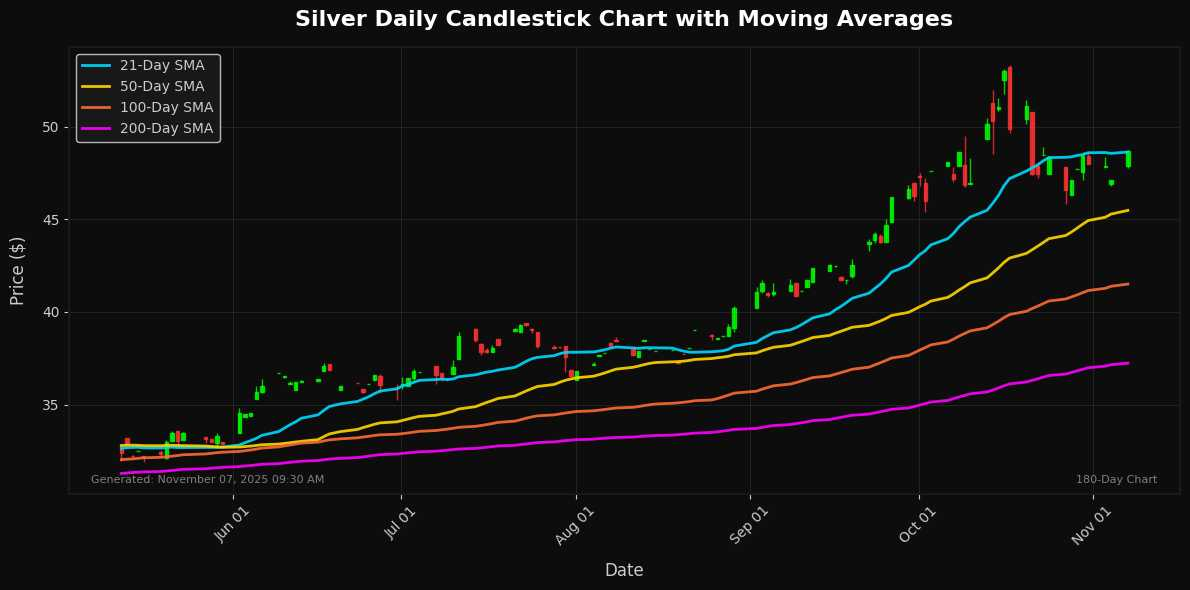
As of the latest data, silver is trading at $48.67, reflecting a daily change of 1.51%. The price is positioned above key moving averages: the 21-day MA at $48.63, which serves as immediate support, and the 50-day MA at $45.48, indicating a bullish sentiment as the price remains above this foundational level. The 100-day and 200-day MAs at $41.50 and $37.24, respectively, further affirm a longer-term upward trend.
Momentum indicators exhibit a mixed outlook; the RSI at 54.85 suggests a neutral position, indicating there is room for further gains without being overbought. Meanwhile, the MACD at 0.56 indicates a positive momentum shift.
Overall, silver appears to be in a robust bullish phase, with potential resistance around $50. Continued consolidation above $48.63 would strengthen the outlook for further upside, while a drop below this level could signal caution.
🔸 Platinum
Technical Analysis
Platinum is currently trading at $1566.40, reflecting a daily increase of 1.91%. The recent price movement shows potential bullish momentum, but the Relative Strength Index (RSI) at 49.47 indicates that the metal is nearing neutral territory, suggesting limited upside momentum in the short term.
Key moving averages reveal mixed signals: the 21-day moving average (MA21) at $1605.11 acts as immediate resistance, while the 50-day moving average (MA50) at $1521.03 provides a critical support level. The strong support from the 100-day (MA100) and 200-day moving averages further reinforces this outlook. The MACD value of 6.60 suggests a positive trend, but caution is advised, as it may not indicate a strong bullish reversal.
In summary, while the immediate outlook shows potential upward movement, the price must breach the MA21 for a sustained rally. Investors should monitor key support levels and the RSI for
🔸 Palladium
Technical Analysis
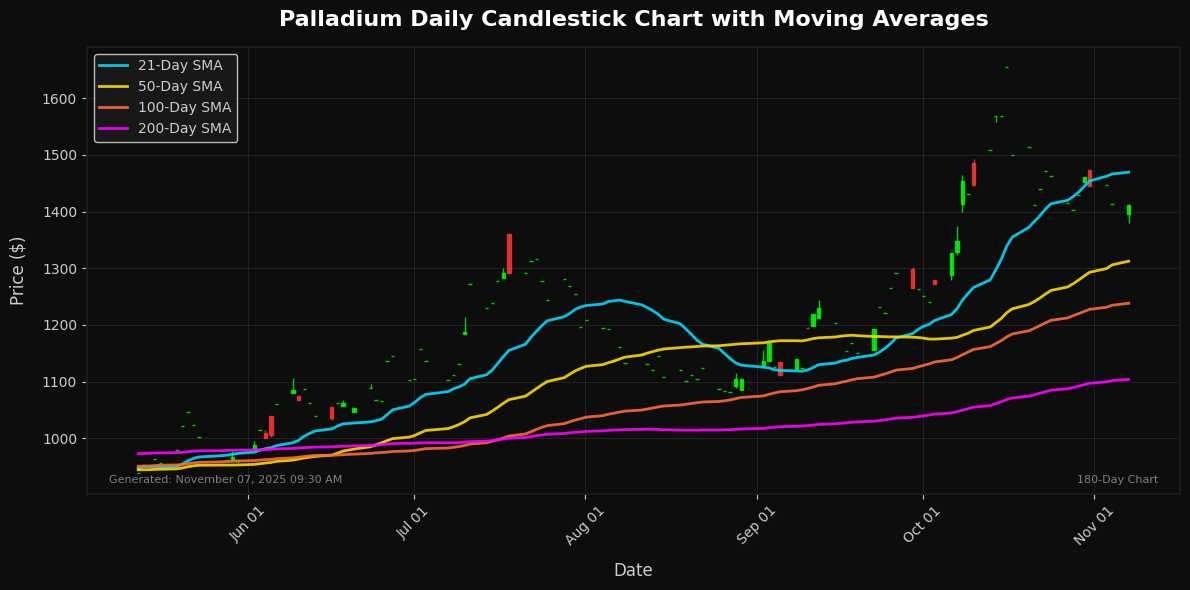
Palladium is currently trading at $1411.00, reflecting a daily change of 1.15%. The price is below the 21-day moving average (MA21) at $1469.58, indicating a short-term bearish trend. However, solid support is evident at the 50-day moving average (MA50) of $1312.59, which may provide a buffer against further declines.
Momentum indicators reveal that the Relative Strength Index (RSI) is at 50.45, suggesting neutral momentum, while the MACD at 26.50 indicates a strong bullish momentum but may be nearing overbought territory.
Potential resistance exists around the MA21; a breakout above this level could signal a return to bullish momentum. Conversely, a decline through the MA50 could confirm a downward trend. Overall, while palladium exhibits some recovery potential, close monitoring of these key levels is essential for traders to gauge direction and market sentiment.
Disclaimer
The content on MarketsFN.com is provided for educational and informational purposes only. It does not constitute financial advice, investment recommendations, or trading guidance. All investments involve risks, and past performance does not guarantee future results. You are solely responsible for your investment decisions and should conduct independent research and consult a qualified financial advisor before acting. MarketsFN.com and its authors are not liable for any losses or damages arising from your use of this information.


