S&P 500 Daily Analysis – October 20, 2025
The S&P 500 analysis on October 20, 2025 highlights top 10 and worst 10 performers based on daily price changes.
🟢 Top 10 Performers
Expand Energy Corp (EXE) (+6.07%)
📰 News & Developments
Expand Energy Corp (EXE) continues to navigate a dynamic energy landscape with strategic expansions in renewable infrastructure. The company recently announced advancements in its solar and wind portfolio, aiming to diversify beyond traditional fossil fuels amid growing global demand for sustainable energy solutions. This aligns with EXE’s long-term business strategy of investing in low-carbon technologies to enhance operational efficiency and reduce environmental impact.
Industry trends underscore a shift toward electrification and green hydrogen, positioning EXE favorably as governments worldwide prioritize net-zero goals. Regulatory developments, including enhanced incentives for clean energy projects, are bolstering the sector’s growth potential. Market sentiment remains cautiously optimistic, driven by EXE’s robust fundamentals and partnerships with key suppliers.
Looking ahead, EXE’s focus on innovation and geographic expansion into emerging markets signals a promising outlook, potentially strengthening its competitive edge in the evolving energy transition. Investors are watching closely for sustained execution on these initiatives.
📈 Technical Analysis
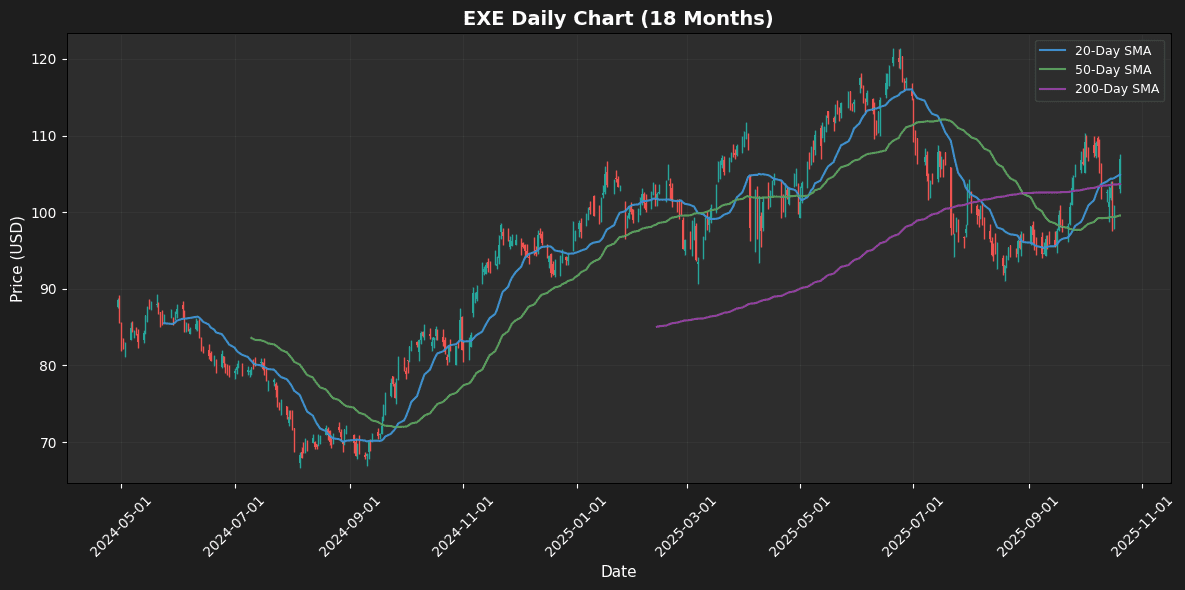
Expand Energy Corp (EXE) is currently trading at $106.90, exhibiting a positive trend as it remains above its key moving averages: the 20-day MA at $104.91, the 50-day MA at $99.56, and the 200-day MA at $103.66. This positioning suggests a bullish sentiment in the medium to long-term, with recent price action affirming upward momentum.
The RSI at 57.82 indicates that the stock has room to rise further, as it is not yet overbought. Additionally, the MACD of 0.69 reflects a strong upward momentum, signaling potential continuation of the current trend. Key support levels can be identified at $104.91 and $103.66, while resistance is likely around $110, making for a favorable risk-to-reward scenario for potential investors.
⭐ Recent Analyst Ratings
| Date | Status | Outer | Rating | Price |
|---|---|---|---|---|
| 2025-10-15 00:00:00 | Initiated | William Blair | Outperform | |
| 2025-08-18 00:00:00 | Downgrade | Roth Capital | Buy → Neutral | $98 |
| 2025-05-22 00:00:00 | Initiated | Bernstein | Outperform | $150 |
| 2025-05-13 00:00:00 | Upgrade | Piper Sandler | Neutral → Overweight | $136 |
Super Micro Computer Inc (SMCI) (+5.48%)
📰 News & Developments
Super Micro Computer Inc. (SMCI) continues to capture significant investor interest amid the surging demand for AI infrastructure. Recent developments highlight the company’s strategic focus on high-performance server solutions tailored for data centers and edge computing, positioning it as a key player in the AI hardware ecosystem. This aligns with broader industry trends, where rapid advancements in artificial intelligence and cloud computing are driving exponential growth in server deployments.
While regulatory scrutiny in the semiconductor supply chain persists, SMCI’s emphasis on innovation and partnerships with leading chipmakers underscores its resilience. Market sentiment remains bullish, fueled by expectations of robust revenue expansion from AI-related orders. Looking ahead, the company’s outlook appears promising, with potential for sustained growth as enterprises accelerate digital transformations, though execution risks in a competitive landscape warrant close monitoring.
📈 Technical Analysis
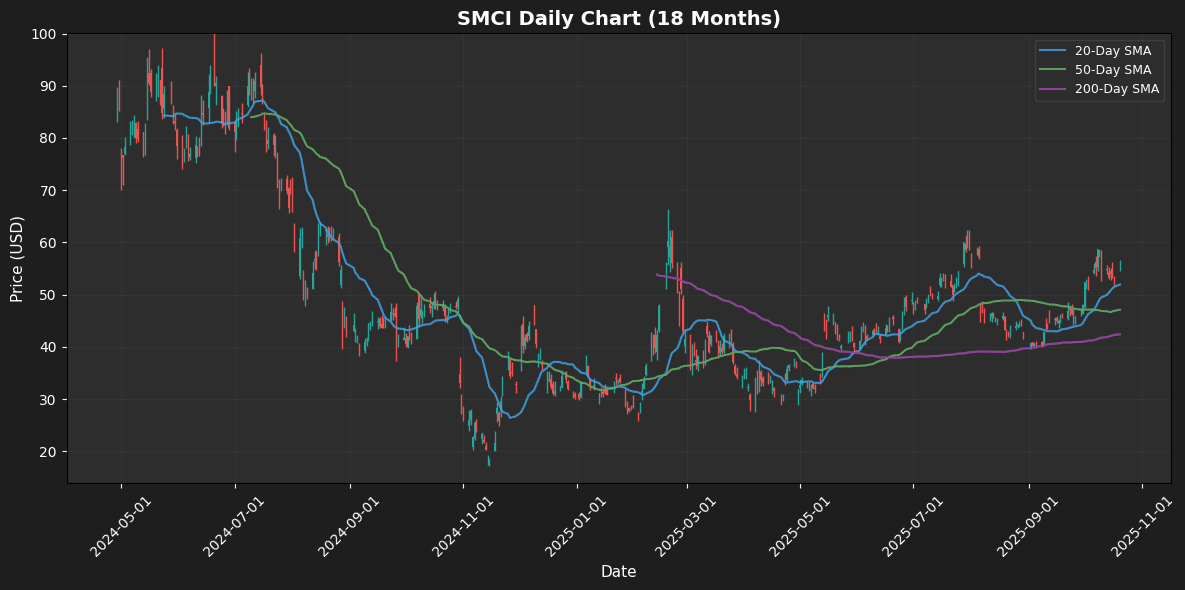
Super Micro Computer Inc (SMCI) is currently trading at $55.04, showing a bullish trend as the price is above key moving averages: the 20-day MA at $51.92, the 50-day MA at $47.11, and the 200-day MA at $42.41. This position indicates strong short- to long-term momentum. The Relative Strength Index (RSI) at 60.1 suggests that the stock is not overbought, allowing for continued upward movement without immediate correction risks. Additionally, the MACD reading of 2.11 further supports this positive momentum, with potential for further price appreciation. Immediate support can be seen at the 20-day MA, while resistance may form around psychological levels near $60. Overall, the technical indicators present a favorable outlook for SMCI, warranting bullish sentiment.
⭐ Recent Analyst Ratings
| Date | Status | Outer | Rating | Price |
|---|---|---|---|---|
| 2025-09-16 00:00:00 | Initiated | Bernstein | Mkt Perform | $46 |
| 2025-07-09 00:00:00 | Resumed | BofA Securities | Underperform | $35 |
| 2025-06-26 00:00:00 | Initiated | KeyBanc Capital Markets | Sector Weight | |
| 2025-05-07 00:00:00 | Resumed | Needham | Buy | $39 |
Trade Desk Inc (TTD) (+5.03%)
📰 News & Developments
Trade Desk Inc. continues to solidify its position as a leader in programmatic advertising, emphasizing independent demand-side platforms that empower advertisers with data-driven precision. Recent developments highlight the company’s expansion into connected TV and retail media networks, aligning with a strategic shift toward diversified revenue streams beyond traditional display ads. This approach capitalizes on the burgeoning demand for privacy-compliant targeting amid evolving industry trends like the cookieless future and AI-enhanced personalization.
Regulatory scrutiny in digital advertising, including data privacy laws, poses challenges but also opportunities for Trade Desk’s transparent, user-centric model. Market sentiment remains positive, buoyed by robust advertiser adoption and partnerships with major publishers. Looking ahead, the outlook is optimistic, with potential growth in emerging formats like audio and out-of-home advertising, positioning Trade Desk to navigate economic uncertainties while driving long-term innovation in the $600 billion global ad market.
📈 Technical Analysis
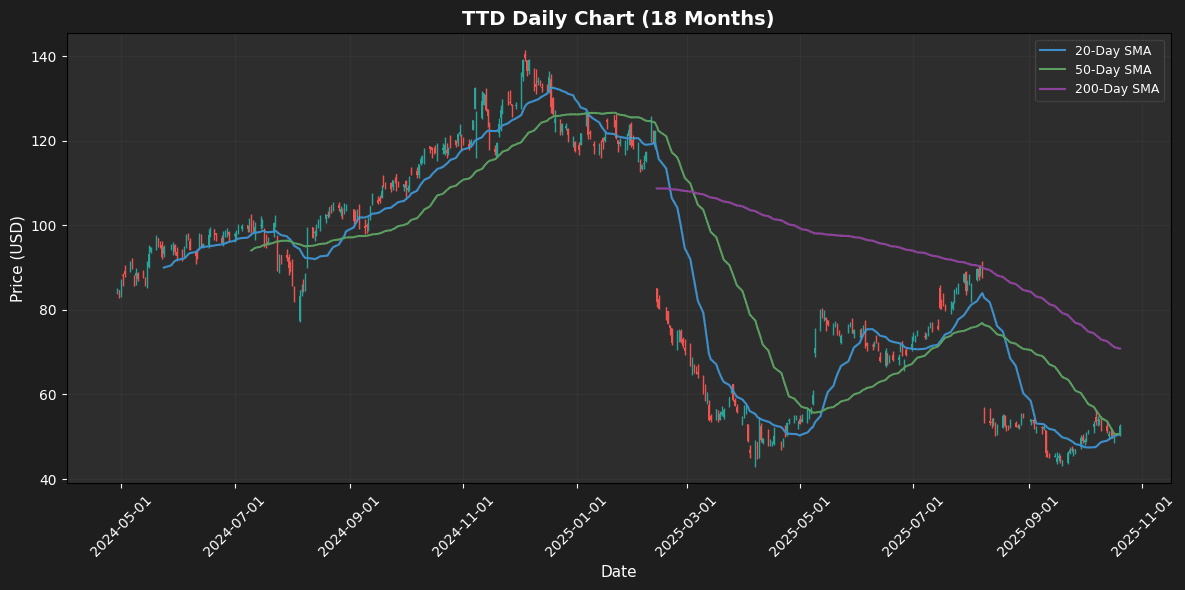
Trade Desk Inc (TTD) is currently trading at $52.49, indicating a short-term bullish sentiment as it is above the 20-day moving average (MA20) of $50.53 and the 50-day moving average (MA50) of $50.61. This positioning suggests potential support in the near term. However, the price remains significantly below the 200-day moving average (MA200) of $70.86, highlighting a longer-term bearish trend. The Relative Strength Index (RSI) is at 54.57, indicating neutral momentum with room for both upward and downward movements. The MACD is at -0.07, which signals a potential bearish crossover, warranting caution among traders. Key resistance levels to watch are around $55, while support appears to be around $50, linked to the recent moving averages.
⭐ Recent Analyst Ratings
| Date | Status | Outer | Rating | Price |
|---|---|---|---|---|
| 2025-10-06 00:00:00 | Reiterated | Wells Fargo | Equal Weight | $68 → $53 |
| 2025-09-10 00:00:00 | Downgrade | Morgan Stanley | Overweight → Equal-Weight | $50 |
| 2025-08-11 00:00:00 | Downgrade | Jefferies | Buy → Hold | $50 |
| 2025-08-11 00:00:00 | Downgrade | HSBC Securities | Buy → Hold | $56 |
Moderna Inc (MRNA) (+4.73%)
📰 News & Developments
Moderna Inc. continues to solidify its position as a leader in mRNA technology, leveraging its platform to advance beyond its flagship COVID-19 vaccine into a diversified pipeline. Key developments include ongoing clinical trials for respiratory vaccines, cancer immunotherapies, and treatments for rare diseases, reflecting a strategic shift toward long-term revenue streams amid waning pandemic demand.
The company’s business strategy emphasizes rapid innovation and partnerships, such as collaborations with global health organizations to accelerate product development. In the broader biotech industry, trends toward personalized medicine and mRNA applications are gaining momentum, positioning Moderna favorably against competitors.
Regulatory progress remains a highlight, with several investigational new drugs progressing through FDA and international reviews, though challenges in trial outcomes persist. Market sentiment is cautiously optimistic, buoyed by the company’s strong cash reserves and intellectual property portfolio. Looking ahead, Moderna’s outlook hinges on successful Phase 3 readouts and potential new approvals, potentially driving sustained growth in the evolving vaccine and therapeutics landscape.
📈 Technical Analysis
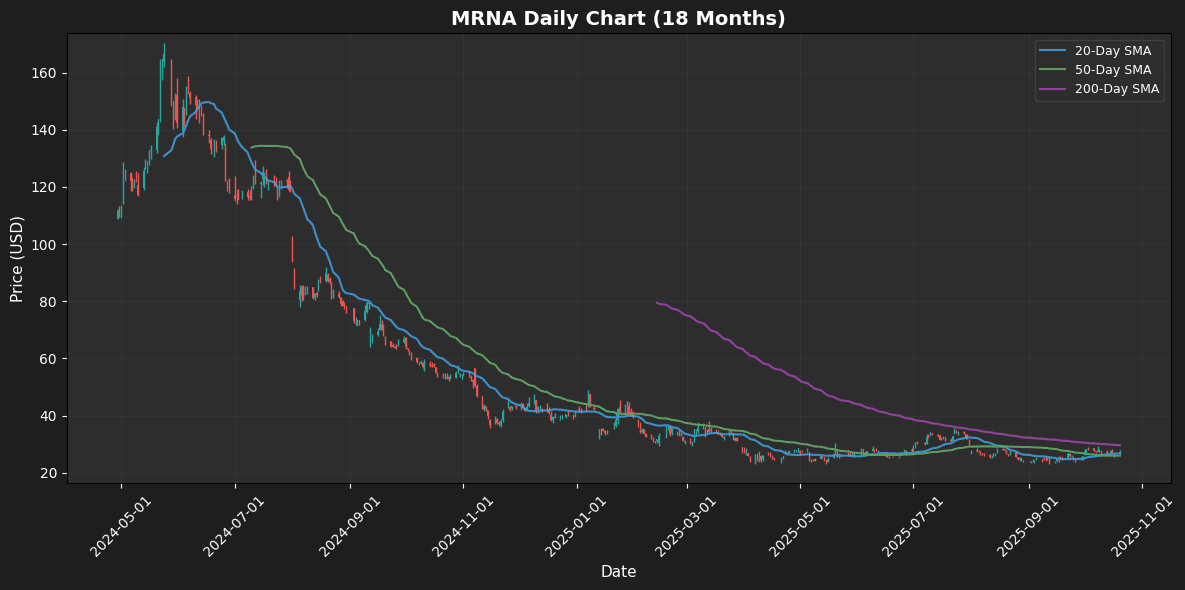
Moderna Inc (MRNA) is currently trading at $27.24, showing a slight bullish trend above its 20-day moving average (MA20) of $26.73, indicating short-term upward momentum. The stock is also above its 50-day moving average (MA50) of $25.97, which further supports positive sentiment. However, it remains below the longer-term 200-day moving average (MA200) at $29.65, suggesting potential resistance in the near term.
The Relative Strength Index (RSI) of 53.35 indicates that MRNA is neither overbought nor oversold, reflecting neutral momentum. The MACD value of 0.28 shows a bullish crossover, reinforcing short-term bullish sentiment. Key support is identified around the MA50, while resistance may emerge near the MA200, which will be critical for determining the next price movement.
⭐ Recent Analyst Ratings
| Date | Status | Outer | Rating | Price |
|---|---|---|---|---|
| 2025-03-13 00:00:00 | Initiated | Citigroup | Neutral | $40 |
| 2025-02-18 00:00:00 | Downgrade | Barclays | Overweight → Equal Weight | $111 → $45 |
| 2025-01-29 00:00:00 | Downgrade | Goldman | Buy → Neutral | $99 → $51 |
| 2024-12-18 00:00:00 | Downgrade | Argus | Buy → Hold |
Jacobs Solutions Inc (J) (+4.62%)
📰 News & Developments
Jacobs Solutions Inc continues to solidify its position as a leader in engineering and consulting services, emphasizing sustainable infrastructure and digital transformation amid evolving global demands. The company has advanced its strategic pivot toward high-growth sectors like water management and cybersecurity, integrating innovative technologies to enhance project delivery efficiency. In the broader industry, trends toward resilient urban development and net-zero emissions are driving partnerships and investments, with Jacobs at the forefront of adapting to these shifts.
Regulatory landscapes, particularly around environmental compliance and public-private partnerships, present both challenges and opportunities, prompting Jacobs to bolster its advisory capabilities. Market sentiment remains cautiously optimistic, reflecting the firm’s diversified portfolio and strong backlog. Looking ahead, Jacobs is well-positioned for expansion in emerging markets, leveraging its expertise to navigate economic uncertainties and capitalize on infrastructure spending surges, fostering long-term value creation.
📈 Technical Analysis
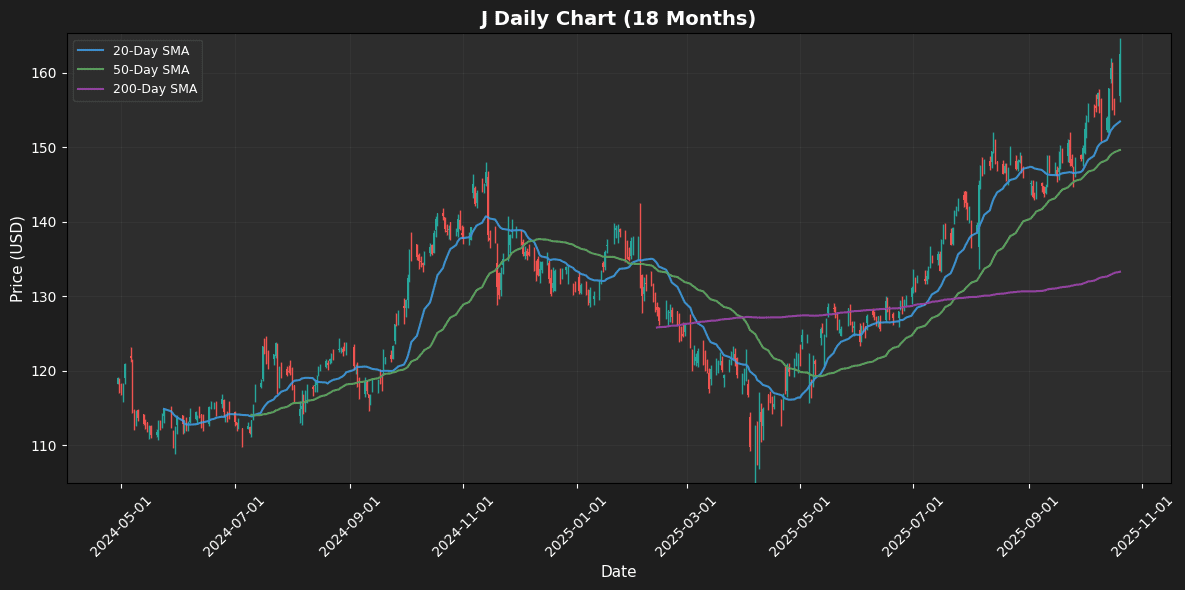
Jacobs Solutions Inc (J) is currently trading at $162.57, significantly above its moving averages, with MA20 at $153.49, MA50 at $149.65, and MA200 at $133.31. This positioning indicates a strong bullish trend, as the price consistently rises above key support levels. The RSI at 65.78 suggests that the stock is approaching overbought territory, indicating potential for a correction. The MACD of 2.97 reveals positive momentum, suggesting continued buying interest. Key support is found near the MA20, while resistance may emerge around recent highs. Overall, Jacobs Solutions demonstrates robust upward momentum, but traders should be cautious of potential profit-taking as RSI approaches overbought levels.
⭐ Recent Analyst Ratings
| Date | Status | Outer | Rating | Price |
|---|---|---|---|---|
| 2025-07-16 00:00:00 | Upgrade | KeyBanc Capital Markets | Sector Weight → Overweight | $155 |
| 2024-12-10 00:00:00 | Resumed | Goldman | Neutral | $150 |
| 2024-11-20 00:00:00 | Downgrade | The Benchmark Company | Buy → Hold | |
| 2024-10-04 00:00:00 | Upgrade | Raymond James | Mkt Perform → Outperform | $160 |
Salesforce Inc (CRM) (+4.61%)

📰 News & Developments
Salesforce Inc. has garnered renewed attention from analysts following a pivotal strategic meeting that highlighted the company’s evolving roadmap. This development underscores Salesforce’s commitment to enhancing its cloud-based customer relationship management (CRM) platform through deeper integration of artificial intelligence and data analytics, aligning with broader industry shifts toward AI-driven personalization and automation in enterprise software.
The meeting emphasized Salesforce’s focus on expanding its ecosystem of partnerships and acquisitions to bolster scalability and innovation, positioning the firm to capitalize on surging demand for hybrid work solutions and digital transformation. Amid a competitive landscape dominated by cloud giants, market sentiment remains optimistic, with analysts revising forecasts to reflect stronger growth potential amid economic uncertainties.
Looking ahead, Salesforce appears well-poised for sustained expansion, particularly in emerging markets and sectors like retail and healthcare, where regulatory pushes for data privacy could further solidify its leadership. Overall, these advancements signal a robust future outlook for the company in the dynamic SaaS arena.
📈 Technical Analysis
Salesforce Inc (CRM) is currently trading at $254.28, above its 20-day moving average (MA20) of $242.66 and 50-day moving average (MA50) of $244.15, indicating a bullish short-term outlook. However, it remains below the 200-day moving average (MA200) of $273.03, suggesting potential long-term resistance. The Relative Strength Index (RSI) at 58.0 indicates that CRM is neither overbought nor oversold, signaling a healthy momentum phase. The MACD at 0.18 confirms this positive momentum with upward movement. Key support is likely at the MA20 and MA50 levels, while resistance is identified near the MA200. Traders should monitor these moving averages for potential breakout or reversal signals.
⭐ Recent Analyst Ratings
| Date | Status | Outer | Rating | Price |
|---|---|---|---|---|
| 2025-10-14 00:00:00 | Downgrade | Northland Capital | Outperform → Market Perform | $264 |
| 2025-09-04 00:00:00 | Reiterated | BMO Capital Markets | Outperform | $335 → $280 |
| 2025-08-26 00:00:00 | Reiterated | Oppenheimer | Outperform | $370 → $315 |
| 2025-08-15 00:00:00 | Upgrade | DA Davidson | Underperform → Neutral | $225 |
Newmont Corp (NEM) (+4.54%)

📰 News & Developments
Newmont Corporation continues to navigate a dynamic gold mining landscape, with anticipation building around its upcoming third-quarter performance. The company has focused on operational efficiency and portfolio optimization, streamlining assets to enhance production resilience amid volatile commodity markets. Key developments include advancements in sustainable mining practices and strategic expansions in high-potential regions, aligning with broader industry shifts toward environmental stewardship and supply chain diversification.
Regulatory pressures in key jurisdictions emphasize stricter emissions standards and community engagement, prompting Newmont to invest in innovative technologies for reduced environmental impact. Market sentiment remains cautiously optimistic, driven by robust global demand for precious metals amid economic uncertainties. Analysts highlight potential upside in core metrics like output volumes and cost controls, positioning Newmont for sustained growth. Looking ahead, the company appears well-equipped to capitalize on favorable industry tailwinds, fostering long-term value creation in a recovering sector.
📈 Technical Analysis
Newmont Corp (NEM) is currently trading at $94.89, showing strength above its key moving averages. The price significantly exceeds the 20-day MA of $87.84, indicating a bullish short-term trend. Additionally, the 50-day MA at $79.57 further supports this uptrend, reflecting strong positive momentum. The long-term outlook is bolstered by the price being well above the 200-day MA of $57.98.
The RSI at 65.16 suggests NEM is approaching overbought territory, warranting careful observation for potential price corrections. Meanwhile, the MACD of 4.09 confirms bullish momentum, with potential for continuation if the price remains above recent support levels. Key resistance levels may emerge near Fibonacci retracement zones above $95, while support is likely around the 20-day MA. Overall, NEM exhibits a robust bullish trend with monitored momentum indicators.
⭐ Recent Analyst Ratings
| Date | Status | Outer | Rating | Price |
|---|---|---|---|---|
| 2025-10-13 00:00:00 | Upgrade | Goldman | Neutral → Buy | $104.30 |
| 2025-09-10 00:00:00 | Upgrade | RBC Capital Mkts | Sector Perform → Outperform | $95 |
| 2025-09-02 00:00:00 | Downgrade | Macquarie | Outperform → Neutral | $72 |
| 2025-07-09 00:00:00 | Initiated | Stifel | Buy | $73 |
ON Semiconductor Corp (ON) (+4.49%)
📰 News & Developments
ON Semiconductor Corp. continues to navigate a dynamic semiconductor landscape, buoyed by robust industry growth amid rising demand for analog and power management solutions. Recent developments highlight the company’s alignment with peers in capitalizing on expanding applications in automotive, industrial, and consumer electronics sectors. This positions onsemi favorably within a broader wave of semiconductor expansion, driven by innovation in electric vehicles and efficient power systems.
However, upcoming earnings reports signal potential challenges, with analysts anticipating a near-term decline due to supply chain pressures and market cyclicality. The company’s strategy emphasizes operational efficiency and strategic investments in silicon carbide technologies to sustain long-term competitiveness.
Market sentiment remains cautiously optimistic, reflecting confidence in onsemi’s fundamentals despite short-term headwinds. Looking ahead, sustained industry tailwinds could support recovery, provided the firm adeptly manages inventory and demand fluctuations for a resilient outlook.
📈 Technical Analysis
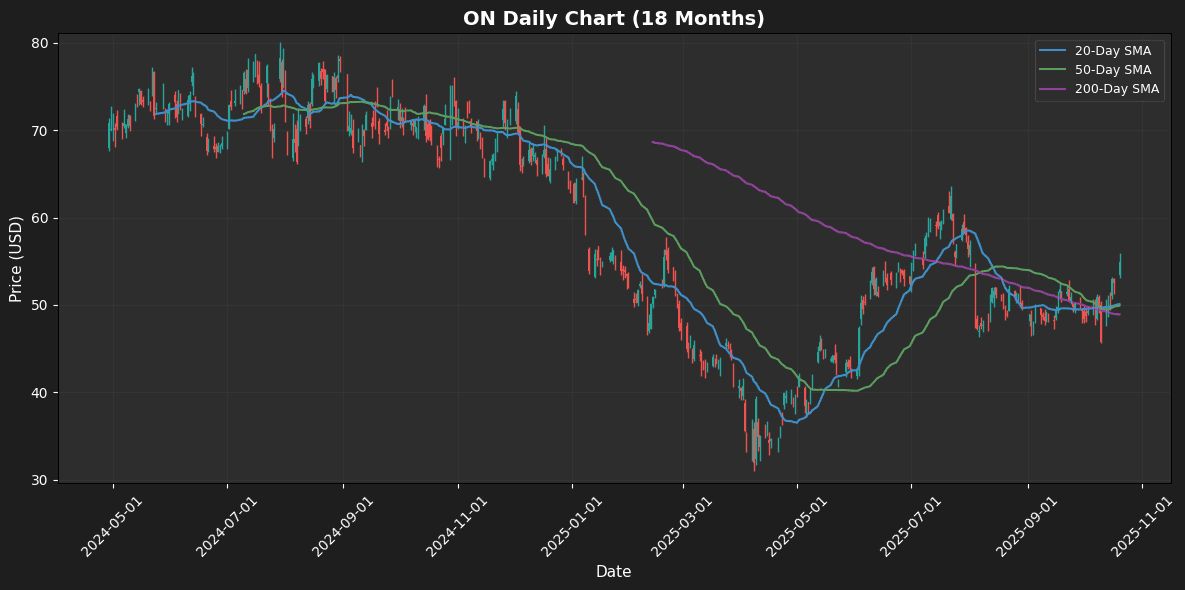
ON Semiconductor Corp (ON) is currently trading at $54.89, which positions the stock above its moving averages: MA20 at $50.11, MA50 at $49.93, and MA200 at $48.93. This upward trend suggests a bullish momentum, supported by the stock’s recent ability to maintain its price well above these key averages. The RSI at 61.93 indicates that the stock is not yet overbought, leaving room for continued upward movement. The MACD reading of 0.64 signals positive momentum, further confirming bullish sentiment. Immediate support can be anticipated around the MA20 and MA50 levels, while resistance may emerge near psychological levels around $55 and previous highs. Overall, ON appears poised for further gains if it maintains its current trend.
⭐ Recent Analyst Ratings
| Date | Status | Outer | Rating | Price |
|---|---|---|---|---|
| 2025-08-05 00:00:00 | Reiterated | TD Cowen | Buy | $68 → $55 |
| 2025-08-05 00:00:00 | Downgrade | BofA Securities | Buy → Neutral | $56 |
| 2025-07-10 00:00:00 | Initiated | Goldman | Neutral | $60 |
| 2025-06-18 00:00:00 | Initiated | Cantor Fitzgerald | Neutral | $55 |
EQT Corp (EQT) (+4.38%)
📰 News & Developments
EQT Corporation continues to demonstrate resilience in the natural gas sector, positioning itself favorably amid evolving energy dynamics. Recent analyses highlight the company’s potential to surpass earnings expectations, driven by operational efficiencies and robust production strategies that capitalize on its vast Appalachian Basin reserves. As global demand for cleaner energy sources intensifies, EQT stands to benefit from the growing role of natural gas as a bridge fuel in the transition to renewables, supporting expanded infrastructure investments.
Key developments include advancements in liquefied natural gas (LNG) projects, such as the approval of additional export capacity, which could enhance market access and revenue streams for major producers like EQT. Industry trends point to sustained demand growth, fueled by international energy needs and domestic grid reliability. Market sentiment remains optimistic, with investors viewing EQT’s disciplined capital allocation and low-cost structure as strengths. Looking ahead, EQT’s outlook is promising, bolstered by strategic hedging and potential for increased export volumes, though it must navigate geopolitical and environmental regulatory shifts.
📈 Technical Analysis
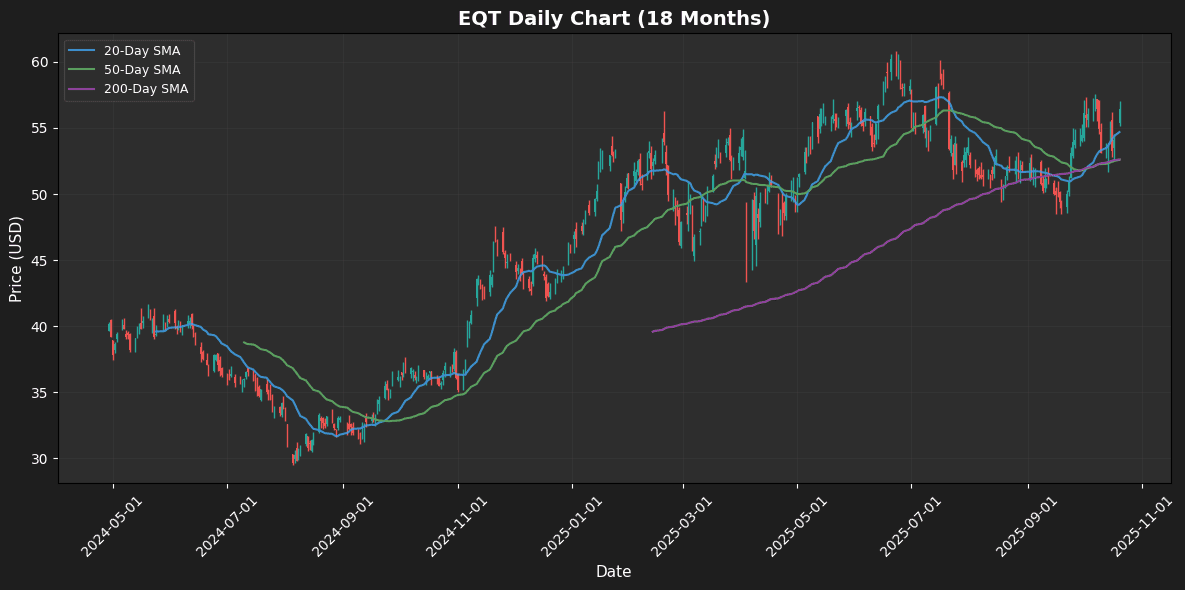
EQT Corp (EQT) is currently trading at $56.45, showing a bullish trend as it is above key moving averages. The 20-day moving average (MA20) at $54.69 indicates short-term momentum, while the 50-day (MA50) at $52.59 and 200-day (MA200) at $52.62 provide solid support levels. With the Relative Strength Index (RSI) at 59.41, EQT is nearing overbought territory but still has room for further upside. The Moving Average Convergence Divergence (MACD) at 0.65 suggests a positive momentum trend, reinforcing potential for price appreciation. Support can be found near the MA50 and MA200, while resistance is evident around recent highs. Overall, EQT appears poised for continued strength, maintaining a bullish outlook.
⭐ Recent Analyst Ratings
| Date | Status | Outer | Rating | Price |
|---|---|---|---|---|
| 2025-10-15 00:00:00 | Initiated | William Blair | Outperform | |
| 2025-08-20 00:00:00 | Initiated | Melius | Buy | $64 |
| 2025-07-08 00:00:00 | Resumed | Mizuho | Outperform | $66 |
| 2025-07-07 00:00:00 | Initiated | Barclays | Overweight | $65 |
Cooper Companies Inc (COO) (+4.20%)
📰 News & Developments
Cooper Companies Inc., a leading provider of medical devices and vision care products, is drawing attention from an activist investor who has acquired a substantial stake. This development signals potential pressure for strategic enhancements, including operational efficiencies or portfolio optimizations in the competitive healthcare sector. As demand for innovative eye care solutions and surgical devices grows amid aging populations and advancing telemedicine, the company is well-positioned to capitalize on these trends. However, regulatory scrutiny in medical device approvals remains a key challenge, requiring robust compliance. Market sentiment appears optimistic, reflecting investor confidence in Cooper’s fundamentals and growth potential. Looking ahead, the activist’s involvement could catalyze value-unlocking initiatives, such as divestitures or R&D accelerations, fostering a brighter outlook for sustained revenue expansion and shareholder returns in a resilient industry.
📈 Technical Analysis
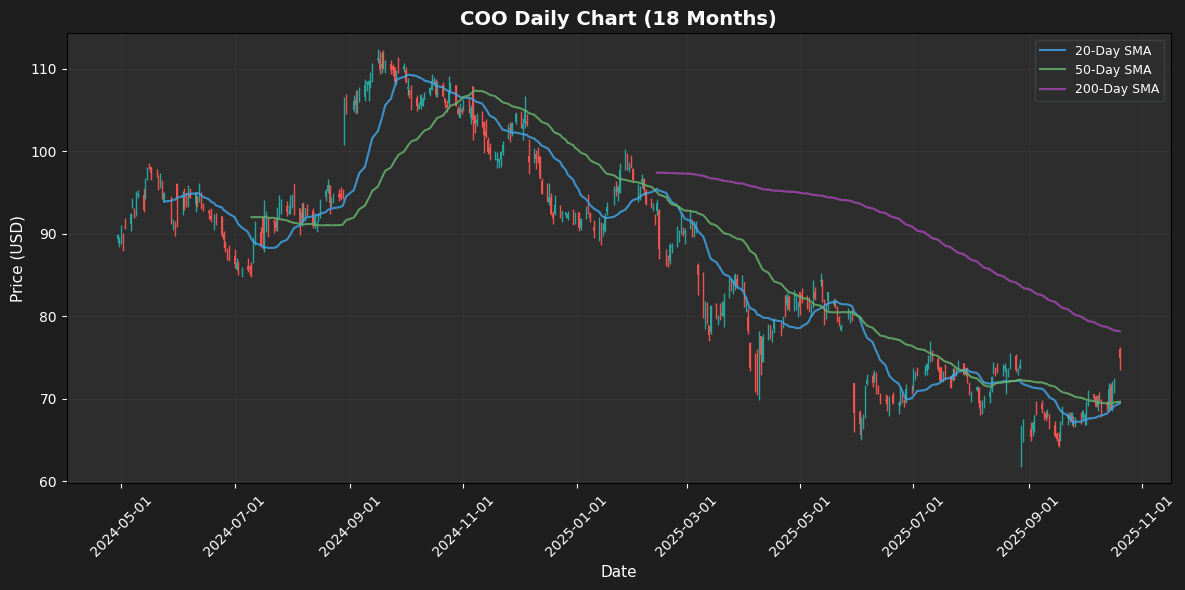
Cooper Companies Inc (COO) is currently trading at $74.99, above its 20-day moving average (MA20) of $69.47 and 50-day moving average (MA50) of $69.67, indicating a bullish short-term trend. However, it remains below the longer-term 200-day moving average (MA200) of $78.2, suggesting potential resistance ahead. The Relative Strength Index (RSI) at 64.84 indicates momentum, approaching overbought territory, which could imply a cooling-off period soon. The MACD at 0.93 shows a bullish crossover, confirming upward momentum. Key support levels lie around the MA20 and MA50, while resistance seems to be at the MA200 level. Overall, COO exhibits strong short-term momentum, but caution is warranted as it approaches resistance.
⭐ Recent Analyst Ratings
| Date | Status | Outer | Rating | Price |
|---|---|---|---|---|
| 2025-10-13 00:00:00 | Initiated | Barclays | Overweight | $85 |
| 2025-10-01 00:00:00 | Initiated | Goldman | Sell | $64 |
| 2025-08-28 00:00:00 | Downgrade | Citigroup | Buy → Neutral | $72 |
| 2025-07-22 00:00:00 | Upgrade | BNP Paribas Exane | Neutral → Outperform | $92 |
🔴 Worst 10 Performers
Seagate Technology Holdings Plc (STX) (-4.88%)
📰 News & Developments
Seagate Technology Holdings Plc continues to navigate a dynamic data storage landscape, capitalizing on surging demand for high-capacity hard disk drives amid the AI and cloud computing boom. Key developments include advancements in heat-assisted magnetic recording (HAMR) technology, enabling denser storage solutions that address enterprise needs for massive data centers. The company’s strategy emphasizes innovation in sustainable manufacturing and partnerships with hyperscalers to bolster supply chains resilient to global disruptions.
Industry trends point to a shift toward hybrid storage ecosystems, blending HDDs with SSDs, as edge computing and 5G proliferate. While regulatory scrutiny on semiconductor exports persists, Seagate maintains compliance through diversified operations. Market sentiment remains cautiously optimistic, driven by robust enterprise spending, though macroeconomic headwinds temper short-term gains. Looking ahead, Seagate’s focus on AI-optimized products positions it for sustained growth, potentially capturing a larger share of the exabyte-scale storage market by 2026.
📈 Technical Analysis
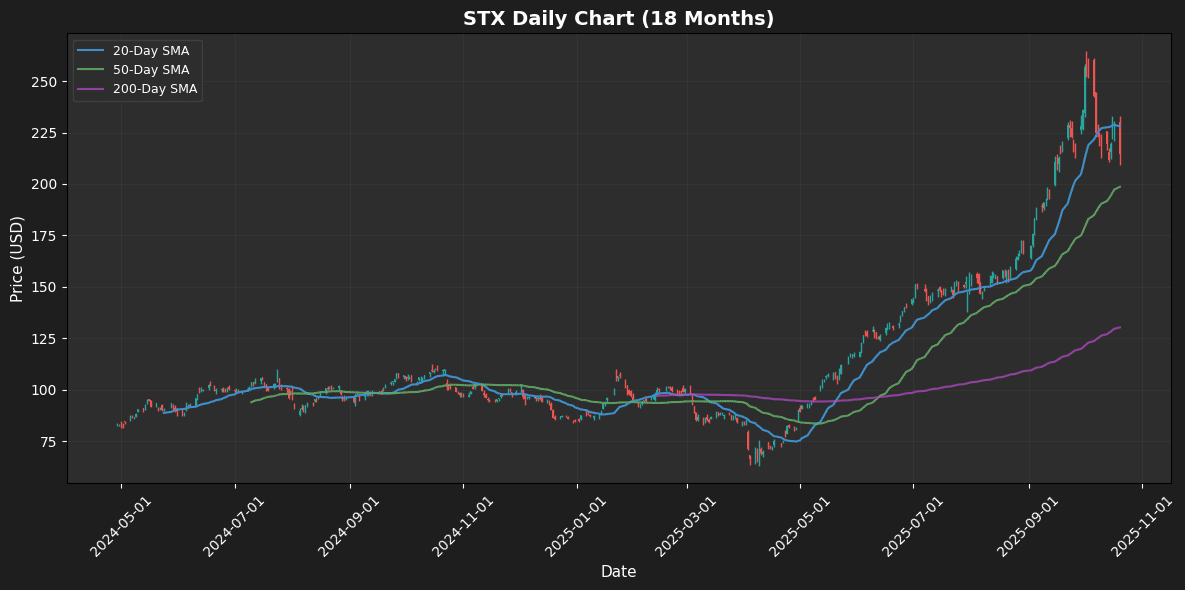
Seagate Technology Holdings Plc (STX) is currently trading at $214.4, sitting below its 20-day moving average of $227.99, which suggests a short-term bearish trend. The stock is above its 50-day moving average of $198.62, indicating a stronger medium-term outlook, while the significant gap between the price and the 200-day moving average of $130.25 highlights long-term bullish momentum. The RSI at 48.17 reflects neutral momentum, suggesting neither overbought nor oversold conditions, which could indicate potential consolidation. The MACD reading of 4.66, positioned above the signal line, suggests a bullish crossover, reinforcing positive momentum in the near term. Key support can be identified around the 50-day MA, while resistance appears at the 20-day MA.
⭐ Recent Analyst Ratings
| Date | Status | Outer | Rating | Price |
|---|---|---|---|---|
| 2025-09-24 00:00:00 | Reiterated | BofA Securities | Buy | $215 → $255 |
| 2025-09-16 00:00:00 | Initiated | Bernstein | Outperform | $250 |
| 2025-07-30 00:00:00 | Upgrade | Cantor Fitzgerald | Neutral → Overweight | $175 |
| 2025-07-30 00:00:00 | Reiterated | TD Cowen | Buy | $135 → $175 |
Oracle Corp (ORCL) (-4.85%)

📰 News & Developments
Oracle Corporation continues to demonstrate robust momentum in its strategic pivot toward cloud-based solutions and AI-driven innovations. Recent enhancements to its public safety suite underscore a commitment to real-time data intelligence, enabling agencies to modernize operations and improve response capabilities, as evidenced by adoption from a Minnesota first responder organization. In the healthcare sector, Oracle’s health technology is gaining traction, with a major Canadian health sciences center selecting it to streamline patient and caregiver experiences, highlighting the company’s focus on interoperability and user-centric platforms.
This aligns with broader industry trends toward digital transformation in public services and healthcare, where demand for secure, scalable data systems is surging. Market sentiment remains optimistic, positioning Oracle as a key player in long-term growth amid evolving regulatory landscapes emphasizing data privacy and efficiency. Looking ahead, the upcoming annual stockholder meeting signals confidence in sustained innovation, with potential for expanded market share in high-growth verticals through 2026.
📈 Technical Analysis
Oracle Corp (ORCL) currently trades at $277.18, showing potential weakness as it is below its 20-day moving average (MA20) of $293.27, indicating a short-term downtrend. The price is above the 50-day MA of $272.25, which may serve as a key support level. The 200-day MA at $200.19 provides a longer-term bullish outlook, reinforcing the overall uptrend. The Relative Strength Index (RSI) at 45.34 suggests that ORCL is approaching neutral territory, indicating that there could be potential for either a reversal or continuation of the current trend. The MACD reading of 5.04 supports this, showing a bullish momentum that could help lift the price if it breaks resistance at MA20. Traders should watch for price movements around these key levels for further direction.
⭐ Recent Analyst Ratings
| Date | Status | Outer | Rating | Price |
|---|---|---|---|---|
| 2025-10-13 00:00:00 | Reiterated | BMO Capital Markets | Outperform | $345 → $355 |
| 2025-10-09 00:00:00 | Initiated | Robert W. Baird | Outperform | $365 |
| 2025-09-25 00:00:00 | Initiated | Rothschild & Co Redburn | Sell | $175 |
| 2025-09-10 00:00:00 | Upgrade | Citigroup | Neutral → Buy | $410 |
Constellation Energy Corporation (CEG) (-4.27%)
📰 News & Developments
Constellation Energy Corporation (CEG) continues to solidify its position as a leader in the clean energy sector, leveraging its extensive portfolio of nuclear and renewable assets to meet growing demand for sustainable power. Recent strategic moves emphasize expanding carbon-free electricity production, including investments in advanced nuclear technologies and grid modernization initiatives. This aligns with broader industry trends toward decarbonization, as utilities worldwide pivot to low-emission sources amid escalating climate goals.
Regulatory developments, such as supportive policies for nuclear energy extensions and clean energy tax incentives, bolster CEG’s operational framework, enhancing long-term viability. Market sentiment remains optimistic, driven by the company’s resilient fundamentals and commitment to operational efficiency, even in a volatile energy landscape. Looking ahead, CEG’s focus on innovation and strategic partnerships positions it for sustained growth, potentially capitalizing on rising electrification trends and energy security needs through 2030 and beyond.
📈 Technical Analysis
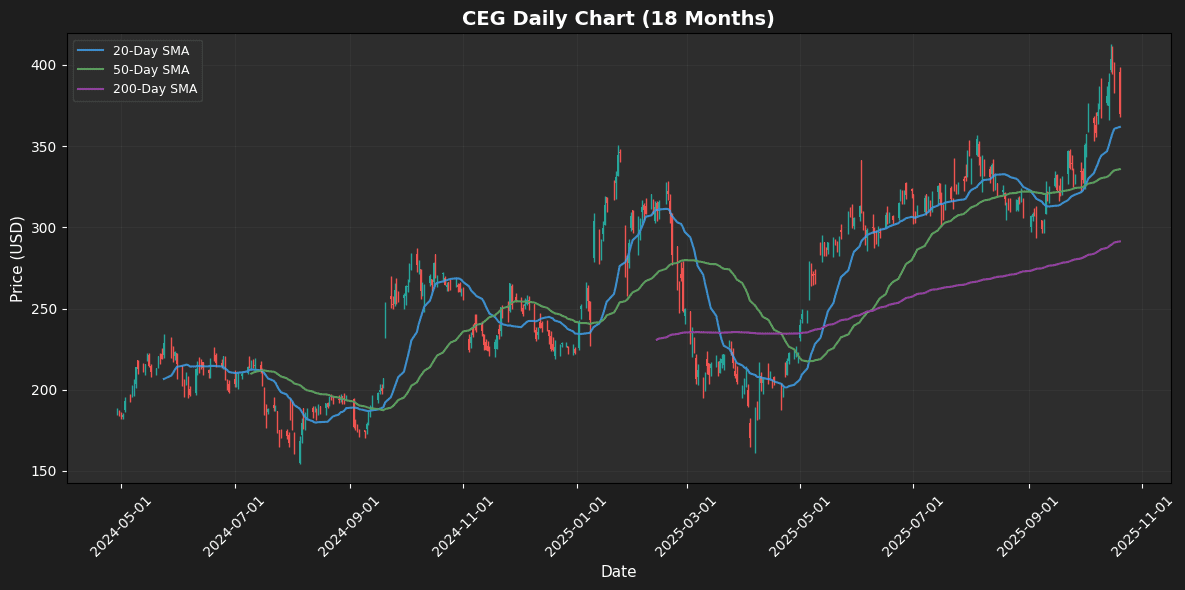
Constellation Energy Corporation (CEG) is currently trading at $370.0, marking a strong position relative to its moving averages. The price is above the 20-day MA of $361.87, indicating short-term bullish momentum. The 50-day MA at $335.84 and the 200-day MA at $291.39 further substantiate a solid upward trend, suggesting robust long-term strength.
The RSI at 54.58 signals neutrality, indicating that CEG is neither overbought nor oversold. Meanwhile, the MACD of 15.87 points to increasing bullish momentum, reinforcing the positive technical outlook. Key support levels may be found around the 20-day and 50-day MAs, while potential resistance could surface at previous highs. Overall, CEG appears well-positioned for sustained upward movement within a constructive technical framework.
⭐ Recent Analyst Ratings
| Date | Status | Outer | Rating | Price |
|---|---|---|---|---|
| 2025-10-08 00:00:00 | Upgrade | Seaport Research Partners | Neutral → Buy | $407 |
| 2025-09-22 00:00:00 | Initiated | Scotiabank | Sector Outperform | $401 |
| 2025-08-20 00:00:00 | Initiated | Melius | Buy | $462 |
| 2025-06-13 00:00:00 | Initiated | Raymond James | Outperform | $326 |
Western Digital Corp (WDC) (-3.70%)
📰 News & Developments
Western Digital Corporation continues to capture significant investor interest amid a robust recovery in the data storage sector. The company has demonstrated impressive operational momentum, driven by strategic expansions in NAND flash and HDD technologies to meet escalating demand from cloud computing and AI applications. Industry trends point to sustained growth in data center infrastructure, positioning Western Digital favorably against competitors in the evolving digital economy. While no major regulatory shifts have impacted operations recently, the firm’s focus on innovation and cost efficiencies underscores a resilient business strategy. Market sentiment remains bullish, with analysts highlighting the company’s undervalued fundamentals and potential for continued expansion. Looking ahead, Western Digital’s outlook appears promising, supported by anticipated increases in enterprise storage needs and a recovering semiconductor supply chain, potentially solidifying its role as a key player in the tech landscape.
📈 Technical Analysis
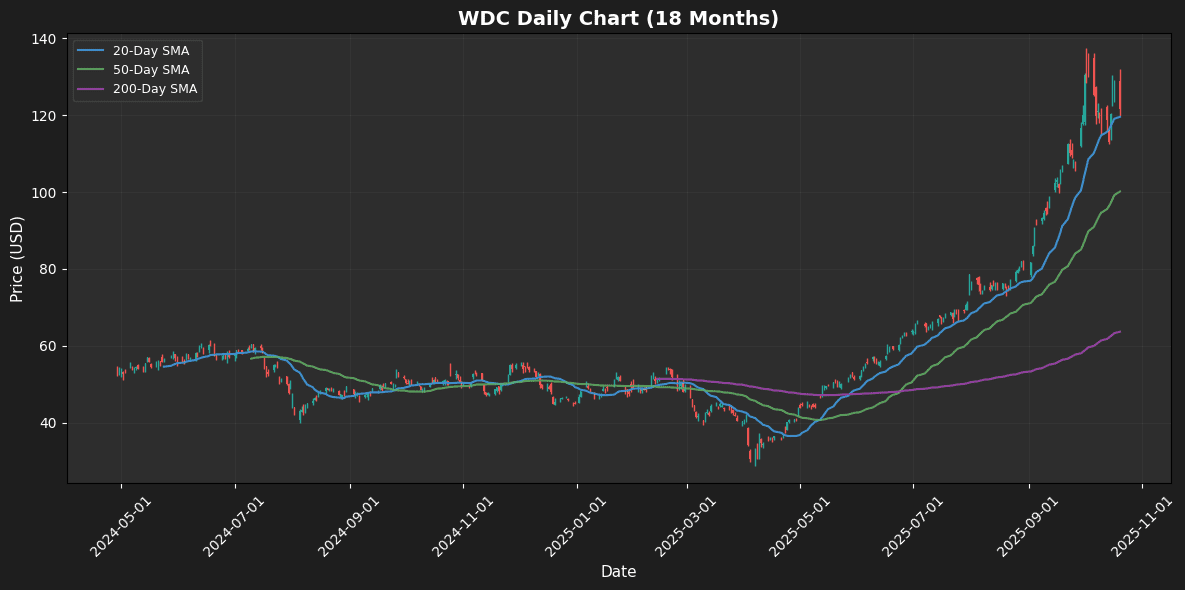
Western Digital Corp (WDC) is currently trading at $121.53, exhibiting a strong uptrend as indicated by its price being significantly above the 20-day moving average (MA20) of $119.58, the 50-day moving average (MA50) of $100.14, and the 200-day moving average (MA200) of $63.65. This positive positioning suggests robust momentum in the short to medium term.
The Relative Strength Index (RSI) at 58.26 signals that WDC is approaching overbought territory, indicating a potential consolidation phase ahead. The MACD value of 6.1 further supports bullish sentiment, reflecting a recent increase in buying momentum. Key support levels can be identified around the MA20 and MA50, while resistance may emerge near prior highs. Overall, WDC shows strong bullish trends with solid momentum indicators, albeit a need for cautious assessment as it approaches overbought levels.
⭐ Recent Analyst Ratings
| Date | Status | Outer | Rating | Price |
|---|---|---|---|---|
| 2025-09-29 00:00:00 | Reiterated | Rosenblatt | Buy | $90 → $125 |
| 2025-09-16 00:00:00 | Initiated | Bernstein | Mkt Perform | $96 |
| 2025-07-31 00:00:00 | Reiterated | TD Cowen | Buy | $58 → $90 |
| 2025-07-10 00:00:00 | Initiated | Goldman | Neutral | $70 |
Vistra Corp (VST) (-3.53%)
📰 News & Developments
Vistra Corp continues to solidify its position as a leading integrated power company in the U.S., leveraging a diverse portfolio that spans natural gas, nuclear, solar, and battery storage assets. Recent strategic moves, including the acquisition of Energy Harbor, have enhanced its nuclear generation capacity, aligning with the company’s focus on reliable, low-carbon energy solutions. This expansion supports Vistra’s broader business strategy of transitioning toward sustainable operations amid rising demand from data centers and electrification trends in the energy sector.
Industry-wide, the push for decarbonization and grid resilience is accelerating, driven by technological advancements and policy incentives for renewables. Regulatory developments, such as federal support for clean energy infrastructure, further bolster Vistra’s initiatives. Market sentiment remains positive, reflecting confidence in the company’s operational efficiency and growth potential. Looking ahead, Vistra is well-positioned to capitalize on evolving energy needs, with a promising outlook for long-term value creation through innovation and strategic partnerships.
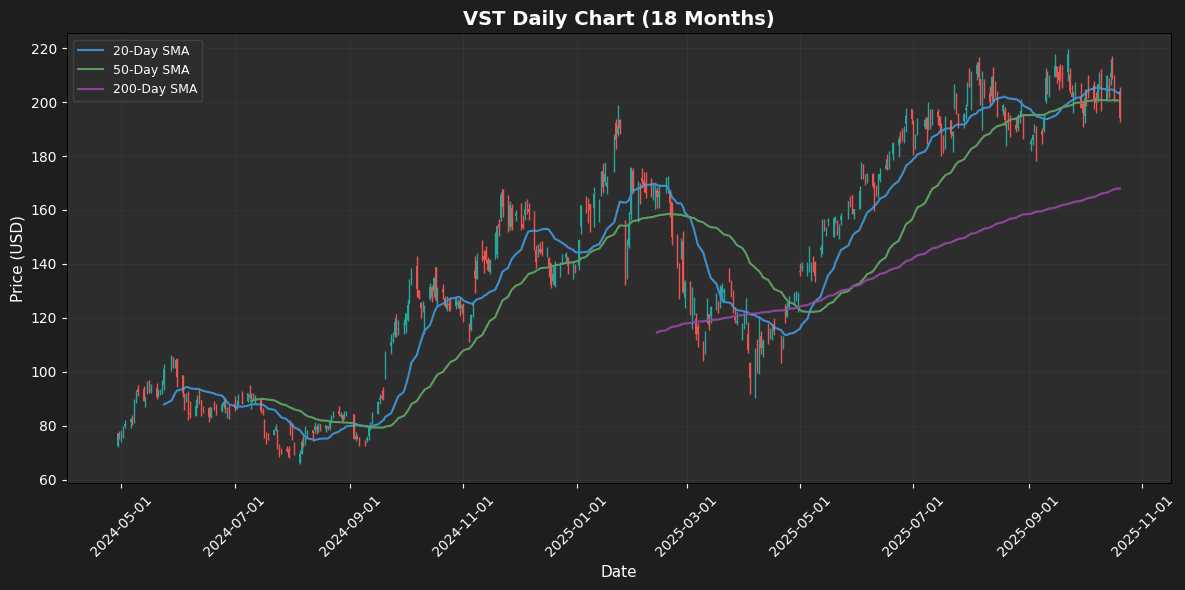
📈 Technical Analysis
Vistra Corp (VST) is currently trading at $194.24, indicating it is below key moving averages: the 20-day MA at $203.02 and the 50-day MA at $200.56, suggesting a short-term bearish outlook. The 200-day MA at $168.02, however, provides a solid long-term support level. The RSI at 43.5 indicates that VST is approaching neutral territory, with potential for further downside if it slips below this level. The MACD at 0.47 shows slight bullish momentum, yet it remains under the signal line, hinting at a potential reversal if the momentum strengthens. Key resistance levels to monitor are near the 20-day and 50-day moving averages. A break below recent lows could trigger further selling pressure.
⭐ Recent Analyst Ratings
| Date | Status | Outer | Rating | Price |
|---|---|---|---|---|
| 2025-10-16 00:00:00 | Initiated | TD Cowen | Buy | $250 |
| 2025-09-23 00:00:00 | Downgrade | Jefferies | Buy → Hold | $230 |
| 2025-09-22 00:00:00 | Initiated | Scotiabank | Sector Outperform | $256 |
| 2025-09-17 00:00:00 | Upgrade | Daiwa Securities | Neutral → Buy | $250 |
Progressive Corp (PGR) (-2.76%)
📰 News & Developments
Progressive Corp continues to draw analyst attention amid a dynamic insurance landscape, underscoring its robust fundamentals in personal auto and property coverage. Recent highlights emphasize the company’s disciplined underwriting approach and data-driven innovations, such as advanced telematics for personalized risk assessment, which enhance customer retention and operational efficiency. As the industry grapples with escalating claims from climate-related events and supply chain disruptions, Progressive’s focus on technology integration positions it to navigate volatility effectively.
Market sentiment remains optimistic, reflecting confidence in the firm’s diversified portfolio and strong balance sheet. Regulatory scrutiny on premium pricing and coverage accessibility persists, prompting Progressive to prioritize transparent policies and compliance. Looking ahead, the company is poised for sustained growth, leveraging digital transformation to capture market share in a competitive sector and capitalize on recovering consumer spending trends.
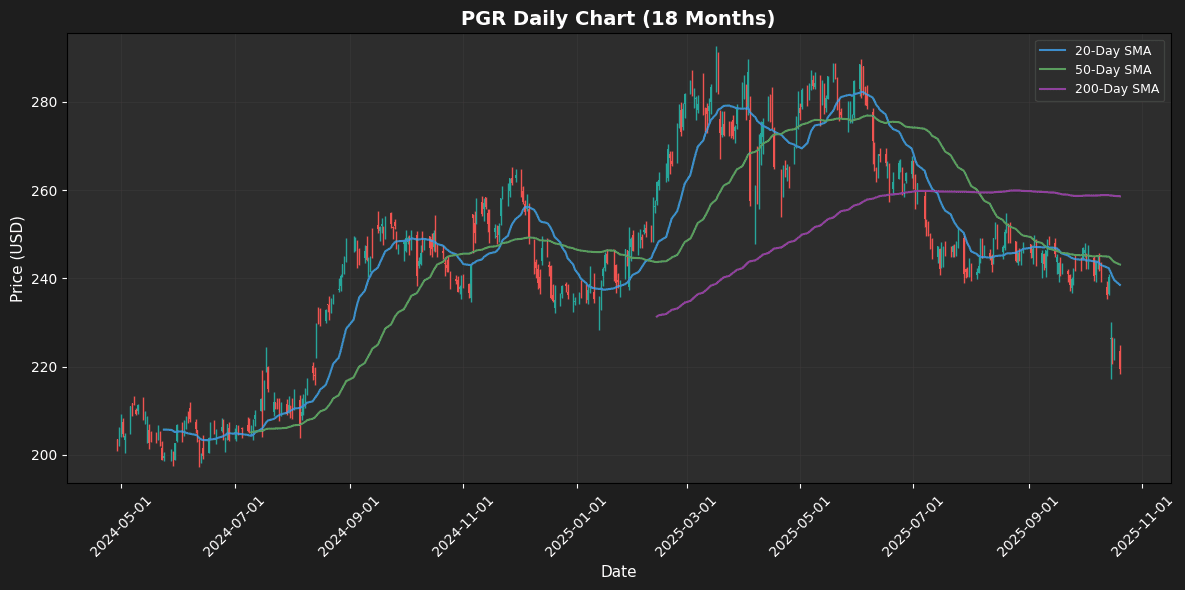
📈 Technical Analysis
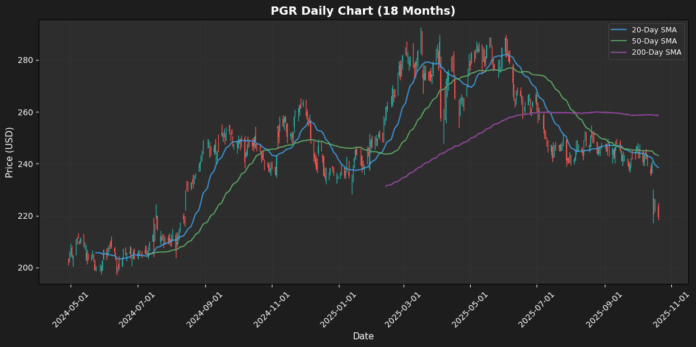
Progressive Corp (PGR) is currently trading at $219.38, significantly below its key moving averages, with the 20-day MA at $238.51, 50-day MA at $243.13, and 200-day MA at $258.60. This suggests a bearish trend, indicating that recent price action has been weaker than historical averages. The RSI is at 29.49, signaling oversold conditions, which may suggest a potential reversal, but caution is warranted due to continued downward momentum. The negative MACD of -5.23 reinforces the prevailing bearish sentiment. Traders should monitor potential support levels around $210, while resistance remains at the 20-day MA. A sustained move above $238.51 would signal a possible trend reversal, while failure to hold support could lead to further declines.
⭐ Recent Analyst Ratings
| Date | Status | Outer | Rating | Price |
|---|---|---|---|---|
| 2025-10-20 | Downgrade | Morgan Stanley | Equal-Weight → Underweight | $214 |
| 2025-09-18 00:00:00 | Downgrade | Wells Fargo | Overweight → Equal Weight | $265 |
| 2025-09-17 00:00:00 | Downgrade | BMO Capital Markets | Outperform → Market Perform | $250 |
| 2025-09-16 00:00:00 | Initiated | Wolfe Research | Peer Perform |
Jabil Inc (JBL) (-2.54%)
📰 News & Developments
Jabil Inc., a leading global manufacturing solutions provider, continues to navigate a dynamic landscape marked by technological innovation and supply chain evolution. Recent company developments highlight strategic expansions in diversified end-markets, including healthcare, automotive, and renewable energy, underscoring Jabil’s commitment to agile production capabilities. The firm’s business strategy emphasizes sustainability initiatives, such as reducing carbon footprints across operations, aligning with broader industry trends toward circular economies and digital transformation.
Regulatory developments in international trade and environmental standards are prompting Jabil to enhance compliance frameworks, ensuring resilience amid geopolitical shifts. Market sentiment remains cautiously optimistic, buoyed by the company’s robust fundamentals in electronics assembly and design services, which position it well against inflationary pressures. Looking ahead, Jabil’s focus on AI-driven automation and partnerships in emerging technologies signals a promising outlook for sustained growth and market leadership in the contract manufacturing sector.
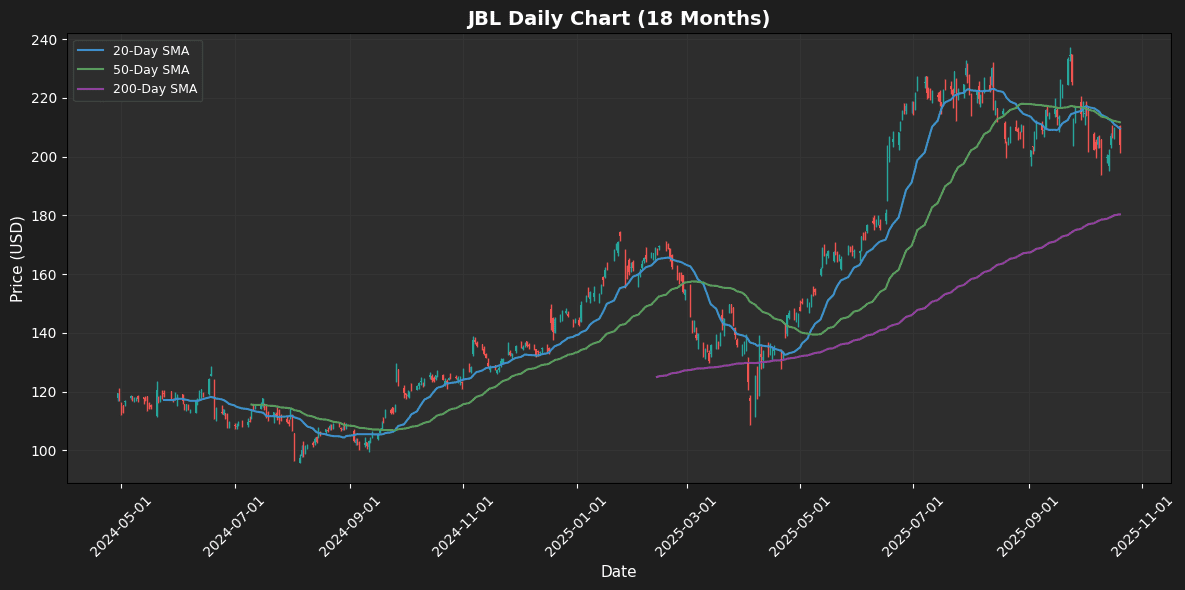
📈 Technical Analysis
Jabil Inc (JBL) is currently priced at $204.02, showing a slight bearish trend as it trades below the 20-day moving average (MA20) of $209.53 and the 50-day moving average (MA50) of $211.71. The stock’s 200-day moving average (MA200) stands at $180.34, indicating a longer-term bullish trend, as the price remains significantly above this level. The Relative Strength Index (RSI) at 45.12 suggests that the stock is nearing neutral territory, indicating potential for a rebound or further consolidation. The MACD, at -2.66, is below the signal line, which may suggest declining momentum in the short term. Key support is anticipated around the MA200 level, while resistance is seen at the MA20 and MA50. Traders should watch for a potential reversal as the stock navigates this range.
⭐ Recent Analyst Ratings
| Date | Status | Outer | Rating | Price |
|---|---|---|---|---|
| 2025-07-02 00:00:00 | Resumed | Stifel | Buy | $245 |
| 2025-06-18 00:00:00 | Upgrade | Argus | Hold → Buy | |
| 2024-03-19 00:00:00 | Downgrade | Argus | Buy → Hold | |
| 2024-01-17 00:00:00 | Reiterated | Barclays | Overweight | $153 → $151 |
Kenvue Inc (KVUE) (-2.16%)
📰 News & Developments
Kenvue Inc., the leading consumer health company, continues to demonstrate resilience amid evolving market dynamics. Recent developments highlight its robust portfolio of essential brands, driving consistent revenue growth through innovation in self-care and over-the-counter solutions. The company’s strategy emphasizes operational efficiency and targeted investments in high-margin categories like skin health and pain relief, positioning it to navigate inflationary pressures effectively.
In the broader industry, trends toward preventive wellness and e-commerce expansion are bolstering demand for Kenvue’s products, even as supply chain challenges persist. Regulatory environments remain supportive, with no significant hurdles impeding product launches or market access.
Market sentiment is increasingly optimistic, fueled by Kenvue’s commitment to shareholder returns via sustainable dividends, attracting income-focused investors. Looking ahead, the outlook is promising, with potential for organic growth and strategic acquisitions to enhance its global footprint in a recovering economy.
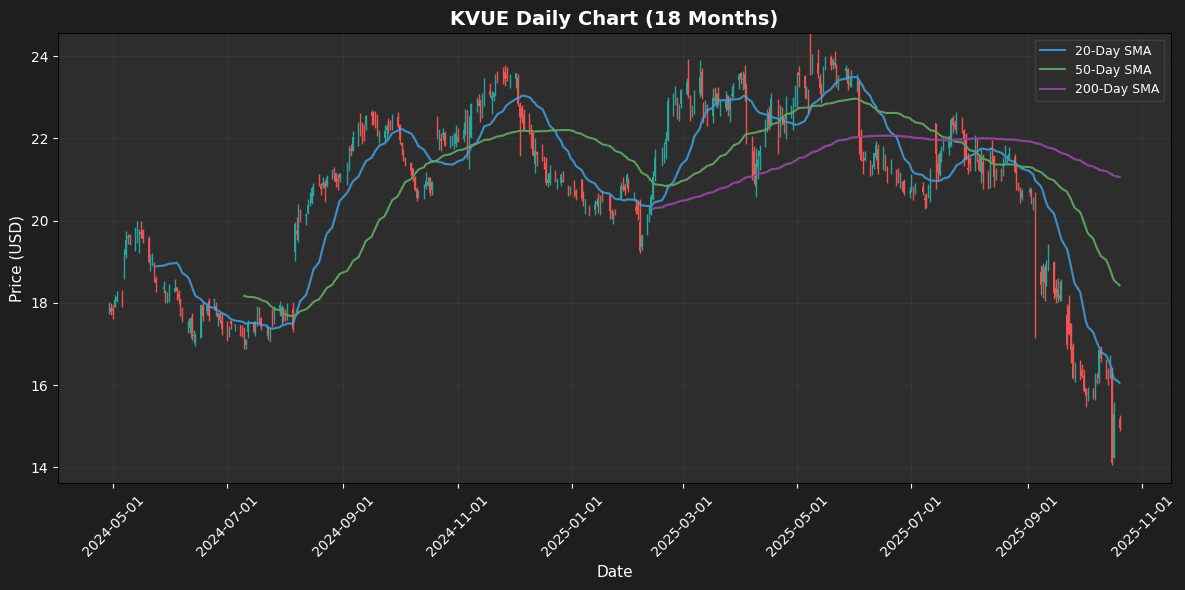
📈 Technical Analysis
Kenvue Inc (KVUE) is currently trading at $14.96, significantly below its 20-day moving average (MA20) of $16.06, indicating a bearish short-term trend. The 50-day (MA50) and 200-day moving averages (MA200) stand at $18.42 and $21.06, respectively, highlighting a longer-term downtrend. The stock’s RSI of 36.12 suggests it is nearing oversold territory, which could trigger a potential reversal if buying momentum increases. The negative MACD of -0.86 reinforces the bearish sentiment, signaling that downward momentum persists. Key support levels appear to be forming around $14.00, while resistance is evident at $16.06 (MA20). Traders may look for a convergence of momentum indicators and price action to identify potential entry points as the stock approaches support.
⭐ Recent Analyst Ratings
| Date | Status | Outer | Rating | Price |
|---|---|---|---|---|
| 2025-09-26 00:00:00 | Upgrade | Rothschild & Co Redburn | Neutral → Buy | $22 |
| 2025-04-10 00:00:00 | Initiated | Redburn Atlantic | Neutral | $23.50 |
| 2025-03-24 00:00:00 | Initiated | Evercore ISI | In-line | $25 |
| 2025-01-06 00:00:00 | Upgrade | Piper Sandler | Neutral → Overweight | $21 → $26 |
Ulta Beauty Inc (ULTA) (-1.84%)
📰 News & Developments
Ulta Beauty Inc. continues to navigate a dynamic retail landscape amid escalating trade tensions, as potential tariffs on imported goods threaten to compress margins in the beauty sector. The company’s robust omnichannel strategy, blending physical stores with a strong e-commerce presence, has driven steady customer loyalty and sales growth, particularly through exclusive partnerships with premium brands. Industry trends point to rising consumer demand for clean beauty and personalized experiences, positioning Ulta favorably against competitors. However, regulatory shifts around international trade could elevate supply chain costs, prompting Ulta to explore domestic sourcing and pricing adjustments to maintain profitability.
Market sentiment remains cautiously optimistic, buoyed by Ulta’s focus on experiential retail and loyalty programs that enhance customer retention. Looking ahead, the company’s emphasis on innovation and expansion into underserved markets suggests resilience, though sustained tariff pressures may challenge short-term earnings. Overall, Ulta’s adaptive business model underscores a positive long-term outlook in a recovering beauty industry.
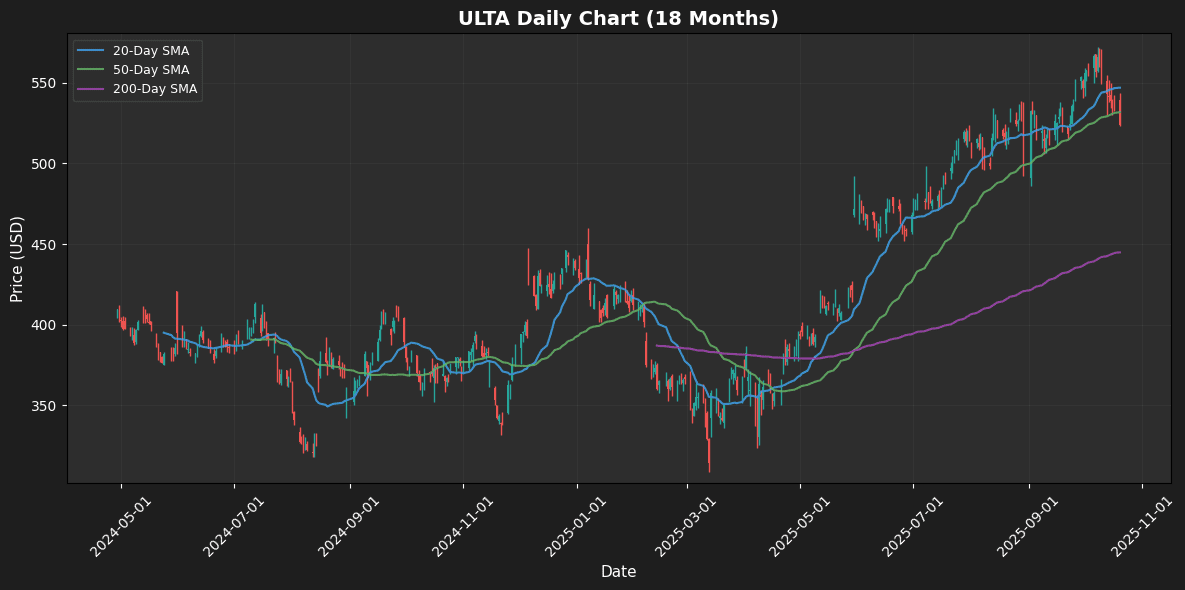
📈 Technical Analysis
Ulta Beauty Inc. (ULTA) is currently trading at $523.72, below its 20-day moving average (MA20) of $546.97, indicating a bearish short-term trend. The 50-day moving average at $531.79 also sits above the current price, suggesting continued downward momentum. With a 200-day moving average of $444.93, the stock remains in a longer-term bullish phase, but the failure to maintain prices above the shorter-term averages may trigger increased selling pressure.
The Relative Strength Index (RSI) at 40.43 reflects a lack of momentum, nearing oversold territory, which could suggest a potential reversal if buying interest returns. The MACD of 1.32 further supports this notion, indicating that downward momentum could be waning. Key support levels are near the 200-day MA, while resistance is evident at the MA20 and MA50. Monitoring these levels is crucial for future price action.
⭐ Recent Analyst Ratings
| Date | Status | Outer | Rating | Price |
|---|---|---|---|---|
| 2025-09-25 00:00:00 | Upgrade | Argus | Hold → Buy | $570 |
| 2025-09-04 00:00:00 | Resumed | Piper Sandler | Overweight | $590 |
| 2025-08-29 00:00:00 | Reiterated | Telsey Advisory Group | Outperform | $590 → $610 |
| 2025-08-25 00:00:00 | Reiterated | Telsey Advisory Group | Outperform | $520 → $590 |
Incyte Corp (INCY) (-1.60%)
📰 News & Developments
Incyte Corporation continues to demonstrate strong momentum in the biotechnology sector, driven by its robust pipeline of innovative therapies targeting oncology and immunology. Recent positive regulatory updates have highlighted advancements in key drug candidates, potentially accelerating approvals and expanding market access. This aligns with the company’s strategic focus on precision medicine and partnerships to enhance R&D efficiency amid evolving industry trends toward targeted treatments and faster regulatory pathways.
Market sentiment remains upbeat, reflecting investor confidence in Incyte’s fundamentals, including steady revenue growth from flagship products and a diversified portfolio. As the biotech landscape shifts toward value-driven innovations, these developments position Incyte favorably for sustained growth. Looking ahead, successful navigation of regulatory milestones could further solidify its competitive edge, fostering long-term shareholder value in a dynamic therapeutic environment.
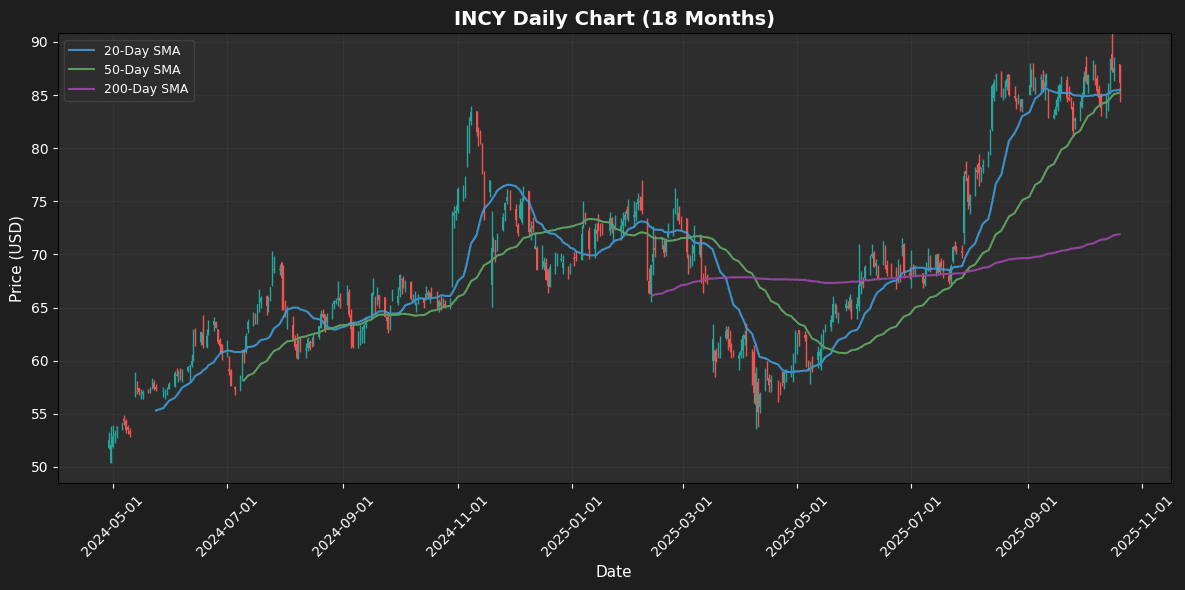
📈 Technical Analysis
Incyte Corp (INCY) is currently trading at $86.17, showing a positive divergence from its 20-day moving average (MA20) of $85.49 and 50-day moving average (MA50) of $85.23, indicating short-term bullish momentum. The stock remains well above its 200-day moving average (MA200) of $71.89, signaling a solid long-term uptrend.
The Relative Strength Index (RSI) at 52.81 suggests that INCY is in neutral territory, lacking overbought or oversold conditions, which may provide room for further upward movement. Additionally, the MACD value of 0.73 indicates a potential bullish crossover, reinforcing upward momentum. Key support levels are around the MA50 and MA200, while resistance could emerge at recent highs near $88. Overall, the technical indicators suggest a cautious bullish outlook for Incyte Corp.
⭐ Recent Analyst Ratings
| Date | Status | Outer | Rating | Price |
|---|---|---|---|---|
| 2025-10-08 00:00:00 | Downgrade | Oppenheimer | Outperform → Perform | |
| 2025-08-06 00:00:00 | Upgrade | Wells Fargo | Equal Weight → Overweight | $89 |
| 2025-08-01 00:00:00 | Initiated | Barclays | Overweight | $90 |
| 2025-06-16 00:00:00 | Upgrade | Stifel | Hold → Buy | $107 |
Disclaimer
The content on MarketsFN.com is provided for educational and informational purposes only. It does not constitute financial advice, investment recommendations, or trading guidance. All investments involve risks, and past performance does not guarantee future results. You are solely responsible for your investment decisions and should conduct independent research and consult a qualified financial advisor before acting. MarketsFN.com and its authors are not liable for any losses or damages arising from your use of this information.


