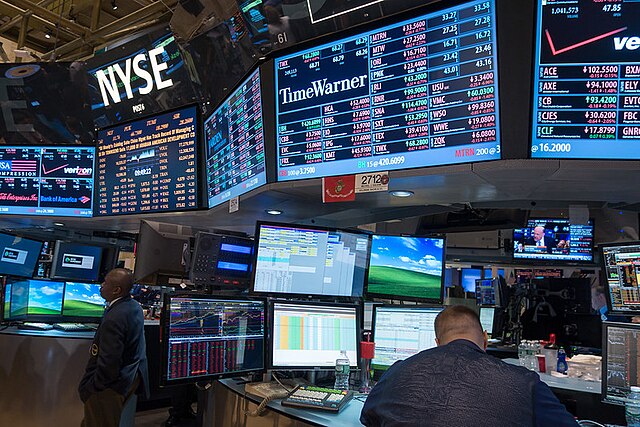
# STZ | NYSE | Q1 FY 2026 Earnings Release
In the first quarter of Fiscal Year 2026, Constellation Brands Inc. continued to proactively address consumer demand challenges driven by the current socioeconomic environment by executing strategic objectives:
– **Beer Business Performance**:
– Reported a **2% decrease** in net sales, primarily due to a **3.3% decline in shipment volumes** affected by consumer demand headwinds.
– Operating margin decreased by **150 basis points** to **39.1%** due to factors like increased COGS, marketing investments, and lower fixed cost absorption benefits.
– Depletions decreased by **2.6%**, with declines in Modelo Especial, Corona Extra, and Modelo Chelada brands offset by growth in Pacifico, resulting in a 1.2% depletion decline when adjusted.
– Modelo Especial, Corona Extra, and Pacifico were among the **top dollar share gainers** in the U.S. beer category, with Pacifico showing double-digit growth.
– Beer Business expects **net sales and operating income growth of 0-3%** and **0-2%** respectively for FY 2026.
– **Wine and Spirits Business**:
– Net sales declined by **28%** due to a **30.4% decrease in shipment volumes** driven by the impact of the SVEDKA Divestiture and consumer demand challenges.
– Operating margin decreased to **(2.1%)** due to marketing and other SG&A efficiencies more than offset by lower distributor payments.
– Post the 2025 Wine Divestitures, their portfolio is aligned towards higher-growth, higher-margin brands, showing U.S. depletion growth of approximately 2%.
– Expects **organic net sales decline of 17-20%** and **organic operating income decline of 97-100%** in FY 2026.
– **Financial Highlights**:
– **Reported EPS** of **$2.90** and **comparable EPS** of **$3.22**, representing a **decrease of 39%** and **10%** respectively from the same quarter last year.
– **Operating cash flow** decreased by **8%** to **$637 million** while **free cash flow** increased by **41%** to **$444 million**, driven by fiscal 2026 investments.
– Revised **FY 2026 reported EPS outlook to $12.07 – $12.37** while maintaining **comparable EPS outlook of $12.60 – $12.90**.
– Continued returns to shareholders with **over $300 million in share repurchases** in the first quarter of FY 2026.
– **Outlook**:
– **Operating cash flow target** of **$2.7 – $2.8 billion** and **free cash flow projection** of **$1.5 – $1.6 billion** are unchanged for FY 2026.
– Expects **net sales growth of 0-3%** and **operating income growth of 0-2%** for the Beer Business, and **organic net sales decline of 17-20%** and **organic operating income decline of 97-100%** for the Wine and Spirits Business.
Constellation Brands Inc. remains committed to its strategic priorities, balanced capital allocation, and delivering value to shareholders amidst ongoing challenges in consumer demand and market conditions.
## BALANCE SHEET
**CONDENSED CONSOLIDATED BALANCE SHEETS (in millions)**
| May 31, 2025 | February 28, 2025 | |
|---|---|---|
| Current Assets: | ||
| Cash and Cash Equivalents | $73.9 | $68.1 |
| Accounts Receivable | $813.3 | $736.5 |
| Inventories | $1,411.9 | $1,437.2 |
| Prepaid Expenses and Other | $628.1 | $561.1 |
| Assets Held for Sale | $1,014.1 | $913.5 |
| Total Current Assets | $3,941.3 | $3,716.4 |
| Property, Plant, and Equipment | $7,719.7 | $7,409.8 |
| Goodwill | $5,156.8 | $5,126.8 |
| Intangible Assets | $2,533.5 | $2,532.3 |
| Deferred Income Taxes | $1,755.3 | $1,805.3 |
| Other Assets | $1,156.1 | $1,061.7 |
| Total Assets | $22,262.7 | $21,652.3 |
| Current Liabilities: | ||
| Short-term Borrowings | $377.5 | $806.7 |
| Current Maturities of Long-term Debt | $1,403.0 | $1,402.0 |
| Accounts Payable | $979.5 | $939.8 |
| Other Accrued Expenses and Liabilities | $934.1 | $886.7 |
| Total Current Liabilities | $3,694.1 | $4,035.2 |
| Long-term Debt, less Current Maturities | $9,786.5 | $9,289.0 |
| Deferred Income Taxes and Other Liabilities | $1,250.0 | $1,193.3 |
| Total Liabilities | $14,730.6 | $14,517.5 |
| CBI Stockholders’ Equity | $7,265.5 | $6,882.0 |
| Noncontrolling Interests | $266.6 | $252.8 |
| Total Stockholders’ Equity | $7,532.1 | $7,134.8 |
| Total Liabilities and Stockholders’ Equity | $22,262.7 | $21,652.3 |
This provides a summary of the Income Statement and Balance Sheet tables extracted from the document.


