DJIA Dow Jones Industrial Average
On a weekly chart the index is getting closes to 4th quarter 2022 highs. It managed to rise above the 61.8% Fibonacci retracement from its January 2022 highs to its October 2022 lows. Below this month low in area 33,900 possible a change of market sentiment.
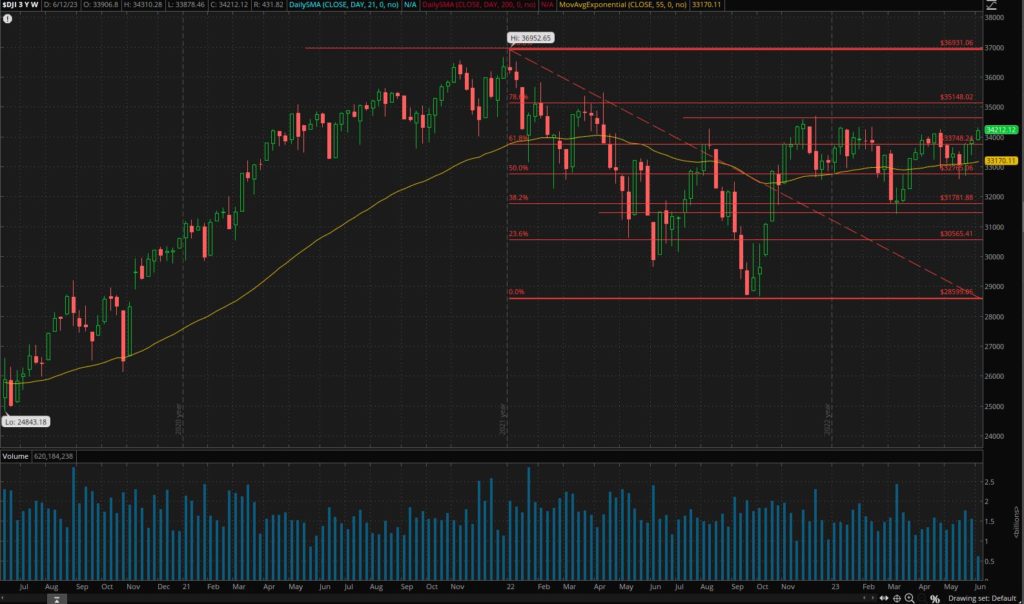
R1 34.615
R2 35,000
R3 35,470
S1 33,900
S2 33,400
S3 33,000
Crude Oil WTI
The commodity is off its 2023 low 63.64 $/barrel reached on the 4th of May and developed a range. Below 67 possible slide to 63.60. If sellers would gain control then a test of 60$/barrel seems likely. The daily chart is showing possible upside as well, with more momentum to develop in case of a breakout above 74.6. Crude Oil it may test then its 200 day SMA, now in area 78.7 and then 80 $/barrel.
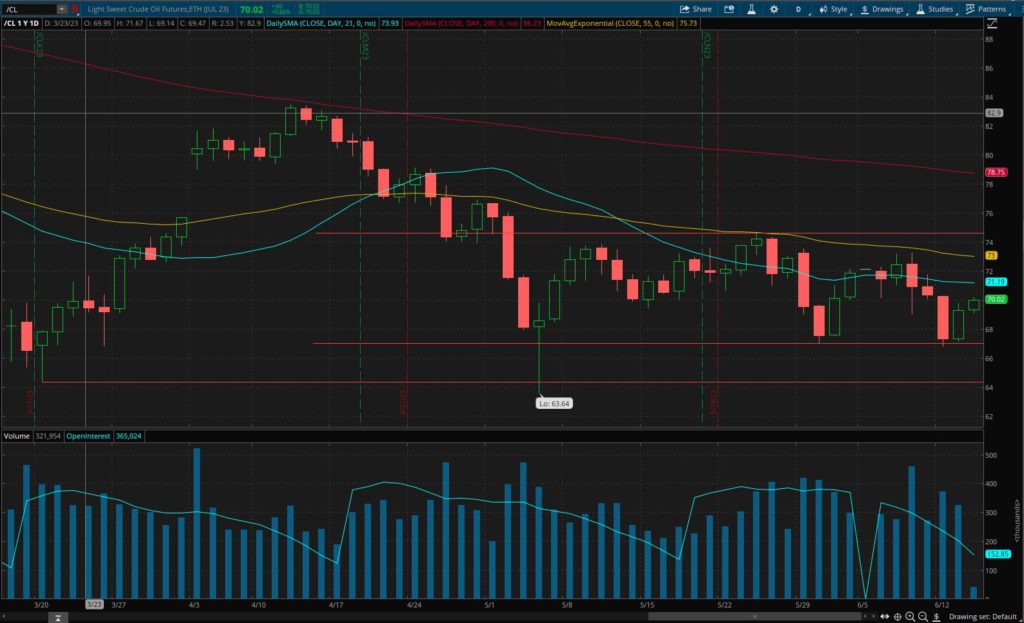
R1 74.6
R2 78.7
R3 80
S1 67
S2 63.6
S3 60
Tesla Inc. TSLA
Weekly chart showing that TSLA is facing resistance against 50% Fibonacci retracement in area 260$. Above this level is likely to see the test of the supply line that links lower highs and the 61.8% Fibonacci retracement in area 300. A breakout of this area would probably trigger momentum to retest its record high 414.5. In case of bearish scenario, supports at 250 , 225 and 200 are the most relevant key support to consider.
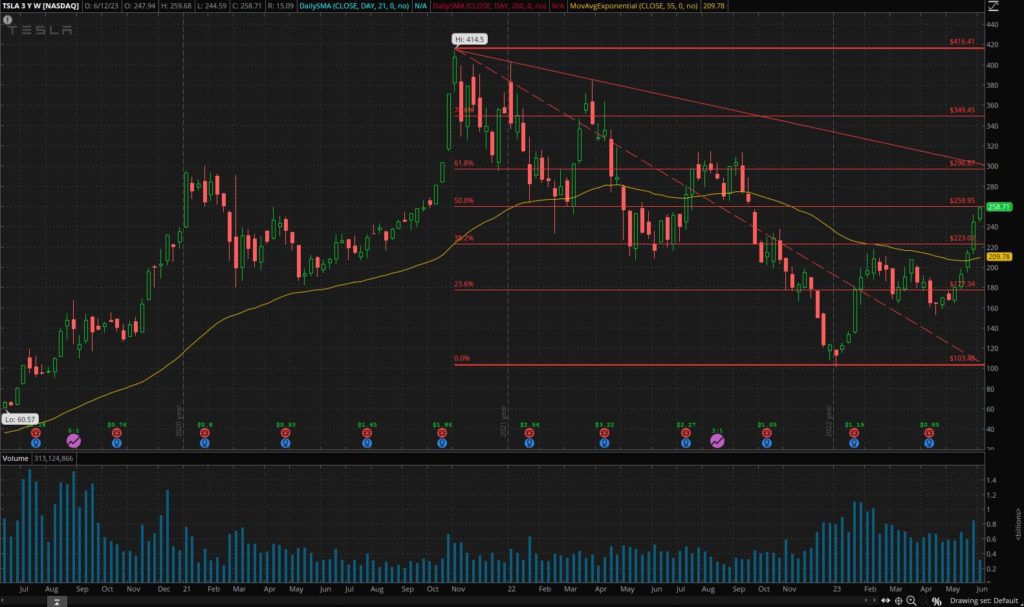
R1 260
R2 300
R3 414.5
S1 250
S2 225
S3 200
EURUSD
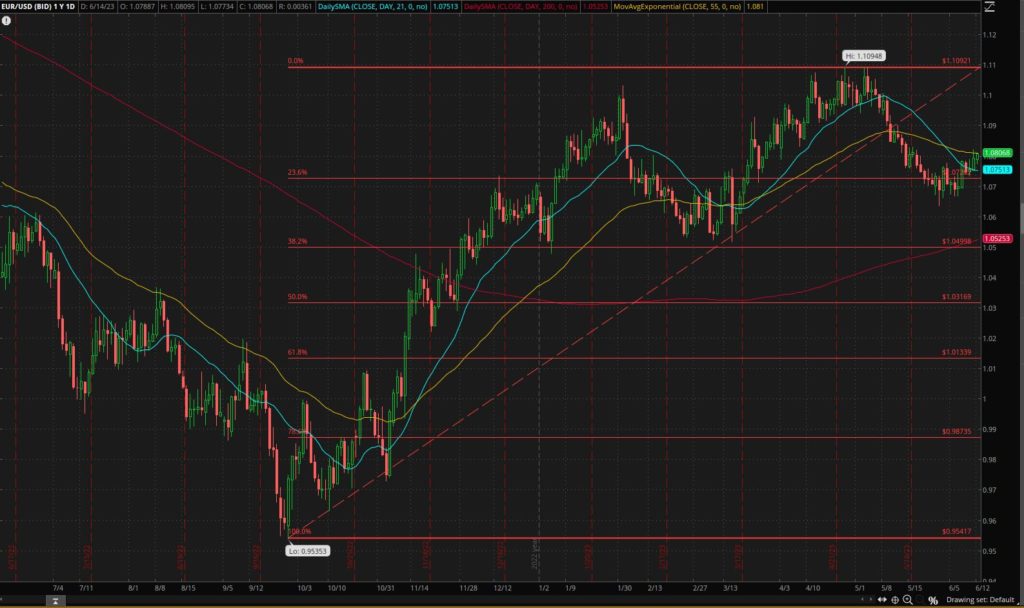
On a weekly chart the pair seems ready to retest its 2023 high of last month near 1.1092. Above this level area 1.14 is likely to be the nearest relevant resistance. Below 1.063 the pair can test 1.05 and 1.03 , the 50% Fibonacci retracement of the bullish wave started on October 2022.
R1 1.1092
R2 1.12
R3 1.14
S1 1.060
S2 1.05
S3 1.03


