Recent Price Action
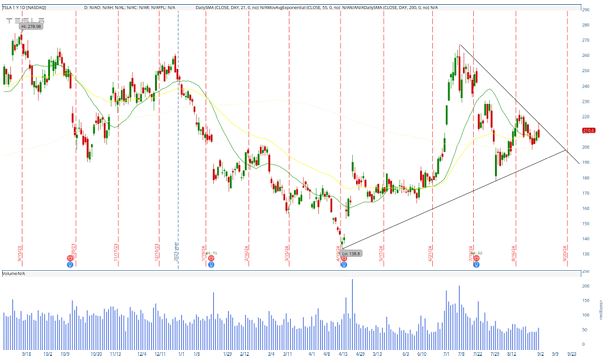
Tesla Inc. (TSLA) has shown signs of weakness in its recent trading sessions, closing at $210.60 on September 3rd, down 1.64% for the day. The stock has been fluctuating around the $210-$220 range over the past few days, struggling to maintain momentum. The decline on this day came after an attempt to break above the 20-day Simple Moving Average (SMA), which has been acting as a short-term resistance level. The stock’s inability to close above this level signals continued bearish sentiment. Volume was moderate, suggesting that the selling pressure, while present, was not overwhelming. The chart also shows that TSLA has slipped below the 50-day SMA, which is a critical medium-term support level, further indicating potential downside risk.
Large Trend
In the broader context, TSLA has been in a somewhat volatile trading range since mid-July 2024, following a significant rally that started in May 2024. The stock has been making lower highs since reaching a peak near $280 in July, forming a descending trendline that suggests increasing downward pressure. The long-term trend, however, remains somewhat intact as the stock is still trading above the 200-day SMA and the upward-sloping trendline that began in May. This indicates that while the short-term trend has turned bearish, the long-term bullish trend has not yet been fully negated. The 200-day SMA, sitting below the current price, provides a crucial support level that could prevent a more significant sell-off.
Forecasts of Supports and Resistances
Tesla’s chart presents a cautious outlook. The recent price action, particularly the failure to break above the 20-day SMA and the drop below the 50-day SMA, suggests that the stock may face further downward pressure. If TSLA fails to hold the $210 level, which has provided some support in recent weeks, it could see a decline towards $200, where the long-term trendline and the 200-day SMA converge. This area is a significant support level and could act as a strong defense against further declines. However, if this support fails, the next major support would be around $180, the lows seen in May 2024.
On the upside, if TSLA manages to regain momentum and break above the 20-day SMA, it would likely face resistance around $220, where it has struggled in recent sessions. A successful move above this level could open the door for a retest of the $240-$250 range, where the descending trendline from the July high and the previous support turned resistance are located. However, given the current bearish momentum, the $210 support level will be crucial to watch. A break below this level could signal a more extended downturn, while a successful defense could provide a base for a potential recovery.


