The Brand House Collective, Inc., founded in 1966 by Carl T. Kirkland and headquartered in Brentwood, TN, is a prominent U.S. retailer specializing in home decor and gifts. The company’s product range includes framed art, mirrors, wall decor, candles, lamps, accent furniture, textiles, and garden accessories, along with a wide variety of seasonal holiday merchandise.
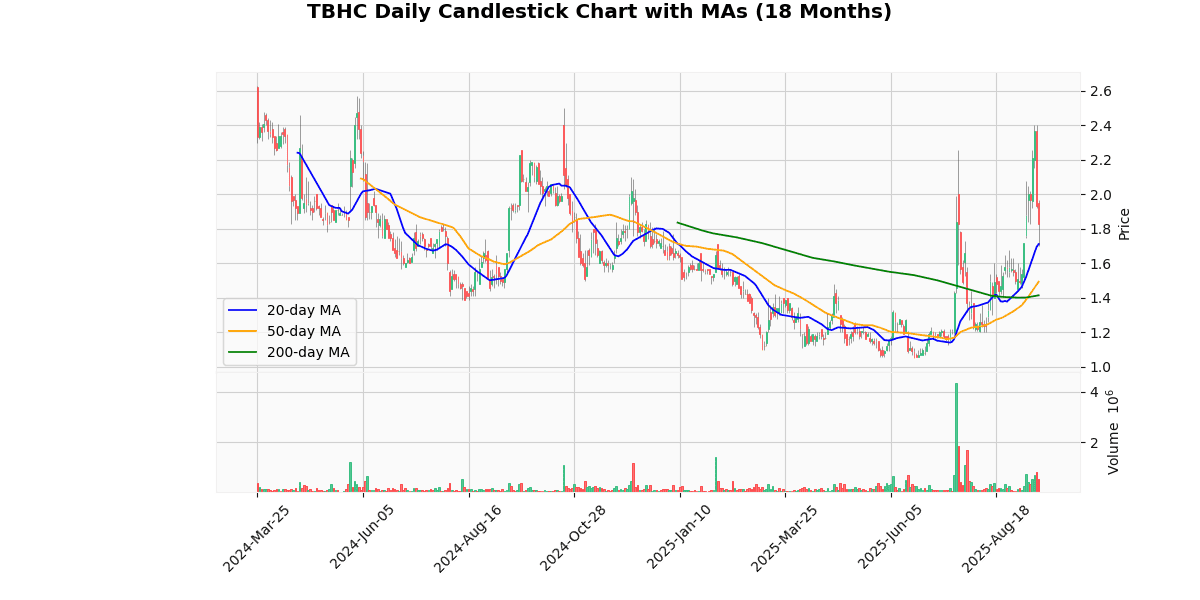
The current price of the asset is $1.83, reflecting a significant drop of 5.35% today. This price is considerably lower than both the 52-week and YTD highs of $2.5 and $2.4, respectively, indicating a -26.8% and -23.75% decline from these peaks. Conversely, the price has appreciated 74.29% from both the 52-week and YTD lows of $1.05, showing substantial recovery within the year.
The asset’s price is above all moving averages (MA20, MA50, MA200), suggesting a bullish trend in the shorter term despite today’s decline. The percentage differences above these averages (6.89% above MA20, 22.47% above MA50, and 29.33% above MA200) reinforce this trend.
The Relative Strength Index (RSI) at 54.74 indicates neither overbought nor oversold conditions, suggesting moderate momentum. The positive MACD value (0.17) supports the presence of upward momentum, although it’s relatively weak.
Overall, the asset shows a positive trend over the longer term despite recent volatility and today’s sharp price drop. The proximity to recent lows and the position above moving averages might offer a favorable outlook for recovery, provided the market conditions do not deteriorate.
## Price Chart

The Brand House Collective, Inc. (Nasdaq: TBHC) reported its financial results for the second quarter of fiscal 2025, ending August 2, 2025. The company experienced a decline in net sales, reporting $75.8 million, down 12.5% from $86.3 million in the same quarter the previous year. This decrease was primarily due to a 9.7% drop in consolidated comparable sales and a 5% reduction in store count. Gross profit also fell to $12.4 million, or 16.3% of net sales, compared to $17.7 million or 20.5% of net sales in Q2 2024.
Operating expenses slightly increased to $31.1 million, representing 41.1% of net sales. The company reported a significant net loss of $20.2 million, or $0.90 per diluted share, worsening from a net loss of $14.5 million, or $1.11 per diluted share, in the prior year. Adjusted EBITDA was a loss of $14.3 million, compared to a loss of $10.2 million in Q2 2024.
Despite these challenges, TBHC highlighted the successful opening of its first Bed Bath & Beyond Home store in Nashville and the sale of Kirkland’s Home intellectual property for $10 million. The company plans to open five more stores in the Nashville area and convert existing stores to Bed Bath & Beyond within 24 months. TBHC ended the quarter with $3.6 million in cash and a total debt of $55.2 million. No dividends were declared, and no new share repurchase activity was announced.
## Earnings Trend Table
No earnings data available.
As there is no earnings data available for the requested analysis, it is not possible to provide a detailed assessment of EPS trends over the last eight quarters. Without specific earnings per share (EPS) figures, any attempt to identify patterns, fluctuations, or insights into the company’s financial performance would be speculative and unfounded.
For a comprehensive analysis, access to the company’s quarterly earnings reports is essential. These reports would offer not only the EPS figures but also additional context such as revenue, expenses, and potentially influencing factors like market conditions or internal corporate changes.
To proceed effectively, I recommend obtaining the necessary earnings data either directly from the company’s financial disclosures or through reliable financial information services. Once the data is available, a detailed and accurate analysis of EPS trends can be conducted, providing valuable insights into the company’s financial health and operational efficiency.
## Dividend Payments Table
| Date | Dividend |
|---|---|
| 2015-06-03 | 1.5 |
The most recent rating changes for the company in question reflect a varied perspective from different financial firms over time, with significant implications for investor sentiment and stock price targets.
1. **Craig Hallum – March 10, 2022**: This firm downgraded the company from “Buy” to “Hold,” simultaneously slashing the price target from $30 to $15. This substantial reduction by 50% in the target price suggests a significant shift in the firm’s outlook on the company’s future performance or market conditions, potentially due to underwhelming financial results, market saturation, or competitive pressures.
2. **The Benchmark Company – October 15, 2021**: This firm initiated coverage with a “Buy” rating and set a price target of $30. The initiation at such a bullish target indicates a positive outlook on the company’s growth prospects or market position at that time, likely influenced by strong financial performance, innovative product launches, or favorable market dynamics.
3. **Craig Hallum – December 1, 2020**: Previously, Craig Hallum had initiated coverage of the company with a “Buy” rating and a price target of $25. This earlier positive stance suggests that at the end of 2020, the firm viewed the company as a strong investment with potential for significant value appreciation.
4. **B. Riley FBR – May 15, 2019**: This firm downgraded the company from “Buy” to “Neutral,” and reduced the target price from $12 to $6.50, a decrease of nearly 46%. This downgrade likely reflected emerging challenges or disappointing performance metrics that could have influenced the company’s perceived stability and growth trajectory.
Overall, these rating changes over the years indicate fluctuating confidence from analysts based on evolving business performance, market conditions, and possibly internal or external business challenges. The most recent downgrade by Craig Hallum particularly highlights potential concerns that may need to be addressed by the company to restore investor confidence.
The current price of the stock is $1.83, which is significantly below the historical target prices set by various analysts over the past few years. For instance, as recently as March 2022, Craig Hallum downgraded the stock from “Buy” to “Hold” and adjusted the target price from $30 to $15. Earlier, in October 2021, The Benchmark Company initiated coverage with a “Buy” rating and a target price of $30. In December 2020, Craig Hallum also rated it as a “Buy” with a target price of $25. Back in May 2019, B. Riley FBR downgraded the stock from “Buy” to “Neutral” and lowered the target price from $12 to $6.50.
This trend in target prices and ratings indicates a significant decline in analysts’ expectations and confidence over time, aligning with the current price well below earlier projections. The data does not include specific earnings per share (EPS) or dividend trends, which are also critical factors in evaluating the financial health and performance outlook of the company.
Disclaimer
The content on MarketsFN.com is provided for educational and informational purposes only. It does not constitute financial advice, investment recommendations, or trading guidance. All investments involve risks, and past performance does not guarantee future results. You are solely responsible for your investment decisions and should conduct independent research and consult a qualified financial advisor before acting. MarketsFN.com and its authors are not liable for any losses or damages arising from your use of this information


