# The Lovesac Company (LOVE) Post Earning Analysis
The Lovesac Co. is a technology-driven, omni-channel company founded in 1995 by Shawn David Nelson and headquartered in Stamford, CT. It specializes in designing, manufacturing, and selling innovative furniture, including modular couches known as sactionals and foam beanbag chairs called sacs, along with various accessories. Lovesac emphasizes adaptability and sustainability in its uniquely designed products.
Recent news regarding The Lovesac Company (NASDAQ: LOVE) has been centered around its Q2 2026 earnings, reflecting a period of both challenges and growth. On September 12, 2025, GuruFocus.com highlighted the company’s earnings call, which discussed navigating growth amidst various challenges. The same day, StockStory provided a deeper analysis of the Q2 results, pointing out persistent margin pressures despite efforts in brand refreshment and product expansion. Additionally, on September 14, StockStory reflected on the broader sector of home furnishings stocks’ Q2 earnings, including Lovesac, suggesting a sector-wide perspective on performance and challenges.
These reports suggest that Lovesac is experiencing growth but also facing significant operational challenges, particularly with margins. This combination of growth amidst financial pressures could have mixed implications for the stock. Investors might appreciate the company’s growth trajectory and strategic expansions but could be cautious about ongoing margin pressures affecting profitability.
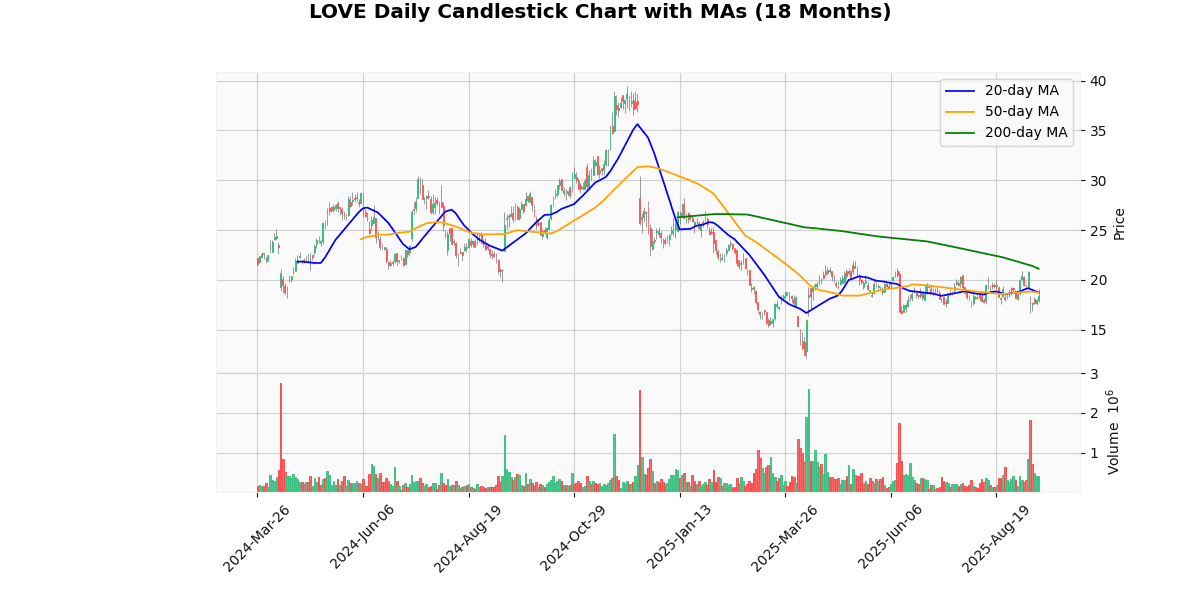
The current price of the asset is $18.385, experiencing a significant daily increase of 4.19%. This recent uptick contrasts with broader trends over various time frames. The asset is considerably below its 52-week high of $39.49 by -53.44% and its year-to-date high of $28.21 by -34.83%, indicating a substantial decline over the longer term. However, it has recovered 51.69% from both its 52-week and year-to-date lows of $12.12, suggesting some resilience or corrective movements after reaching these lows.
The asset’s performance relative to its moving averages further highlights its recent struggles; it is below the 20-day and 50-day moving averages by approximately -2% and significantly below the 200-day moving average by -12.93%. This indicates a bearish trend over the medium to long term.
Technical indicators such as the Relative Strength Index (RSI) at 47.84 and the Moving Average Convergence Divergence (MACD) at -0.15 suggest a neutral to slightly bearish momentum. The RSI being below 50 supports this view of lackluster momentum, while the negative MACD indicates bearish undercurrents.
Overall, despite today’s positive performance, the asset has been facing downward pressure over longer periods, with only modest signs of recovery from its lowest points. The technical indicators do not yet show strong signals for a reversal of the prevailing downtrend.
## Price Chart

## Earnings Trend Table
| Date | Estimate EPS | Reported EPS | Surprise % | |
|---|---|---|---|---|
| 0 | 2025-09-11 | -0.72 | -0.45 | -37.50 |
| 1 | 2025-06-12 | -0.79 | -0.73 | 7.98 |
| 2 | 2025-04-10 | 1.87 | 2.13 | 13.70 |
| 3 | 2024-12-12 | -0.35 | -0.32 | 8.13 |
| 4 | 2024-09-12 | -0.44 | -0.38 | 13.31 |
| 5 | 2024-06-13 | -0.96 | -0.83 | 13.54 |
| 6 | 2024-04-11 | 1.93 | 1.87 | -2.86 |
| 7 | 2023-12-06 | -0.30 | -0.15 | 50.00 |
The EPS trends over the last eight quarters show a pattern of variability in both positive and negative earnings, with notable surprises against estimates. The data indicates a cyclical pattern where the company reports positive earnings in the second quarter of each year (2025 and 2024), with EPS significantly above estimates in Q2 2025 (+13.70%) and slightly below in Q2 2024 (-2.86%). This suggests a seasonal impact on earnings, potentially due to increased sales or operational efficiencies during this period.
Conversely, the third and fourth quarters consistently show negative EPS, though the company has consistently outperformed the negative estimates, indicating better-than-expected management of losses. The most significant positive surprise came in Q4 2023, with a 50% better performance than expected, followed by strong showings in Q3 and Q4 of 2024, and Q3 of 2025.
Overall, while the company experiences losses in several quarters, the trend of outperforming pessimistic estimates suggests effective cost management or revenue generation that surpasses analyst expectations during these periods. This pattern of exceeding expectations, even in negative quarters, could be indicative of conservative forecasting or an ability to manage downturns effectively.


