Thor Industries, Inc., founded in 1980 and headquartered in Elkhart, Indiana, is a leading manufacturer of recreational vehicles (RVs). The company operates through three main segments: North American Towable RVs, North American Motorized RVs, and European RVs, featuring brands like Airstream, Jayco, and Keystone. Thor Industries caters to a diverse range of outdoor and travel enthusiasts with its extensive portfolio of RVs.
Recent news surrounding Thor Industries (THO) highlights a mixed financial landscape, with the company reporting a rise in profits despite a challenging macroeconomic environment. On September 24, 2025, Thor Industries announced its fiscal fourth-quarter earnings, surpassing both earnings and revenue estimates as reported by Zacks. This positive performance led to a significant increase in the company’s stock, as detailed by StockStory.
However, the company has also signaled caution for the future, citing ongoing macroeconomic challenges and concerns about the job market, which could potentially impact consumer spending on discretionary items such as RVs. Despite these warnings, the stock has seen an uptick, driven by the better-than-expected quarterly results.
Morningstar Research released an analyst report on Thor Industries, further influencing investor sentiment. The overall market context includes a focus on upcoming fiscal strategies and adjustments to consumer demand shifts, particularly in discretionary spending which is crucial for Thor Industries’ primary market.
The recent introduction of the world’s first range-extended electric Class A motorhome by Thor could also play a significant role in shaping the company’s future growth trajectory by potentially tapping into new customer segments and aligning with broader environmental trends.
Overall, while Thor Industries faces economic uncertainties, its recent financial performance and strategic product innovations provide a cautiously optimistic outlook for the stock.
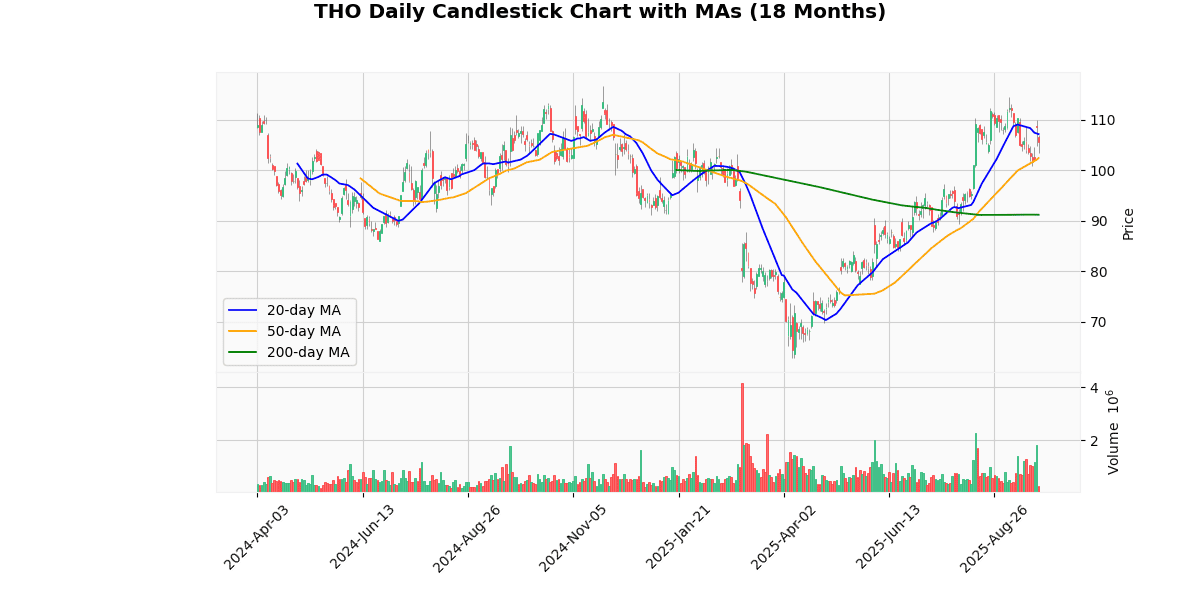
The current price of the asset is $105.58, reflecting a significant drop of 2.82% today. This price is positioned closer to the upper end of both its 52-week and year-to-date ranges, with respective lows at $62.8, indicating a substantial recovery from those lows (over 68% increase from both the 52-week and YTD lows). Despite today’s decline, the asset has gained 15.76% relative to the 200-day moving average, suggesting a strong longer-term upward trend.
Short-term trends show a slight underperformance relative to the 20-day moving average by 1.46%, but an outperformance against the 50-day moving average by 3.1%. This mixed short-term signal is corroborated by the RSI at 50.78, indicating neither overbought nor oversold conditions, and a MACD of 0.16, suggesting a minimal bullish momentum.
Overall, the asset shows robust long-term gains with recent short-term volatility. The proximity to recent highs and the positive performance relative to longer moving averages suggest underlying strength, although the recent price drop and mixed short-term indicators call for cautious optimism.
## Price Chart

THOR Industries, Inc. (NYSE: THO) reported its fiscal Q4 2025 results, highlighting a slight decline in net sales year-over-year from $2,534,167 to $2,523,783, a decrease of 0.4%. Despite the marginal drop in sales, net income for the quarter significantly improved by 39.7%, rising from $90,015 to $125,757. Diluted earnings per share also saw a substantial increase, up 40.5% to $2.36 from $1.68 in Q4 2024.
For the fiscal year, THOR’s net sales decreased by 4.6% to $9,579,490 from $10,043,408. The annual figures also reflected a decrease in gross profit by 7.7% and a slight dip in net income by 2.5%. However, cash flows from operations for the year showed a positive movement, increasing by 5.9%.
The company’s EBITDA for the quarter grew by 2.6%, although the adjusted EBITDA saw a reduction of 4.1%. Annually, EBITDA and adjusted EBITDA decreased by 13.8% and 9.7%, respectively. Segment-wise, North American Towable RVs experienced a sales decrease of 4.6%, while Motorized RVs saw an increase of 7.8%. European RVs sales dropped by 2.2%.
Looking ahead, THOR Industries expressed cautious optimism for fiscal 2026, citing potential market dynamics and strategic initiatives aimed at leveraging market opportunities.
## Earnings Trend Table
| Date | Estimate EPS | Reported EPS | Surprise % | |
|---|---|---|---|---|
| 0 | 2025-09-24 | 1.16 | 2.31 | 99.14 |
| 1 | 2025-06-04 | 1.78 | 2.53 | 42.45 |
| 2 | 2025-03-05 | 0.07 | -0.01 | -114.63 |
| 3 | 2024-12-04 | 0.71 | -0.03 | -104.25 |
| 4 | 2024-09-24 | 1.30 | 1.68 | 29.22 |
| 5 | 2024-06-05 | 1.86 | 2.13 | 14.79 |
| 6 | 2024-03-06 | 0.67 | 0.35 | -47.89 |
| 7 | 2023-12-06 | 0.98 | 0.99 | 1.49 |
Over the past eight quarters, the trend in earnings per share (EPS) presents a varied landscape with significant fluctuations in both reported EPS and surprise percentages. Notably, the company has exceeded EPS estimates in five out of eight quarters, with particularly strong performances in the most recent quarter of September 2025, showing a nearly double EPS of 2.31 against an estimate of 1.16, resulting in a 99.14% surprise. This trend of positive surprises also includes substantial overperformance in June 2025 with a 42.45% surprise.
However, the company faced notable challenges in two quarters, specifically March and December of 2024, where it reported negative EPS figures compared to positive estimates, resulting in significant negative surprises of -114.63% and -104.25%, respectively. These instances indicate periods of unexpected financial downturns.
The data from earlier quarters in 2024 and 2023 shows a general consistency in beating EPS estimates, though the margins of surprise vary. The most stable quarter was December 2023, with a slight positive surprise of 1.49%.
Overall, the EPS trends reveal a pattern of generally positive surprises with occasional, yet significant, downturns. This suggests a volatility in earnings that could be attributed to external market conditions or internal operational impacts. Investors might view the high variance in surprise percentages as a potential risk factor.
## Dividend Payments Table
| Date | Dividend |
|---|---|
| 2025-07-01 | 0.5 |
| 2025-04-08 | 0.5 |
| 2025-01-06 | 0.5 |
| 2024-11-01 | 0.5 |
| 2024-07-03 | 0.48 |
| 2024-04-08 | 0.48 |
| 2023-12-27 | 0.48 |
| 2023-10-31 | 0.48 |
The review of the dividend data over the last eight samples reveals a stable trend with a recent increase. From October 2023 to April 2024, dividends were consistently distributed at $0.48. This period of stability suggests that the company maintained a steady financial performance and opted to sustain its dividend payouts at this level.
However, beginning in July 2024, there was a slight increase in the dividend to $0.50, which has been maintained through to the latest data point in July 2025. This increment, although modest, indicates a possible improvement in the company’s profitability or a strategic decision to return more capital to shareholders. The consistency in the dividend amount post-increase, across four consecutive distributions, reflects a continued commitment to this new dividend level, likely signaling confidence in the company’s ongoing financial health and outlook.
Overall, the trend suggests a cautious yet positive approach in managing shareholder returns, aligning with potential shifts in the company’s operational performance or capital strategy.
The following analysis provides detailed insights into the four most recent rating changes for an unspecified company, reflecting shifts in financial analysts’ perspectives and market expectations.
1. **KeyBanc Capital Markets – Upgrade (2025-08-01)**: On August 1, 2025, KeyBanc Capital Markets upgraded their rating from Underweight to Sector Weight. This change indicates a shift to a neutral stance, suggesting that the firm’s expectations of the company’s performance have aligned more closely with the overall sector average. No specific target price was provided, emphasizing a general adjustment in the investment outlook rather than a precise valuation change.
2. **Robert W. Baird – Downgrade (2025-04-04)**: Robert W. Baird downgraded their rating on April 4, 2025, from Outperform to Neutral, setting a target price of $85. This adjustment suggests a significant recalibration of expectations, possibly due to emerging challenges or underperformance relative to sector peers. The new target price implies a more conservative view of the company’s future stock performance.
3. **KeyBanc Capital Markets – Downgrade (2025-03-20)**: Shortly before their August upgrade, KeyBanc Capital Markets downgraded the company on March 20, 2025, from Sector Weight to Underweight with a target price of $65. This earlier assessment pointed to a bearish outlook, indicating concerns over the company’s potential to underperform the sector, which might have been driven by specific financial, operational, or market challenges.
4. **Citigroup – Downgrade (2025-03-19)**: On March 19, 2025, Citigroup downgraded their rating from Buy to Neutral, adjusting the target price from $94 to $86. This revision reflects a tempered enthusiasm about the company’s growth prospects or profitability, aligning the investment bank’s view more closely with a neutral market consensus and reducing the expected stock price return.
These changes reflect a dynamic assessment of the company’s position and potential within its industry, influenced by varying factors including financial performance, market conditions, and possibly sector-specific developments.
The current price of the stock is $105.58, which notably surpasses the latest target prices suggested by analysts. Recent evaluations from KeyBanc Capital Markets, Robert W. Baird, and Citigroup illustrate a trend of downgrades, with target prices set significantly lower at $65, $85, and adjusted from $94 to $86, respectively. This disparity suggests that the stock might be overvalued according to the latest analyst insights, or that market conditions or company performance have evolved beyond analysts’ recent expectations.
The recent ratings include a downgrade by Robert W. Baird from “Outperform” to “Neutral” with a target price of $85, and a more severe downgrade by KeyBanc Capital Markets from “Sector Weight” to “Underweight,” setting the lowest target at $65. Citigroup also adjusted their stance from “Buy” to “Neutral,” decreasing their target price from $94 to $86. These adjustments reflect a cautious or bearish outlook from analysts based on the stock’s performance or market conditions.
Disclaimer: The information provided here is for educational and informational purposes only and should not be interpreted as financial advice, investment recommendations, or trading guidance. Markets involve risk, and past performance is not indicative of future results. You should always conduct your own research and consult with a qualified financial advisor before making any investment decisions. By acting, you accept full responsibility for your choices.


