Top 10 Performers
Labcorp Holdings Inc (LH) (2.43%)
Technical Analysis
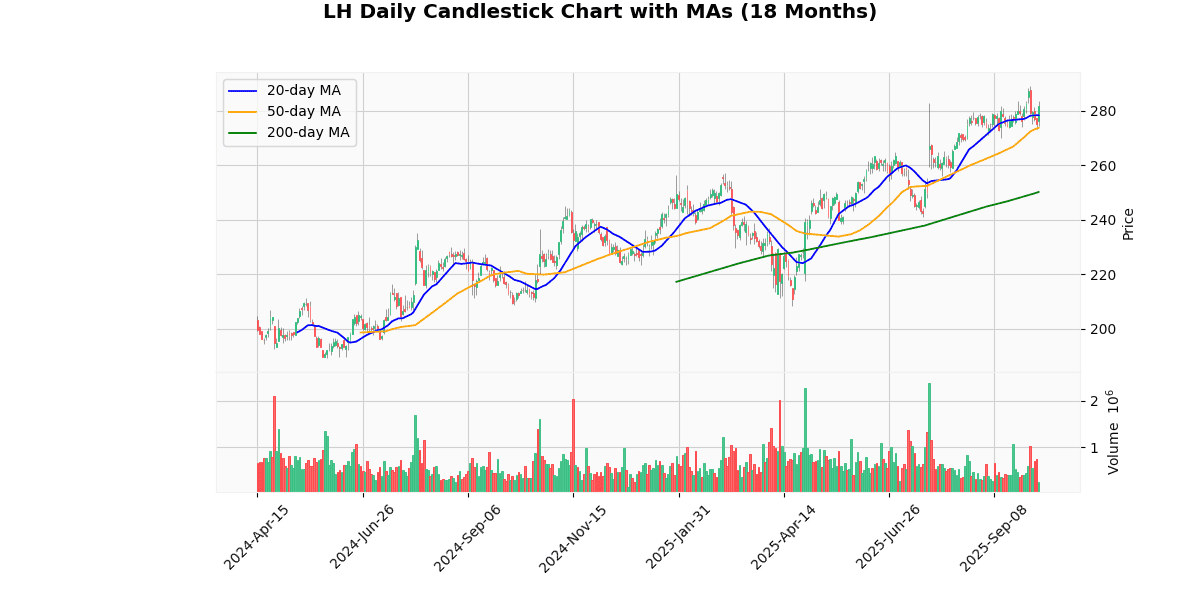
The current price of the asset at $282.14 indicates a bullish trend, as it is positioned above all key moving averages: 20-day MA at $278.4, 50-day MA at $273.76, and significantly above the 200-day MA at $250.2. This alignment suggests a strong upward momentum in the short to medium term, with the price consistently outperforming its historical averages. The fact that the current price surpasses the 20-day and 50-day MAs indicates recent gains are robust and not just a short-term spike. The substantial gap above the 200-day MA further underscores a long-term bullish sentiment in the market, indicating that investors have been increasingly optimistic over a longer horizon. Overall, the asset appears well-positioned for continued growth, barring any significant market disruptions.
Recent Ratings
| Date | Status | Outer | Rating | Price |
|---|---|---|---|---|
| 2025-07-10 00:00:00 | Downgrade | HSBC Securities | Buy → Hold | $260 |
| 2025-04-02 00:00:00 | Initiated | Redburn Atlantic | Buy | $276 |
| 2025-03-04 00:00:00 | Upgrade | Citigroup | Neutral → Buy | $250 → $300 |
| 2025-01-07 00:00:00 | Upgrade | Evercore ISI | In-line → Outperform | $260 → $265 |
Deere & Co (DE) (1.43%)
Technical Analysis
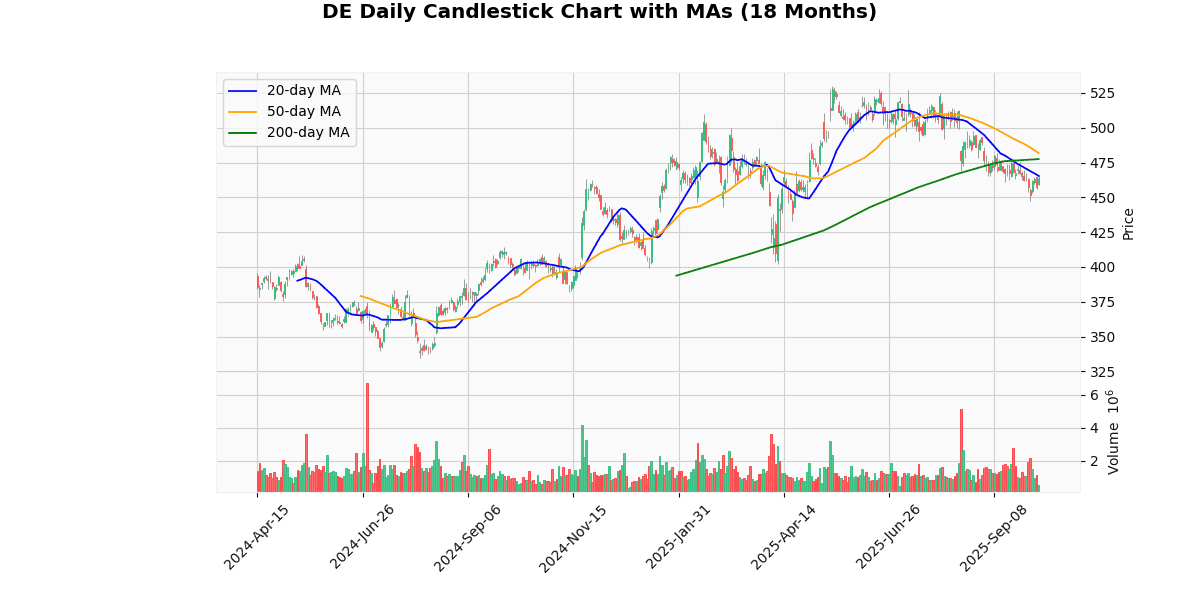
The current price of the asset at $463.84 reflects a slight downtrend when positioned against its moving averages. Specifically, it is trading below the 20-day moving average (MA20) of $465.44 and significantly below the 50-day (MA50) and 200-day (MA200) moving averages, which are $481.78 and $477.47, respectively. This positioning indicates a bearish sentiment in the short-term, as the price is not only below the MA20 but also the longer-term MAs. The fact that the MA50 and MA200 are above the current price, with the MA50 notably higher than the MA200, suggests that there has been a medium to long-term downward trend. Investors might view this as a potential bearish signal, warranting caution for those considering long positions, while potentially offering opportunities for short sellers or those looking for entry points in anticipation of a market correction or rebound.
Recent Ratings
| Date | Status | Outer | Rating | Price |
|---|---|---|---|---|
| 2025-06-06 00:00:00 | Upgrade | Melius | Hold → Buy | |
| 2025-03-03 00:00:00 | Downgrade | Robert W. Baird | Outperform → Neutral | $501 |
| 2024-12-06 00:00:00 | Downgrade | Jefferies | Buy → Hold | $510 |
| 2024-11-22 00:00:00 | Reiterated | Oppenheimer | Outperform | $448 → $477 |
Abbvie Inc (ABBV) (1.39%)
Recent News (Last 24 Hours)
In a recent article published by Motley Fool on October 7, 2025, titled “3 Dividend Stocks to Double Up On Right Now,” specific dividend stocks are highlighted as prime candidates for investors looking to potentially double their investment. While the specific stocks were not detailed in the summary provided, the endorsement by a reputable financial news source like Motley Fool generally suggests a positive outlook on these stocks, indicating strong fundamentals or potential for growth and stability.
For investors and stakeholders, such news could lead to increased interest and investment in these highlighted stocks, potentially driving up their market prices due to heightened demand. Additionally, for the companies involved, this kind of positive exposure can enhance stock attractiveness to dividend-focused investors, possibly leading to increased market capitalization and improved liquidity. This scenario could also foster a more favorable environment for these companies to raise capital if needed, by issuing new shares under more advantageous conditions.
Technical Analysis
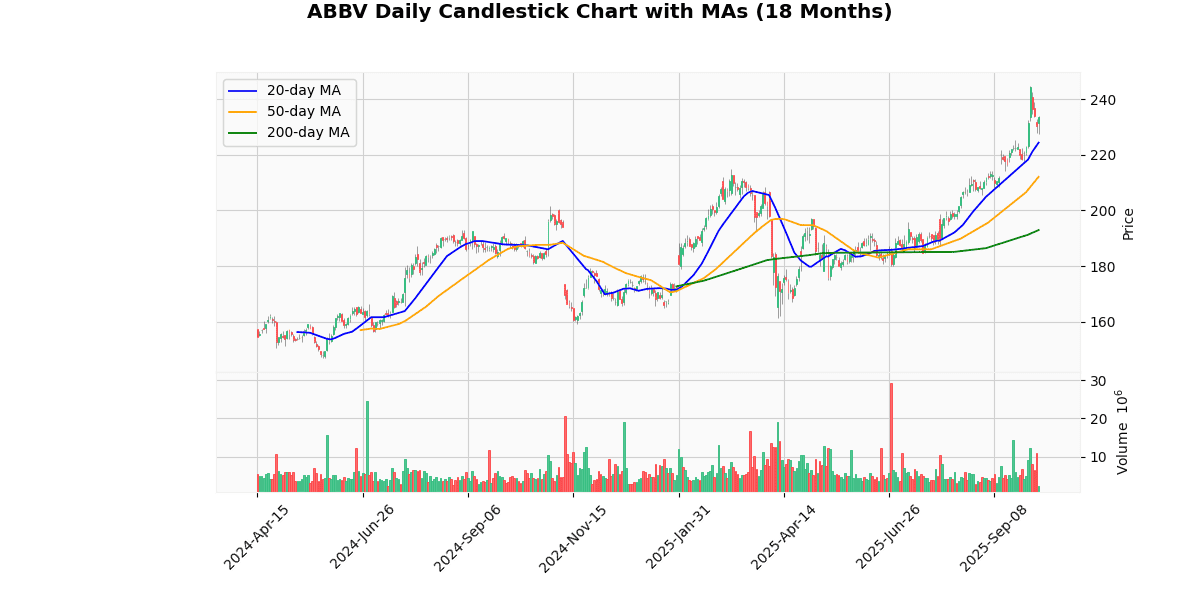
The current price of the asset at $233.58 reflects a robust upward trend when analyzed against its moving averages (MAs). The 20-day MA at $224.35, 50-day MA at $212.09, and 200-day MA at $192.98 all indicate a consistent bullish momentum over short, medium, and long-term periods. The price standing above all three MAs suggests strong buying interest and positive investor sentiment. The significant gap between the current price and the 200-day MA highlights a potential overextension in the market, which could signal caution among traders wary of a pullback. However, the steady ascent through the shorter-term MAs could also indicate that the market has room to sustain its upward trajectory. Investors should monitor for any signs of reversal but might remain optimistic about continued growth based on current trends.
Recent Ratings
| Date | Status | Outer | Rating | Price |
|---|---|---|---|---|
| 2025-10-01 00:00:00 | Downgrade | HSBC Securities | Buy → Hold | |
| 2025-09-17 00:00:00 | Upgrade | Berenberg | Hold → Buy | $270 |
| 2025-08-12 00:00:00 | Resumed | Piper Sandler | Overweight | $231 |
| 2025-08-07 00:00:00 | Upgrade | Daiwa Securities | Neutral → Outperform | $214 |
GE Aerospace (GE) (1.22%)
Recent News (Last 24 Hours)
As of the latest update, there have been no significant news items reported in the past 24 hours that could directly impact the stock market. The absence of fresh news suggests a potentially stable market environment in the short term, barring any unforeseen developments. Investors and analysts typically monitor such periods of low news flow for any subtle shifts in market sentiment or trading patterns that might suggest underlying trends or forthcoming volatility. In the absence of new data or events, market participants might focus more on broader economic indicators or geopolitical events to guide their investment decisions. It is also a period where technical analysis might gain more prominence among traders, as they look for patterns or signals within the market’s own movements. Overall, the lack of immediate news could lead to cautious trading as market participants await more substantial information to drive their investment strategies.
Technical Analysis
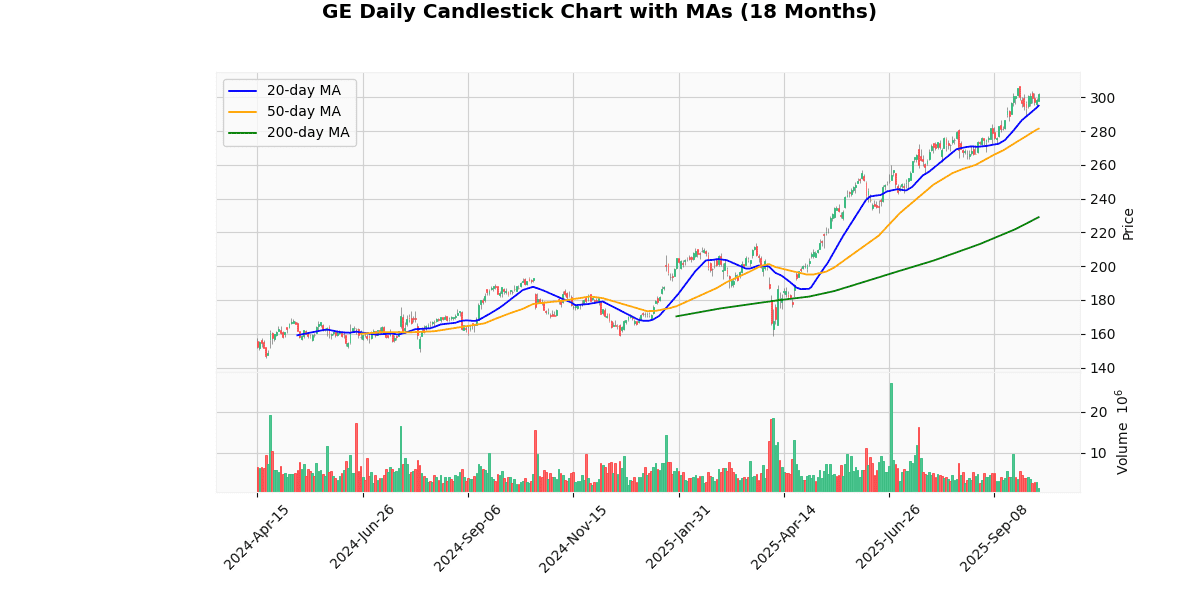
The current price of the asset at $302.18 is exhibiting a bullish trend when analyzed against its moving averages (MAs). It is trading above the 20-day moving average (MA20) of $295.04, the 50-day moving average (MA50) of $281.41, and significantly above the 200-day moving average (MA200) of $228.99. This positioning indicates a strong upward momentum in the short-term, as well as a solid medium to long-term uptrend. The consistent increase in moving averages from MA200 through to MA20 suggests that the asset has been gaining value steadily over time, with recent prices accelerating faster than the longer-term trend. This could attract more bullish sentiment in the market, potentially leading to further price increases if the trend continues. Investors should monitor for any signs of reversal, but current indicators favor a continued positive trajectory.
Recent Ratings
| Date | Status | Outer | Rating | Price |
|---|---|---|---|---|
| 2025-05-19 00:00:00 | Downgrade | Northcoast | Buy → Neutral | |
| 2025-04-09 00:00:00 | Upgrade | Northcoast | Neutral → Buy | $205 |
| 2025-02-18 00:00:00 | Initiated | Redburn Atlantic | Buy | $250 |
| 2025-01-07 00:00:00 | Initiated | Northcoast | Neutral |
Progressive Corp (PGR) (1.20%)
Recent News (Last 24 Hours)
In recent financial news, Zacks highlighted the potential benefits of investing in two specific finance stocks, suggesting that current market conditions present a valuable opportunity for investors. This recommendation could lead to increased investor interest and potentially boost the stock prices of the companies involved. The focus on these finance stocks, particularly at a time when market dynamics might be favorable, suggests a strategic entry point that could yield significant returns.
Additionally, a report from Fortune noted an interesting trend where companies experiencing the most success with artificial intelligence (AI) have women CEOs. This observation could influence investor perceptions, potentially increasing the attractiveness of stocks from companies with female leadership, especially in the tech and AI sectors. The implication that gender diversity in leadership roles might correlate with advanced innovation and success in AI could encourage a broader reassessment of company valuations where such leadership dynamics are present. This trend is particularly relevant as AI continues to be a critical driver of technological advancement and business efficiency.
Technical Analysis
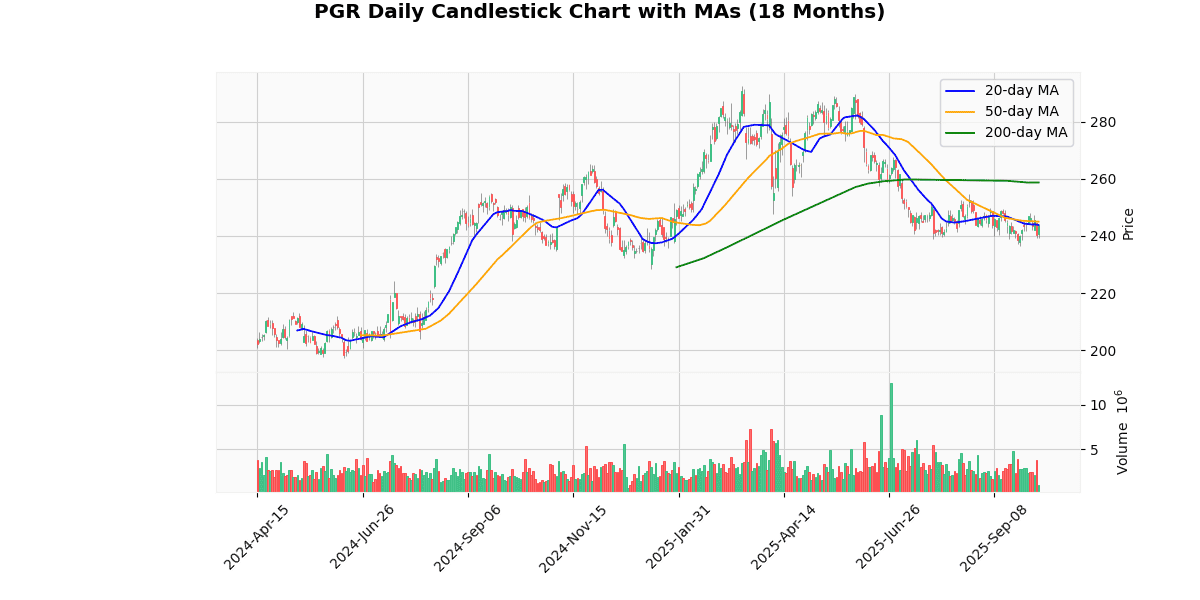
The current price of the asset is $243.35, which shows a slight deviation below the 20-day moving average (MA20) of $243.84 and further below the 50-day moving average (MA50) of $245.01. This positioning indicates a short-term bearish sentiment as the price is trending downwards in comparison to recent weeks. The more significant deviation from the 200-day moving average (MA200) at $258.74 underscores a longer-term downward trend, suggesting that the asset has been losing ground over a more extended period. This alignment of the current price below all three key moving averages may signal to investors a bearish market outlook, potentially influencing strategies towards more cautious or defensive investment positions unless other market factors suggest a reversal or stabilization in the near term.
Recent Ratings
| Date | Status | Outer | Rating | Price |
|---|---|---|---|---|
| 2025-09-18 00:00:00 | Downgrade | Wells Fargo | Overweight → Equal Weight | $265 |
| 2025-09-17 00:00:00 | Downgrade | BMO Capital Markets | Outperform → Market Perform | $250 |
| 2025-09-16 00:00:00 | Initiated | Wolfe Research | Peer Perform | |
| 2025-08-13 00:00:00 | Initiated | Citigroup | Buy | $312 |
PepsiCo Inc (PEP) (1.08%)
Recent News (Last 24 Hours)
Recent news surrounding PepsiCo highlights investor anticipation and strategic evaluations ahead of the company’s upcoming earnings report. Analysts from Zacks and Motley Fool are focusing on PepsiCo’s ability to sustain its earnings momentum amid a broader macroeconomic slowdown. Speculation from Zacks suggests that PepsiCo’s diversified business model may provide a buffer against potential downturns, which could be crucial for maintaining stable earnings. Furthermore, Motley Fool has identified PepsiCo as a potential candidate for investors seeking reliable dividend income, indicating confidence in the company’s long-term payout stability.
Investor sentiment may be positively influenced by these analyses, as they underscore the resilience and strategic positioning of PepsiCo in the volatile consumer staples sector. The emphasis on PepsiCo’s potential to leverage market trends to facilitate a turnaround could drive investor interest, particularly among those looking for defensive investment opportunities in uncertain economic times. As the earnings date approaches, these factors could contribute to fluctuations in PepsiCo’s stock price, reflecting the market’s reaction to both speculative insights and actual financial performance.
Technical Analysis
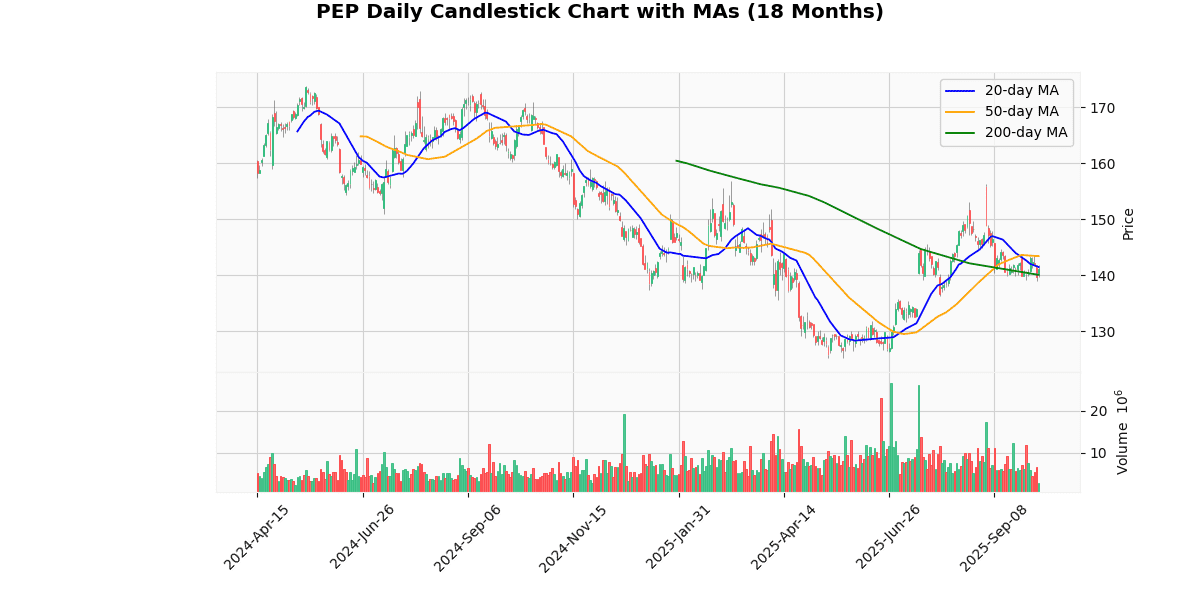
The current price of the asset at $141.09 is positioned slightly below the 20-day moving average (MA20) of $141.45, indicating a potential short-term bearish sentiment. However, it is important to note that the price is above the 200-day moving average (MA200) of $140.06, suggesting a longer-term bullish trend. The divergence between the price and the 50-day moving average (MA50) at $143.41 further underscores some recent underperformance relative to the medium-term trend. This positioning between the MA20 and MA200 suggests a consolidation phase might be occurring, with the asset showing resilience above the significant 200-day benchmark but struggling to regain momentum to breach the nearer-term 50-day average. Investors should monitor if the price can sustain above the MA200 to confirm continued long-term bullishness or if a breakdown below this level signals a trend reversal.
Recent Ratings
| Date | Status | Outer | Rating | Price |
|---|---|---|---|---|
| 2025-04-15 00:00:00 | Downgrade | BofA Securities | Buy → Neutral | $155 |
| 2025-03-18 00:00:00 | Downgrade | Barclays | Overweight → Equal Weight | $168 → $156 |
| 2025-03-12 00:00:00 | Downgrade | Jefferies | Buy → Hold | $171 → $170 |
| 2025-01-07 00:00:00 | Initiated | Piper Sandler | Overweight | $171 |
Travelers Companies Inc (TRV) (0.97%)
Technical Analysis
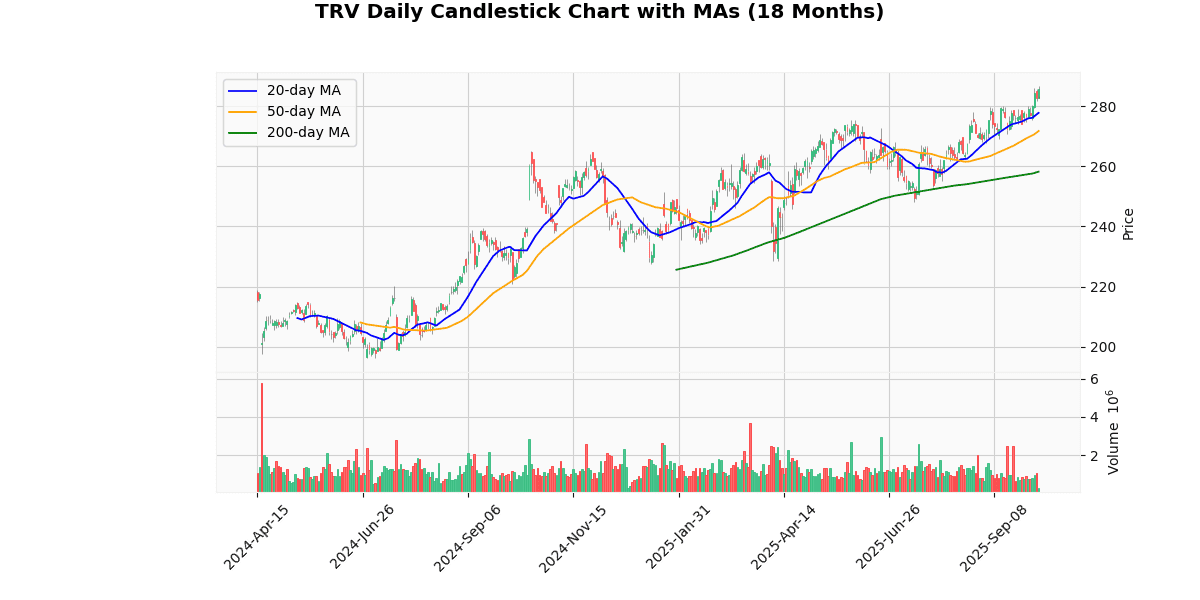
The current price of the asset at $285.7 indicates a bullish trend, as it is positioned above all key moving averages: 20-day MA at $277.79, 50-day MA at $271.75, and 200-day MA at $258.22. This alignment suggests a consistent upward trajectory over short, medium, and long-term periods. The price being above the 20-day MA indicates short-term bullish momentum, while its position over the 50-day and 200-day MAs reinforces strength in the medium and longer-term market sentiment respectively. The increasing gap between these MAs and the current price may also imply growing investor confidence and potential resistance to downward price pressures. Investors might view these indicators as a robust sign of ongoing positive momentum, potentially leading to increased buying activity in anticipation of continued upward movement.
Recent Ratings
| Date | Status | Outer | Rating | Price |
|---|---|---|---|---|
| 2025-09-16 00:00:00 | Initiated | Wolfe Research | Peer Perform | |
| 2025-08-13 00:00:00 | Initiated | Citigroup | Neutral | $291 |
| 2025-08-13 00:00:00 | Initiated | Cantor Fitzgerald | Overweight | $308 |
| 2025-07-07 00:00:00 | Downgrade | Barclays | Overweight → Equal Weight | $274 |
Fox Corporation (FOX) (0.89%)
Technical Analysis
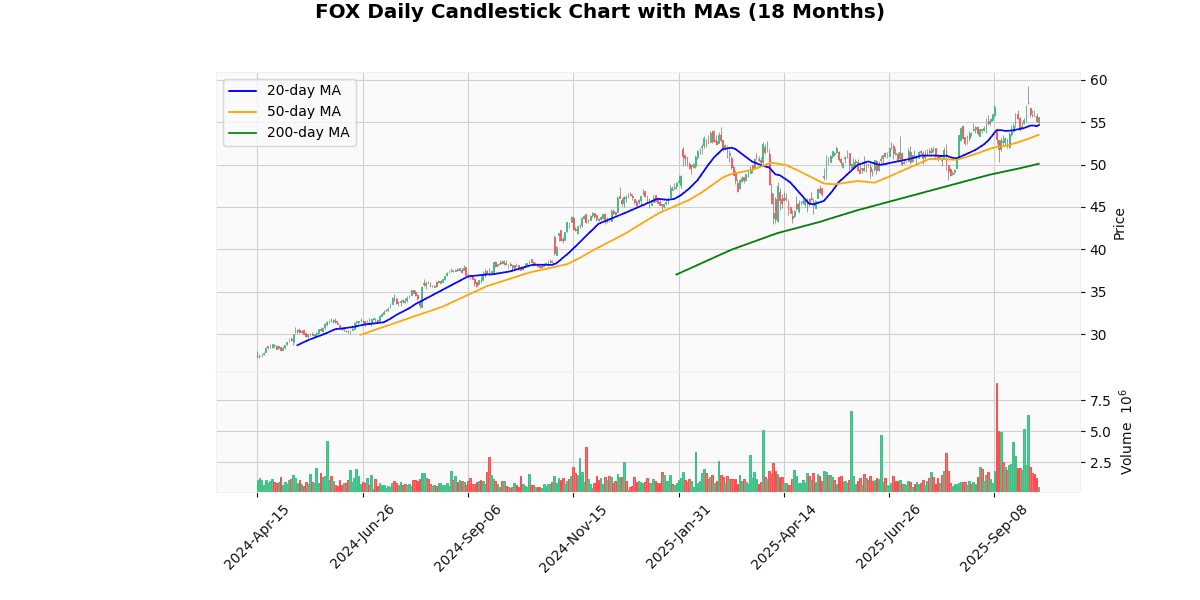
The current price of the asset at $55.58 indicates a bullish trend, as it is positioned above all key moving averages: the 20-day ($54.63), 50-day ($53.49), and 200-day ($50.08). This positioning suggests a consistent upward trajectory over both short and long-term periods. The price standing above the 20-day moving average highlights recent positive momentum, while its placement above the 50-day and 200-day averages further underscores a solid bullish stance over a more extended period. The increasing gap between these moving averages and the current price could indicate strengthening buyer confidence and potential resistance to downward price pressures. Investors might view these indicators as a robust signal for continued upward movement, considering the asset’s performance well above its longer-term trend lines.
Broadridge Financial Solutions Inc (BR) (0.77%)
Technical Analysis
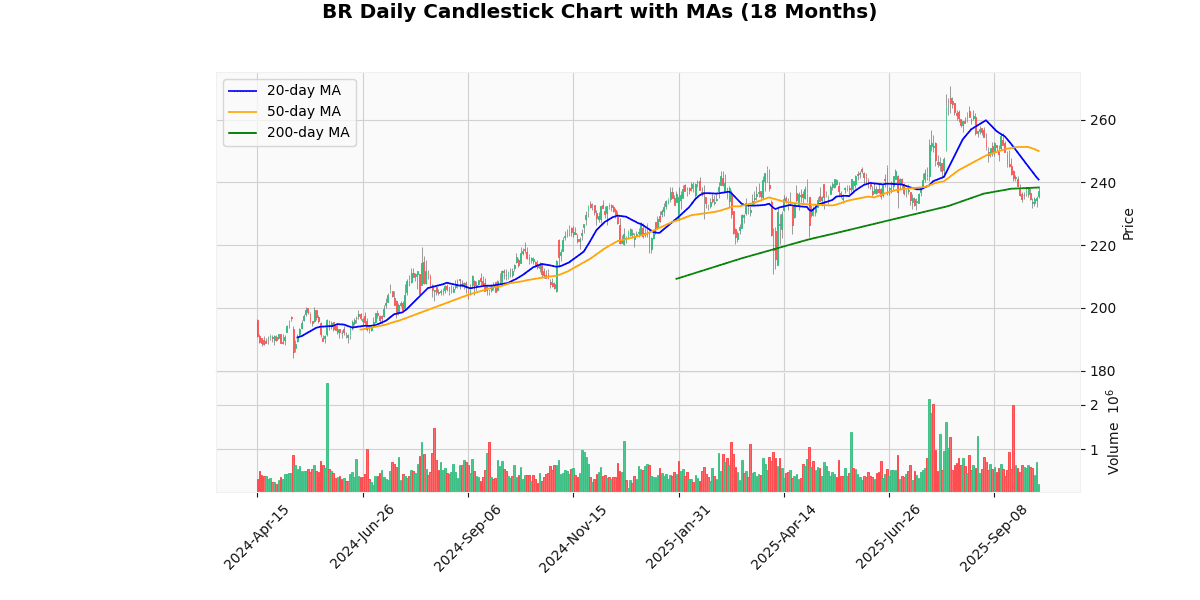
The current price of the asset at $237.16 reflects a bearish trend when analyzed against its moving averages (MAs). It is trading below the 20-day MA of $240.95 and the 50-day MA of $249.99, indicating a short to medium-term downward momentum. Moreover, the price is slightly below the 200-day MA of $238.39, suggesting that the long-term trend could also be turning bearish. This positioning below all key MAs typically signals to investors a potential consolidation or further decline phase in the market. Traders might consider this an opportune moment to evaluate defensive strategies, while potential buyers could look for signs of stabilization before entering the market. Overall, the asset appears to be in a weak position, warranting caution among investors.
Recent Ratings
| Date | Status | Outer | Rating | Price |
|---|---|---|---|---|
| 2025-05-06 00:00:00 | Initiated | Needham | Buy | $300 |
| 2024-12-12 00:00:00 | Resumed | Wolfe Research | Peer Perform | |
| 2024-11-21 00:00:00 | Initiated | UBS | Neutral | $250 |
| 2023-10-17 00:00:00 | Upgrade | Wolfe Research | Underperform → Peer Perform |
Northrop Grumman Corp (NOC) (0.73%)
Technical Analysis
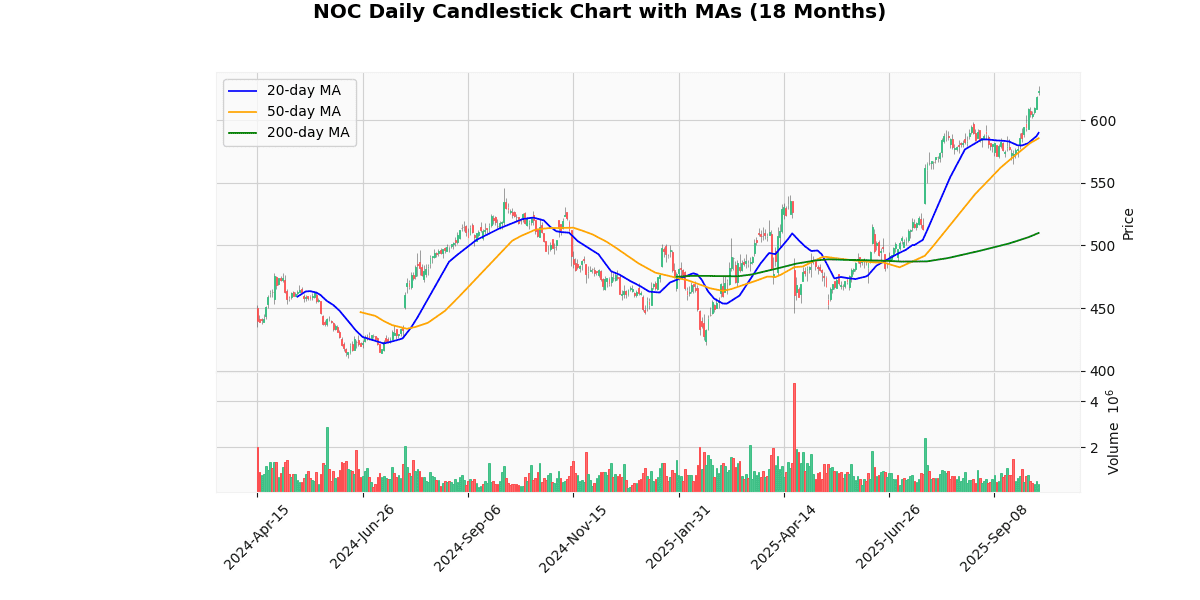
The current price of the asset at $621.88 indicates a robust upward trend when analyzed against its moving averages (MAs). The 20-day MA at $590.00 and the 50-day MA at $585.69 both sit significantly below the current price, suggesting a strong short-term bullish momentum. The considerable gap between the current price and these MAs highlights investor confidence in the near-term prospects of the asset. Furthermore, the 200-day MA at $509.99, substantially lower than the current price, confirms a long-term bullish trend. This positioning above all key MAs indicates that the asset has sustained positive sentiment over an extended period, potentially attracting more buyers. Investors should monitor for any reversion towards these averages as a natural market correction or continued upward movement to gauge further entry or exit points.
Recent Ratings
| Date | Status | Outer | Rating | Price |
|---|---|---|---|---|
| 2025-07-08 00:00:00 | Downgrade | Deutsche Bank | Buy → Hold | $542 |
| 2025-04-11 00:00:00 | Upgrade | Goldman | Sell → Neutral | $521 |
| 2025-03-27 00:00:00 | Upgrade | RBC Capital Mkts | Sector Perform → Outperform | $500 → $575 |
| 2025-02-03 00:00:00 | Upgrade | Wolfe Research | Underperform → Peer Perform |
Worst 10 Performers
KLA Corp (KLAC) (-4.02%)
Recent News (Last 24 Hours)
In recent analyses, the performance and strategic positioning of semiconductor equipment manufacturers have been scrutinized, with particular focus on KLA Corporation (NASDAQ: KLAC) and Applied Materials (AMAT). Zacks Investment Research’s latest article, “AMAT vs. KLAC: Which Stock Has an Edge in Semiconductor Equipment Space?” published on October 7, 2025, delves into the competitive dynamics between the two companies, evaluating their market performance, technological advancements, and strategic initiatives. This comparison is crucial as it provides investors with insights into which stock might offer superior returns based on current industry trends and company-specific factors.
Additionally, a retrospective review by StockStory, titled “A Look Back at Semiconductor Manufacturing Stocks’ Q2 Earnings: KLA Corporation (NASDAQ:KLAC) Vs The Rest Of The Pack,” dated October 6, 2025, examines the Q2 earnings outcomes for KLA and its peers. This analysis highlights how KLA’s financial performance measures up against competitors, providing a benchmark for assessing the company’s operational efficiency and market position.
These reports are pivotal for investors considering stakes in semiconductor equipment stocks, as they offer a detailed comparison and financial health check that could influence investment decisions, potentially impacting KLAC’s stock trajectory and market valuation.
Technical Analysis
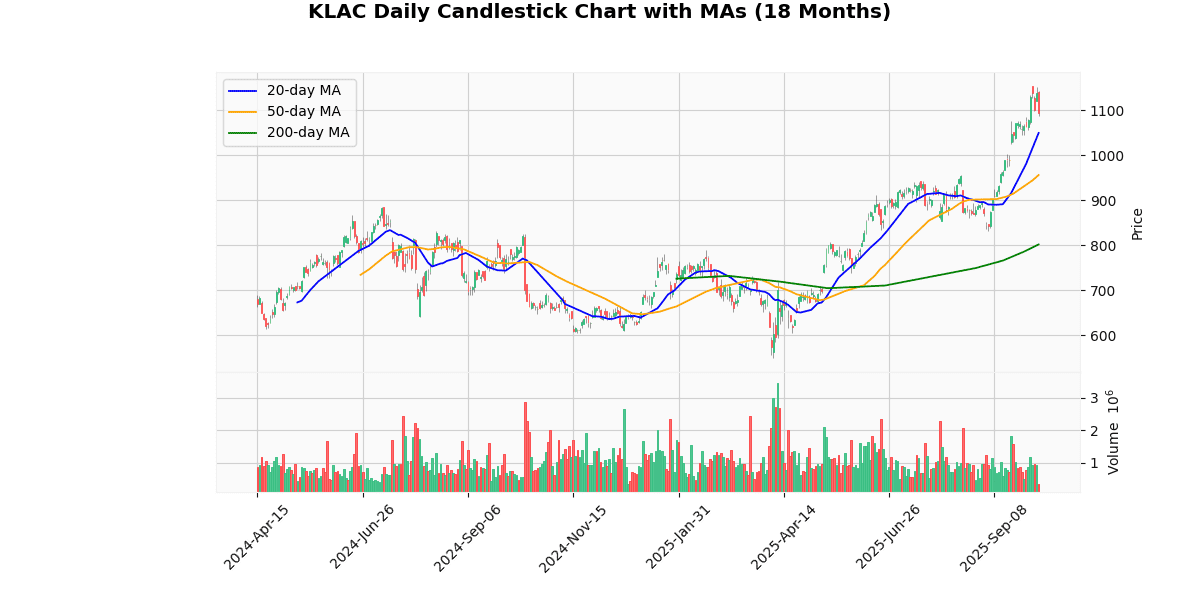
The current price of the asset at $1093.01 indicates a robust upward trend when analyzed against its moving averages (MAs). It is trading well above the 20-day MA of $1049.82, the 50-day MA of $956.27, and significantly higher than the 200-day MA of $801.99. This pattern suggests a strong bullish momentum in the short, medium, and long term. The consistent increase in MAs and the current price’s position above all three averages highlight sustained buying interest and positive investor sentiment. The substantial gap between the current price and the 200-day MA also underscores a potential overextension in the market, which could hint at overheating or a forthcoming price correction. However, as of now, the market positioning remains decidedly optimistic, suggesting continued upward movement unless external market dynamics shift markedly.
Recent Ratings
| Date | Status | Outer | Rating | Price |
|---|---|---|---|---|
| 2025-09-22 00:00:00 | Downgrade | Morgan Stanley | Overweight → Equal-Weight | $1093 |
| 2025-08-01 00:00:00 | Reiterated | TD Cowen | Hold | $800 → $900 |
| 2025-07-10 00:00:00 | Initiated | Goldman | Neutral | $980 |
| 2025-07-08 00:00:00 | Downgrade | Wells Fargo | Overweight → Equal Weight | $920 |
Booking Holdings Inc (BKNG) (-3.23%)
Technical Analysis
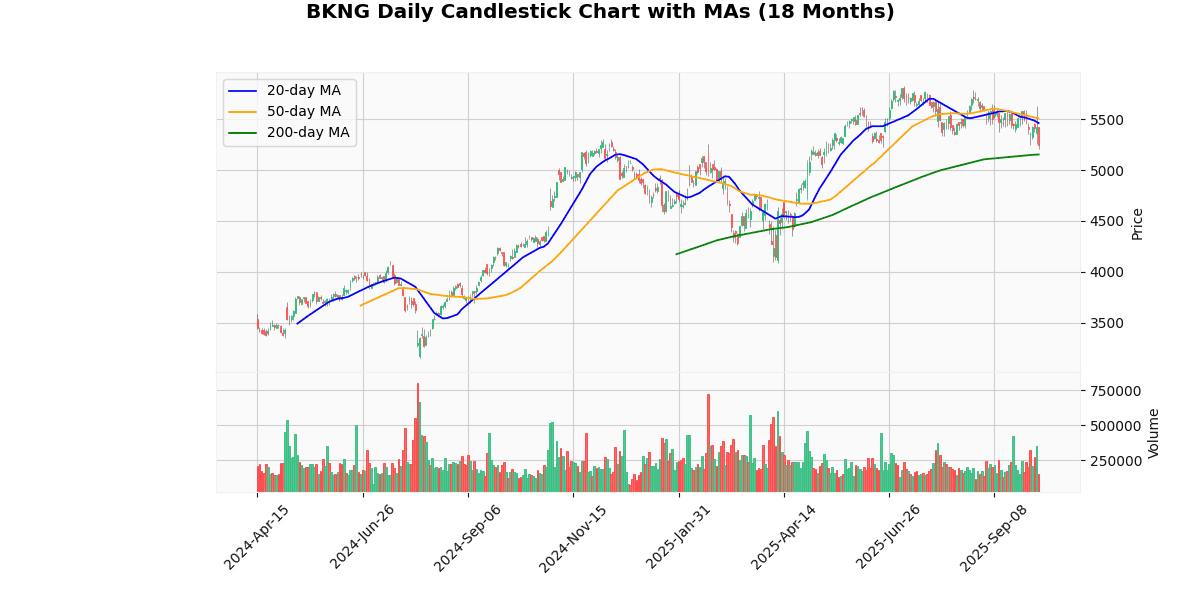
The current price of 5244.6 reflects a bearish trend in the short term, as it is positioned below both the 20-day moving average (MA20) of 5461.71 and the 50-day moving average (MA50) of 5507.54. This indicates that prices have been declining over recent weeks, suggesting a potential downward momentum or correction phase. However, the price remains above the 200-day moving average (MA200) of 5152.84, which could signify that the longer-term trend is still bullish. This juxtaposition between the short-term and long-term trends suggests a market at a potential inflection point. Investors might view the current levels as a buying opportunity if they believe the longer-term bullish trend will resume. Conversely, if the price fails to hold above the MA200, further declines could be anticipated, reinforcing a more cautious approach.
Recent Ratings
| Date | Status | Outer | Rating | Price |
|---|---|---|---|---|
| 2025-09-30 00:00:00 | Initiated | Mizuho | Neutral | $5975 |
| 2025-08-05 00:00:00 | Upgrade | Erste Group | Hold → Buy | |
| 2025-07-30 00:00:00 | Downgrade | Wedbush | Outperform → Neutral | $5900 |
| 2025-04-04 00:00:00 | Upgrade | BTIG Research | Neutral → Buy | $5500 |
Workday Inc (WDAY) (-2.88%)
Recent News (Last 24 Hours)
In a recent trading session, stocks of Workday, BILL, Workiva, Zscaler, and Snowflake experienced a downturn, as reported by StockStory on October 7, 2025. This decline in stock prices could be indicative of broader sectoral shifts or reactions to specific industry or company news. Investors should consider the potential impacts of this downturn on their portfolios, particularly if they are heavily invested in the technology and software sectors, which these companies represent.
The decrease in stock values may influence investor sentiment and could lead to a reevaluation of asset allocations. Additionally, this trend may affect market perceptions of the growth potential and stability of these companies. Investors are advised to stay informed about further developments related to these companies and to assess the broader market conditions that may be influencing these movements. This information is crucial for making informed decisions regarding buying, holding, or selling these stocks in the context of their investment strategies and risk management.
Technical Analysis
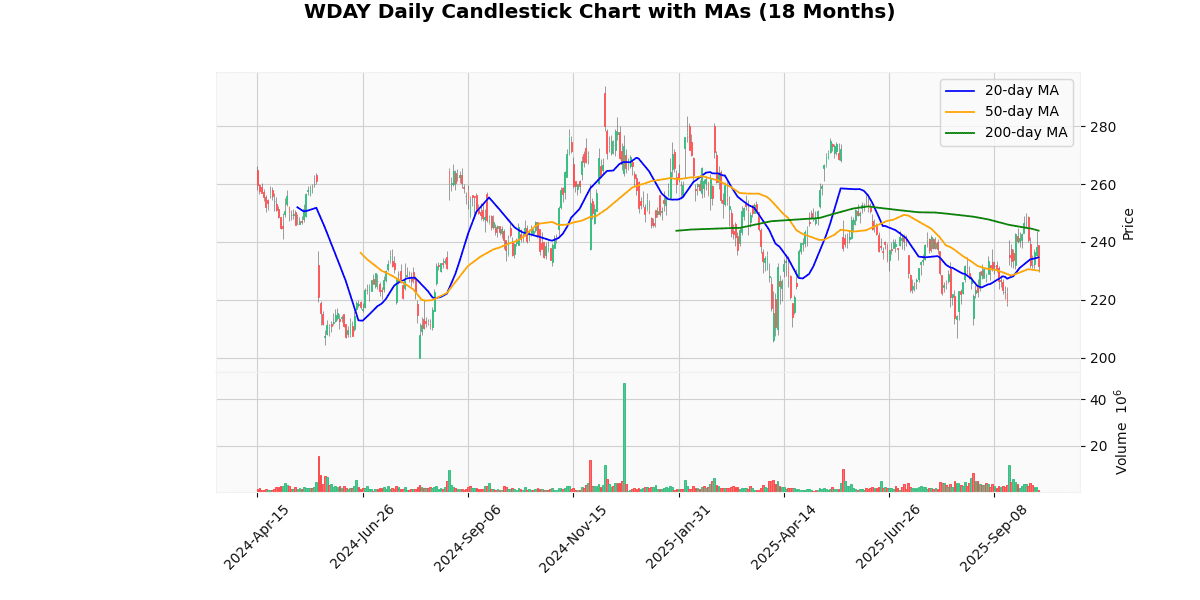
The current price of the asset at $231.49 is positioned below the 20-day moving average (MA20) of $234.66, indicating a short-term bearish sentiment as the price has recently dipped below this key trend indicator. However, it slightly surpasses the 50-day moving average (MA50) of $230.08, suggesting a potential stabilization or minor bullish momentum in the medium term, as the price is attempting to maintain above this level. The significant deviation below the 200-day moving average (MA200) at $243.92 highlights a longer-term bearish trend, reflecting that the asset has been underperforming over a more extended period. Investors might view the current positioning between the MA20 and MA50 as a critical juncture, potentially waiting for further signals to confirm the direction of the underlying trend before making substantial commitments.
Recent Ratings
| Date | Status | Outer | Rating | Price |
|---|---|---|---|---|
| 2025-09-17 00:00:00 | Upgrade | Piper Sandler | Underweight → Neutral | $235 |
| 2025-09-17 00:00:00 | Upgrade | Guggenheim | Neutral → Buy | $285 |
| 2025-08-22 00:00:00 | Reiterated | Oppenheimer | Outperform | $300 → $270 |
| 2025-08-22 00:00:00 | Reiterated | BMO Capital Markets | Outperform | $314 → $285 |
Lennox International Inc (LII) (-2.66%)
Technical Analysis
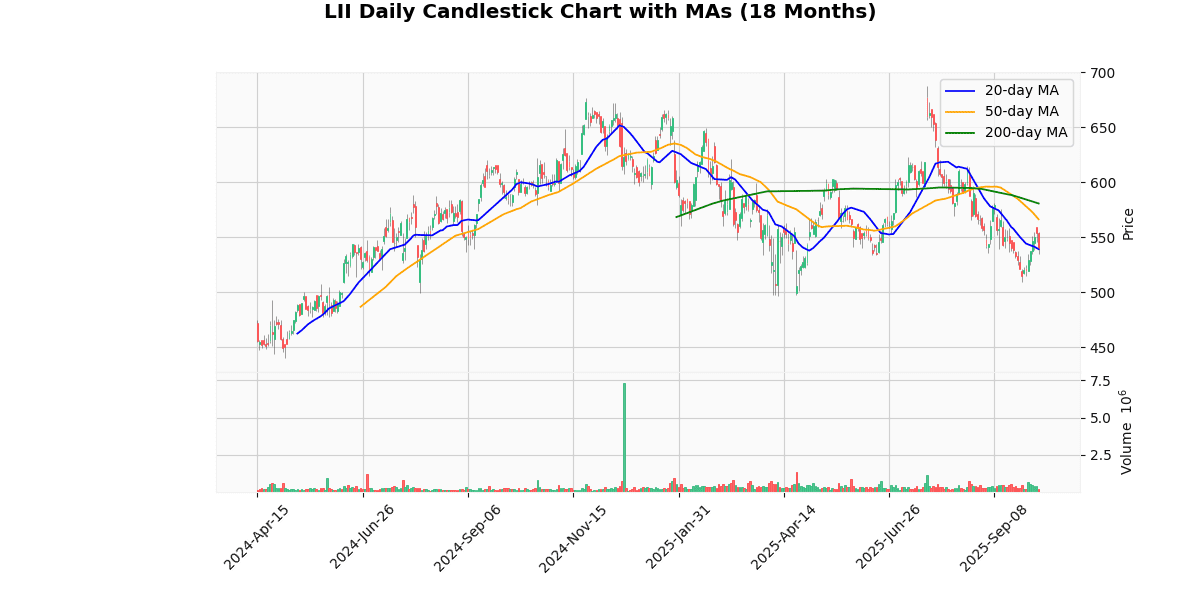
The current price of the asset at $539.24 is slightly above the 20-day moving average (MA20) of $539.17, indicating a potential stabilization or minor uptick in the short-term trend. However, the asset shows a bearish signal in the medium to long term, as it is trading below both the 50-day moving average (MA50) of $566.27 and the 200-day moving average (MA200) of $580.7. This positioning suggests that the asset has been experiencing a downward trend over the past several months. The proximity of the current price to the MA20 could offer a pivot point for traders, but the underperformance relative to the MA50 and MA200 highlights sustained bearish pressure. Investors should monitor for any shifts in momentum or market sentiment that could influence future price movements.
Recent Ratings
| Date | Status | Outer | Rating | Price |
|---|---|---|---|---|
| 2025-10-06 00:00:00 | Upgrade | Wells Fargo | Underweight → Equal Weight | $575 |
| 2025-04-24 00:00:00 | Upgrade | Oppenheimer | Perform → Outperform | $600 |
| 2025-02-26 00:00:00 | Upgrade | Barclays | Equal Weight → Overweight | $665 → $702 |
| 2025-02-03 00:00:00 | Downgrade | Wells Fargo | Equal Weight → Underweight | $630 → $580 |
Eaton Corporation plc (ETN) (-2.33%)
Technical Analysis
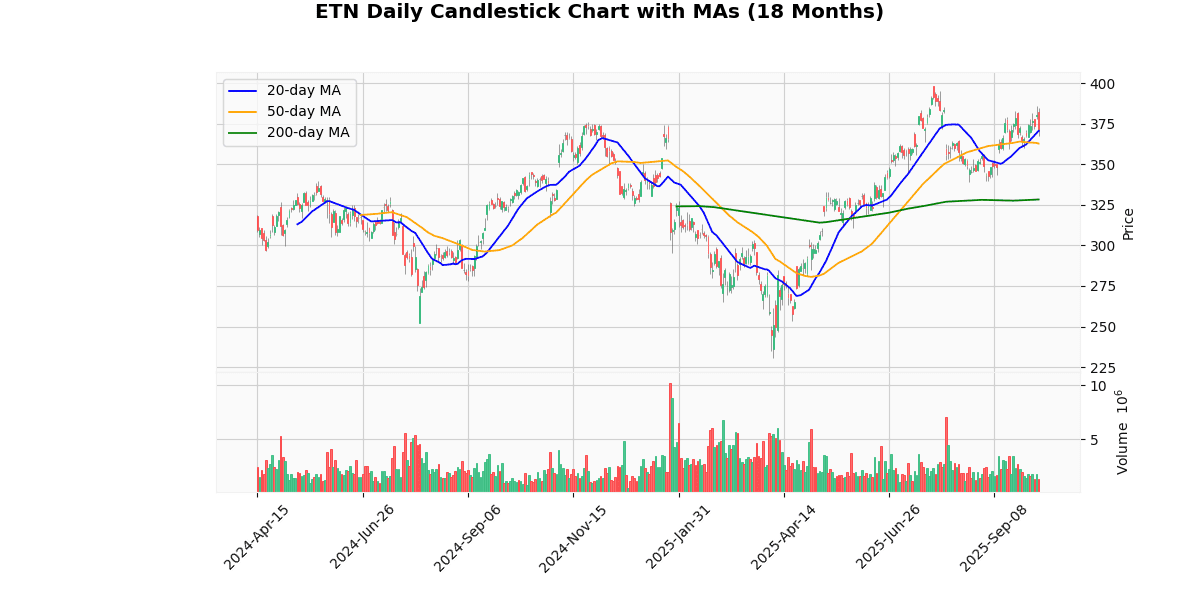
The current price of the asset at $371.35 shows a bullish trend when analyzed against the backdrop of its moving averages (MAs). It is positioned above the 20-day moving average (MA20) of $370.51, suggesting a short-term upward momentum. This is further reinforced as the price also surpasses the 50-day moving average (MA50) of $362.70 and the 200-day moving average (MA200) of $328.25, indicating a robust medium to long-term bullish trend. The consistent increase in moving averages from MA200 through to MA20 highlights a strengthening market sentiment over time. Investors might view these indicators as a confirmation of ongoing positive momentum, potentially leading to increased buying interest in the market. However, vigilance is advised as prices near MA20 could also prompt short-term volatility or corrective pullbacks.
Recent Ratings
| Date | Status | Outer | Rating | Price |
|---|---|---|---|---|
| 2025-09-15 00:00:00 | Upgrade | Melius | Hold → Buy | $495 |
| 2025-09-11 00:00:00 | Initiated | Daiwa Securities | Outperform | $390 |
| 2025-08-20 00:00:00 | Initiated | Rothschild & Co Redburn | Neutral | $336 |
| 2025-05-15 00:00:00 | Initiated | BNP Paribas Exane | Outperform | $380 |
Intuit Inc (INTU) (-2.24%)
Technical Analysis
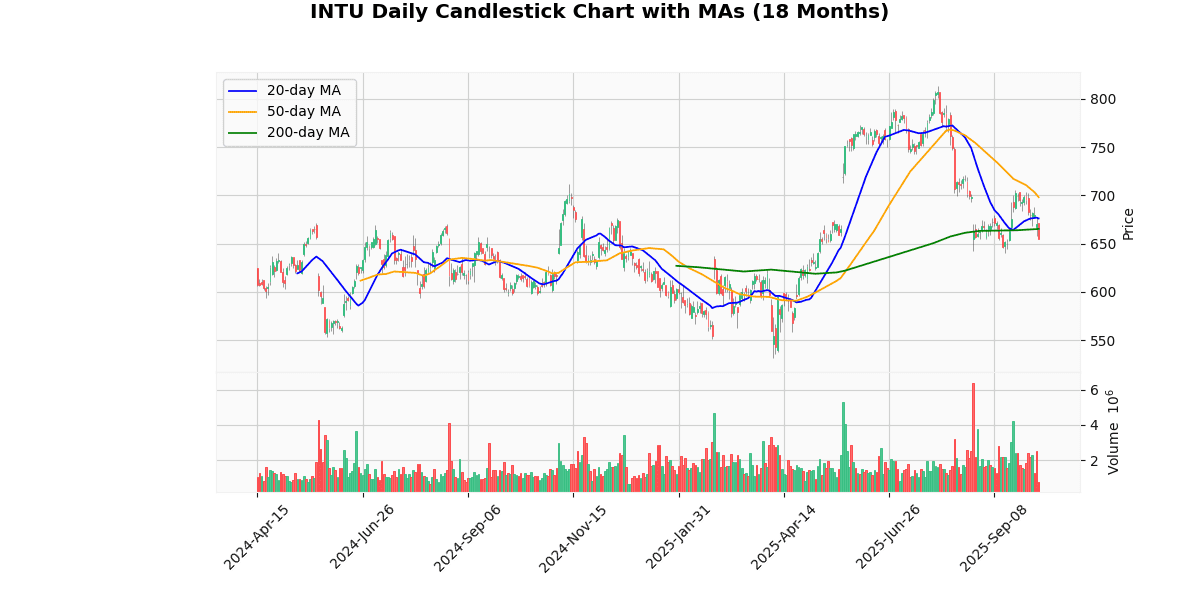
The current price of the asset at $655.79 reflects a bearish trend when analyzed against its moving averages (MAs). The price is positioned below the 20-day MA of $676.14 and the 50-day MA of $698.15, indicating a short to medium-term downward trend. Furthermore, the price is also slightly below the 200-day MA of $665.17, suggesting that the bearish sentiment extends into the longer-term outlook. This positioning below all key MAs typically signals weakness and could be a deterrent for bullish investors. Market participants might view these metrics as indicative of a potential continuation of the downward trend unless there are significant positive external catalysts. Investors should monitor upcoming trading sessions for any signs of price stabilization or reversal before considering entry points.
Recent Ratings
| Date | Status | Outer | Rating | Price |
|---|---|---|---|---|
| 2025-06-26 00:00:00 | Initiated | CLSA | Outperform | $900 |
| 2025-04-23 00:00:00 | Upgrade | HSBC Securities | Hold → Buy | $699 |
| 2025-04-17 00:00:00 | Upgrade | Scotiabank | Sector Perform → Sector Outperform | $700 |
| 2025-03-05 00:00:00 | Upgrade | JP Morgan | Neutral → Overweight | $640 → $660 |
Union Pacific Corp (UNP) (-2.24%)
Recent News (Last 24 Hours)
In recent financial news, CEOs from various industries have issued a stern warning to President Trump regarding the adverse impacts of tariffs on their businesses, as reported by Yahoo Finance on October 7, 2025. These business leaders predict significant disruptions that could lead to increased prices for consumers. This development is likely to influence investor sentiment as the market anticipates potential declines in corporate profitability and consumer spending. Companies directly affected by these tariffs may see their stock prices impacted as they pass on costs to consumers, potentially dampening demand for their products.
Additionally, Zacks Investment Research has spotlighted Reddit and Dave & Buster’s in its daily “Bull and Bear of the Day” analysis. Such distinctions could sway investor interest in these companies, potentially affecting their stock performance based on Zacks’ analytical outlook.
Furthermore, investors are advised to pay close attention to Union Pacific’s upcoming earnings release, as detailed in a Barchart report. The performance of Union Pacific, a major player in the transportation sector, can serve as an indicator of broader economic health, particularly in logistics and goods movement. This earnings report could significantly influence market perceptions of the sector’s stability and growth prospects, potentially affecting related stocks and the broader market indices.
Technical Analysis
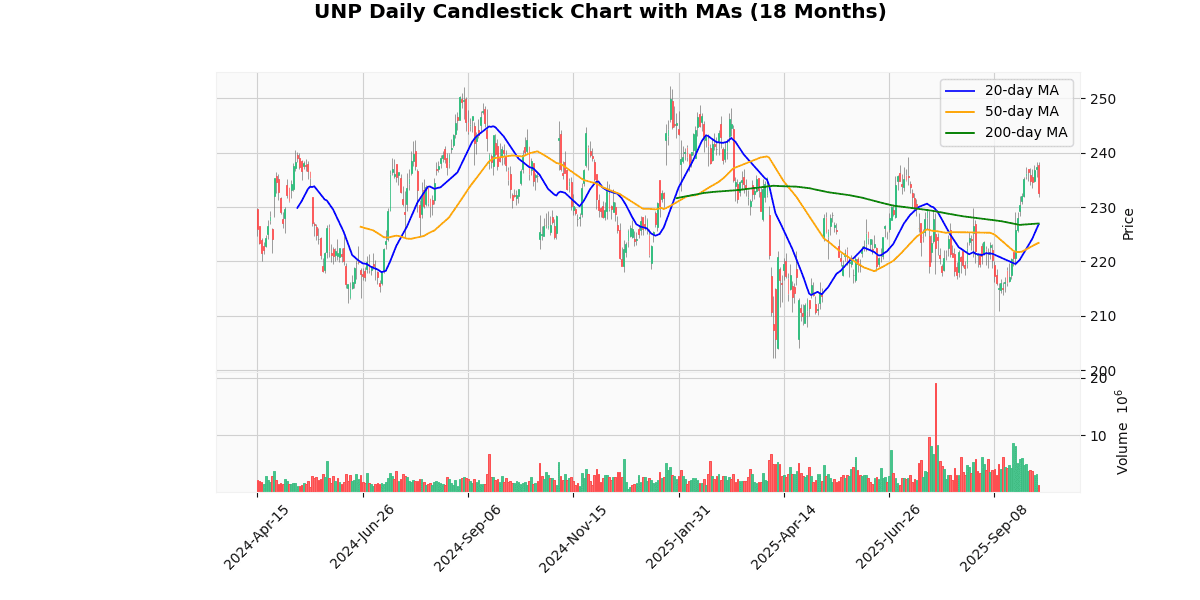
The current price of the asset at $232.21 indicates a bullish trend as it stands above all key moving averages: the 20-day MA at $226.81, the 50-day MA at $223.4, and the 200-day MA at $226.97. This positioning suggests a strong upward momentum in the short term, particularly highlighted by the price exceeding the 20-day and 200-day MAs by a notable margin. The fact that the current price is also above the 50-day MA further reinforces this positive outlook, indicating sustained buying interest over a medium-term period. Investors might view these metrics as a confirmation of a robust bullish trend, potentially leading to increased buying pressure as the asset appears to be maintaining a steady climb above these critical technical thresholds.
Recent Ratings
| Date | Status | Outer | Rating | Price |
|---|---|---|---|---|
| 2025-09-16 00:00:00 | Upgrade | Loop Capital | Sell → Hold | $227 |
| 2025-09-15 00:00:00 | Upgrade | Citigroup | Neutral → Buy | $251 |
| 2025-08-12 00:00:00 | Downgrade | Argus | Buy → Hold | |
| 2025-07-25 00:00:00 | Upgrade | Jefferies | Hold → Buy | $285 |
Caterpillar Inc (CAT) (-2.01%)
Technical Analysis
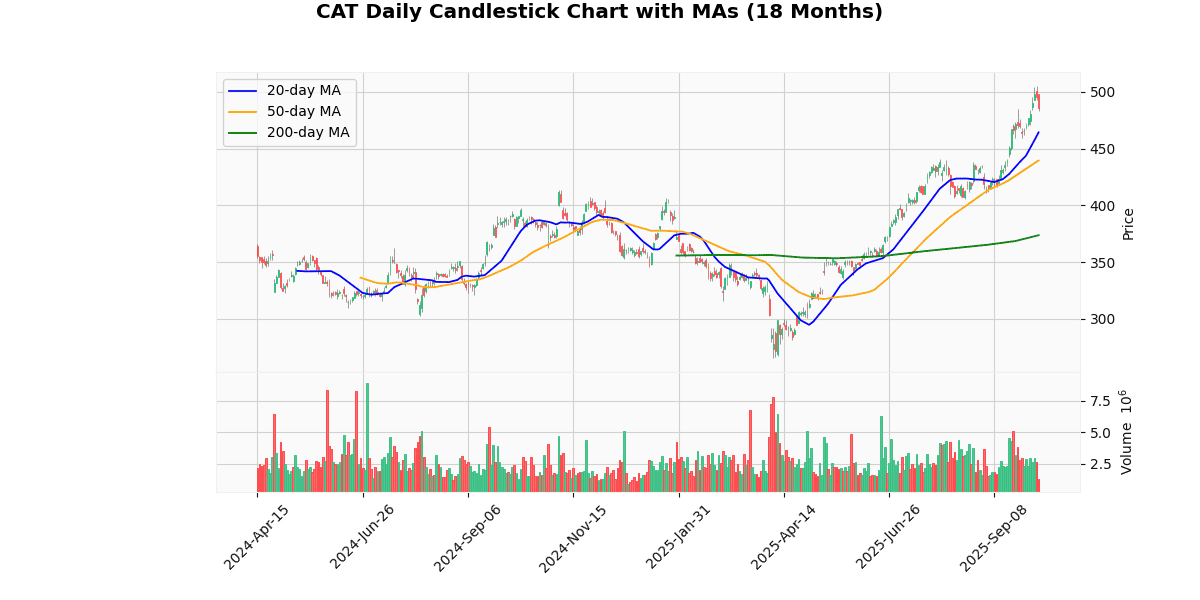
The current price of the asset at $485.48 shows a pronounced upward trend when analyzed against its moving averages (MAs). The 20-day MA at $464.4, the 50-day MA at $439.54, and the 200-day MA at $373.72 all indicate a consistent bullish momentum over short, medium, and long-term periods. The price standing well above the 200-day MA highlights a strong long-term upward trajectory, suggesting significant investor confidence and a robust market sentiment over an extended period. The increasing gap between the shorter duration MAs (20-day and 50-day) and the 200-day MA further underscores this growth. Investors might view these indicators as a potential signal for continued bullish behavior, although caution should be advised as the market may also adjust for overextensions.
Recent Ratings
| Date | Status | Outer | Rating | Price |
|---|---|---|---|---|
| 2025-10-03 00:00:00 | Upgrade | Erste Group | Hold → Buy | |
| 2025-08-19 00:00:00 | Upgrade | Evercore ISI | In-line → Outperform | $476 |
| 2025-08-07 00:00:00 | Downgrade | Morgan Stanley | Equal-Weight → Underweight | $350 |
| 2025-07-09 00:00:00 | Upgrade | Melius | Hold → Buy | $500 |
Monolithic Power System Inc (MPWR) (-1.96%)
Recent News (Last 24 Hours)
In a recent analysis published by Zacks on October 7, 2025, the investment research firm compared ON Semiconductor (ON) and Monolithic Power Systems (MPWR), evaluating which of the two semiconductor companies presents a better value stock opportunity. This comparison is particularly timely given the competitive dynamics in the semiconductor industry, which is currently experiencing shifts in demand due to technological advancements and global supply chain adjustments.
Investors and stakeholders in ON and MPWR should closely monitor the outcomes of such analyses, as they can significantly influence market perceptions and stock valuations. A favorable report for either company could potentially attract more investors by highlighting stronger financial metrics or better market positioning compared to its peer. Conversely, a less favorable view could pressure the stock price if investors adjust their holdings based on perceived relative weaknesses. This analysis is crucial for informing investment decisions in the highly volatile tech sector.
Technical Analysis
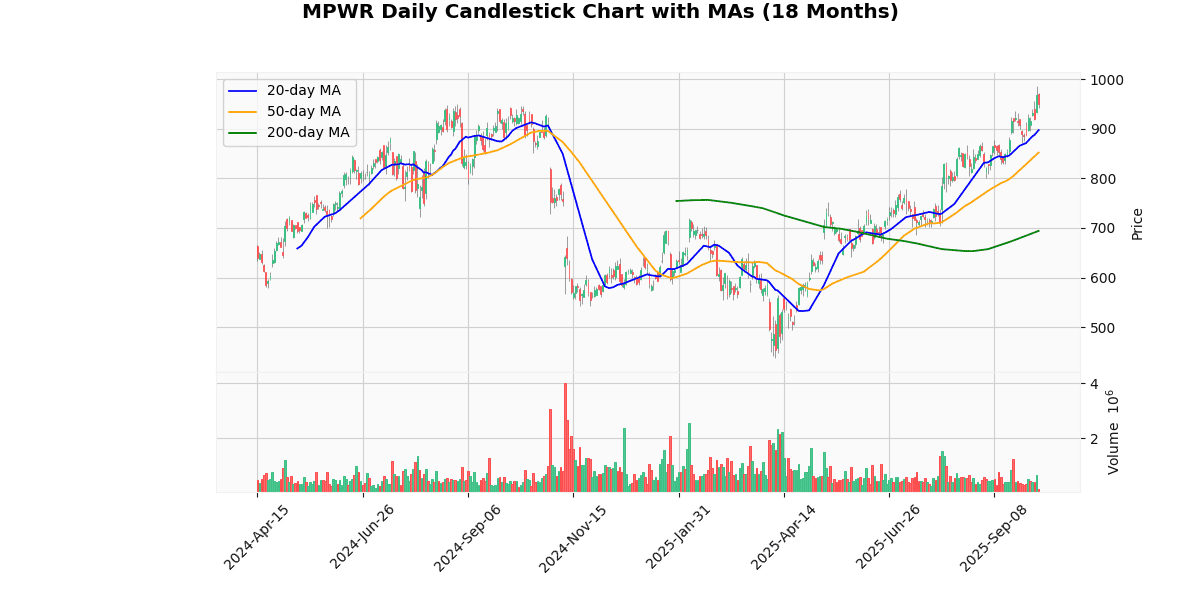
The current price of 945.9 indicates a robust upward trend in the asset, as evidenced by its position above all key moving averages: 20-day (MA20), 50-day (MA50), and 200-day (MA200). The MA20 at 896.87 and MA50 at 851.7 suggest a strong short to medium-term bullish momentum, as the current price exceeds these levels, indicating recent and consistent buying interest. The significant gap between the current price and the MA200, which stands at 693.97, underscores a longer-term upward trajectory, highlighting substantial gains over the past months.
This positioning above all major moving averages not only reflects positive sentiment but also suggests that the asset may be in an overbought territory, potentially prompting a future price consolidation or pullback as traders might take profits. Investors should monitor for any signs of reversal but remain cognizant of the prevailing upward momentum.
Recent Ratings
| Date | Status | Outer | Rating | Price |
|---|---|---|---|---|
| 2025-10-03 00:00:00 | Reiterated | Citigroup | Buy | $825 → $1100 |
| 2025-05-02 00:00:00 | Reiterated | TD Cowen | Buy | $600 → $675 |
| 2024-12-11 00:00:00 | Initiated | Citigroup | Buy | $700 |
| 2024-11-22 00:00:00 | Initiated | Wells Fargo | Equal Weight | $610 |
Tyler Technologies Inc (TYL) (-1.90%)
Technical Analysis
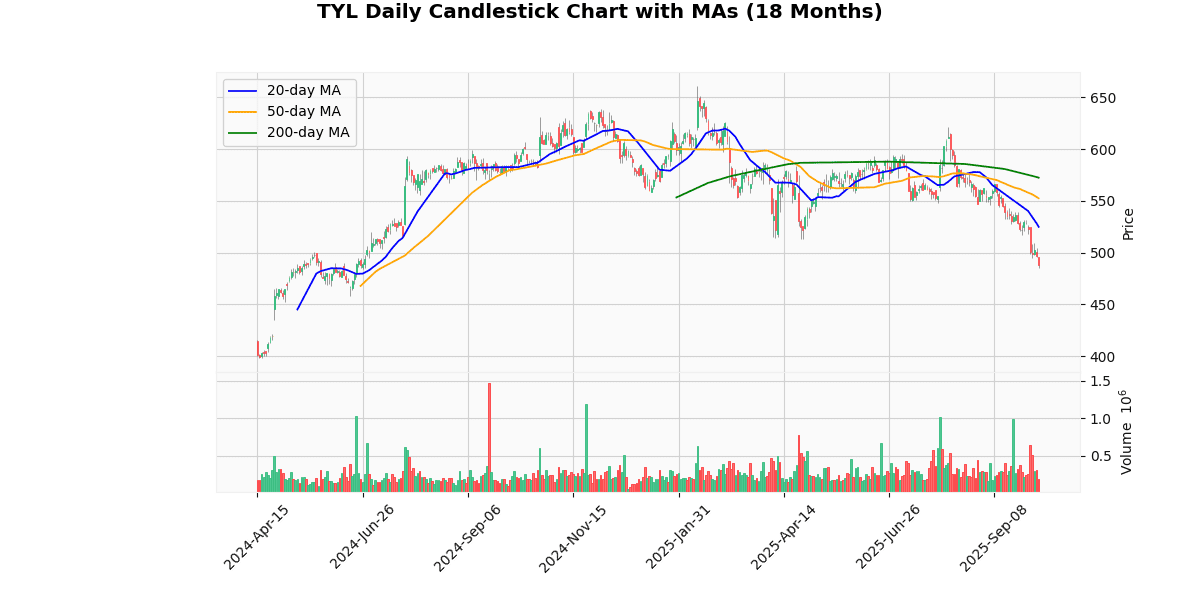
The current price of the asset at $486.95 reflects a notable downtrend when compared to its moving averages: 20-day MA at $524.82, 50-day MA at $552.45, and 200-day MA at $572.37. This positioning below all key moving averages indicates a bearish momentum in the short, medium, and long term. The significant gap between the current price and the moving averages, especially the 200-day MA, suggests that the asset has been under considerable selling pressure. The descending order of the moving averages further confirms a sustained downward trend. Investors might view this as a potential signal for continued bearishness unless there is a strong reversal supported by high volume or external market factors. This setup typically advises caution among buyers and could be opportune for traders looking to capitalize on short positions.
Recent Ratings
| Date | Status | Outer | Rating | Price |
|---|---|---|---|---|
| 2025-06-03 00:00:00 | Initiated | Cantor Fitzgerald | Neutral | $600 |
| 2025-01-07 00:00:00 | Downgrade | Wells Fargo | Overweight → Equal Weight | $670 → $615 |
| 2024-10-07 00:00:00 | Upgrade | Barclays | Equal Weight → Overweight | $577 → $700 |
| 2024-05-21 00:00:00 | Reiterated | Needham | Buy | $500 → $600 |
Disclaimer
The content on MarketsFN.com is provided for educational and informational purposes only. It does not constitute financial advice, investment recommendations, or trading guidance. All investments involve risks, and past performance does not guarantee future results. You are solely responsible for your investment decisions and should conduct independent research and consult a qualified financial advisor before acting. MarketsFN.com and its authors are not liable for any losses or damages arising from your use of this information.


