Top 10 Performers
PepsiCo Inc (PEP) (4.14%)
Recent News (Last 24 Hours)
PepsiCo has been active in the news with several strategic moves that could influence its stock performance. Notably, the company has appointed a Walmart veteran as its new CFO, signaling a potential strategic shift towards more robust financial management and cost efficiency (Fortune). This move aligns with PepsiCo’s ongoing efforts to revamp its beverage portfolio and enhance operational efficiencies, as highlighted in their recent earnings call where they discussed balancing innovation, cost controls, and adapting to shifting consumer behaviors (StockStory).
Additionally, PepsiCo’s CEO emphasized the brand’s focus on adding ‘functionality’ to snacking, which could attract health-conscious consumers and potentially boost sales in that segment (Yahoo Finance Video). The company’s alignment with Elliott Management’s view that PepsiCo is undervalued suggests potential strategic initiatives to unlock shareholder value (CNBC TV).
These developments, combined with a positive earnings beat for Q3 2025 where sales were up year-over-year (Zacks), position PepsiCo favorably in the market. However, broader market trends and consumer spending behaviors will continue to play critical roles in determining the actual impact on PepsiCo’s stock. Investors should monitor how these strategic changes are implemented and how they resonate with consumers and investors alike.
Technical Analysis
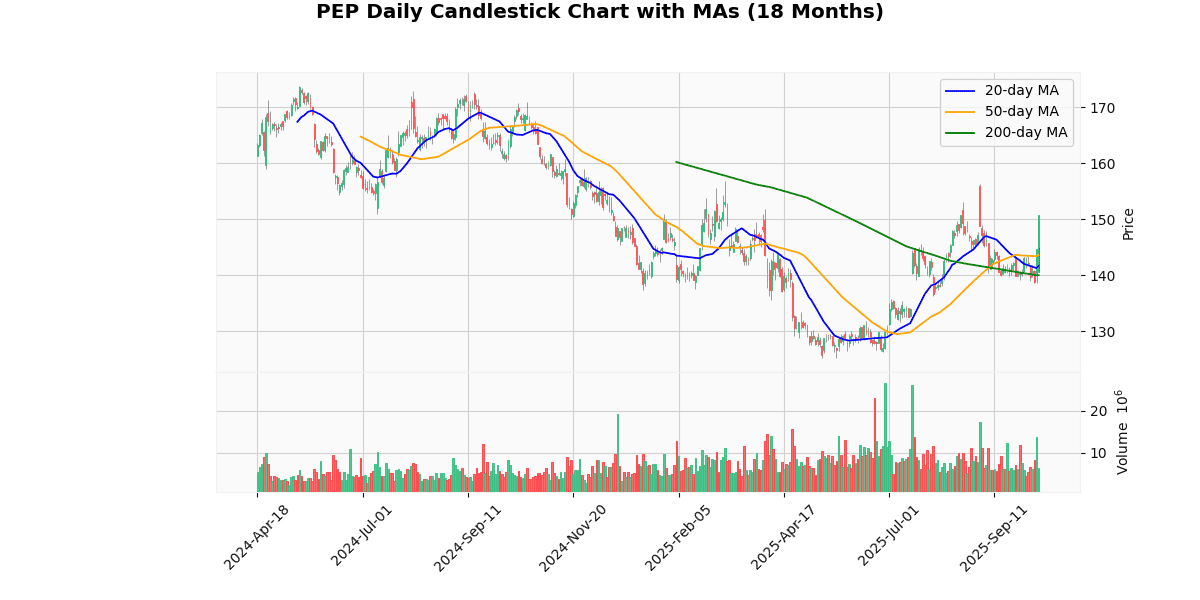
The current price of the asset at $150.17 is exhibiting a bullish trend when analyzed against its moving averages (MAs). Notably, the price surpasses all key MAs: the 20-day MA at $141.6, the 50-day MA at $143.67, and the 200-day MA at $140.00. This positioning indicates a strong upward momentum, as the current price is not only above the short-term 20-day MA but also exceeds the medium and long-term averages, suggesting sustained buyer interest.
The significant gap between the current price and these MAs could also imply that the asset is potentially overextended in the short term, raising the possibility of a corrective pullback. However, the consistent higher placement relative to all three MAs generally signals robust market strength and could attract further buying activity, supporting continued upward movement in the near term.
Recent Ratings
| Date | Status | Outer | Rating | Price |
|---|---|---|---|---|
| 2025-04-15 00:00:00 | Downgrade | BofA Securities | Buy → Neutral | $155 |
| 2025-03-18 00:00:00 | Downgrade | Barclays | Overweight → Equal Weight | $168 → $156 |
| 2025-03-12 00:00:00 | Downgrade | Jefferies | Buy → Hold | $171 → $170 |
| 2025-01-07 00:00:00 | Initiated | Piper Sandler | Overweight | $171 |
Philip Morris International Inc (PM) (2.35%)
Recent News (Last 24 Hours)
As of the latest update, there have been no significant news developments in the past 24 hours that directly impact the stock market. The absence of fresh news can lead to a period of market stability, as investors may not react strongly in either direction without new information to influence their decisions. However, this lack of news should prompt investors to focus on broader market trends, upcoming economic data releases, or geopolitical events that could indirectly affect market sentiments and trading behaviors. It’s also an opportune time for investors to review and adjust their portfolios based on long-term strategies rather than immediate market reactions. Overall, the absence of new information could result in subdued trading volumes and minimal volatility, unless other external factors come into play. Investors should stay alert for any emerging news that could break this calm and influence market dynamics.
Technical Analysis
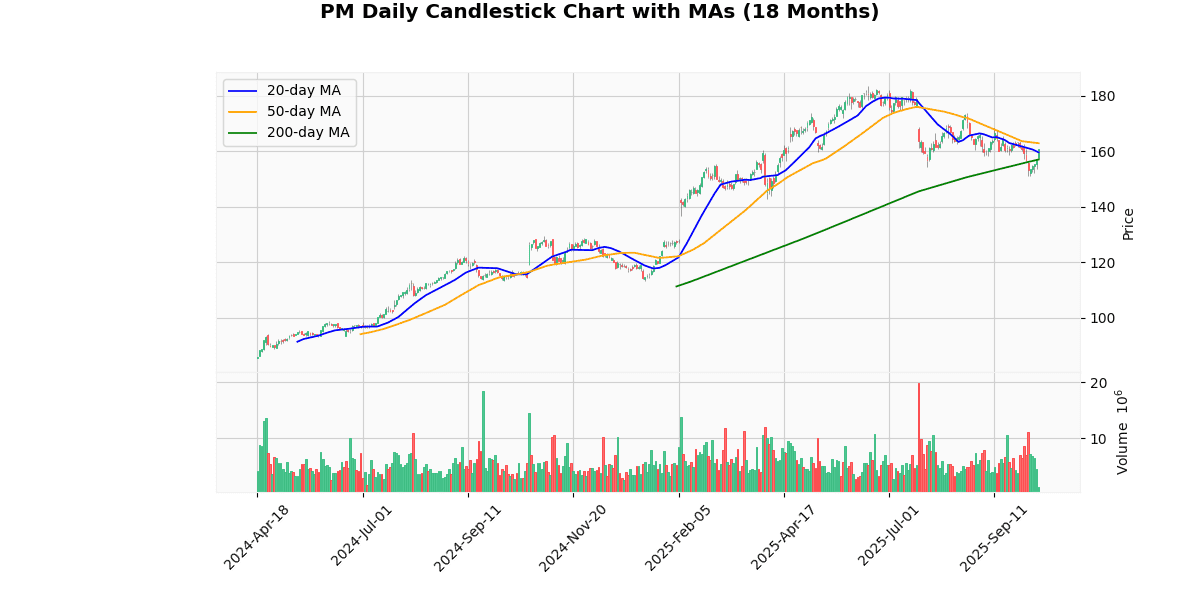
The current price of the asset at $160.71 reflects a nuanced positioning within its moving average spectrum. It is trading above the 20-day moving average (MA20) of $159.51, indicating a short-term bullish sentiment as it surpasses recent trading levels. However, it remains below the 50-day moving average (MA50) of $162.82, suggesting some resistance in the medium term that could limit upward momentum. Notably, the asset’s price is comfortably above the 200-day moving average (MA200) of $156.96, which underscores a longer-term upward trend. This positioning above the MA200 but below the MA50 may signal consolidation phases or potential volatility as the market decides on a more definitive direction. Investors should monitor these averages as breaches or sustained movements could imply significant shifts in market dynamics.
Recent Ratings
| Date | Status | Outer | Rating | Price |
|---|---|---|---|---|
| 2025-07-09 00:00:00 | Resumed | Jefferies | Buy | $220 |
| 2025-05-22 00:00:00 | Initiated | Needham | Buy | $195 |
| 2025-04-25 00:00:00 | Upgrade | UBS | Sell → Neutral | $170 |
| 2025-03-14 00:00:00 | Upgrade | Argus | Hold → Buy |
CVS Health Corp (CVS) (2.14%)
Recent News (Last 24 Hours)
Recent developments in the retail and healthcare sectors could have notable implications for the stocks of Best Buy, Target, and Aetna. According to a report from TheStreet on October 9, 2025, Best Buy and Target are experiencing difficulties. The specifics of these struggles were not detailed in the summary provided, but such news typically indicates potential challenges in revenue or profit margins, possibly influenced by economic downturns, increased competition, or operational inefficiencies. This could lead to bearish sentiment among investors regarding the stocks of these retail giants.
Conversely, Aetna reported a significant achievement in its Medicare Advantage program, with over 81% of its members enrolled in 4-Star plans and over 63% in 4.5-Star plans for 2026, as per a PR Newswire report. This improvement in plan ratings could enhance Aetna’s competitive positioning in the Medicare Advantage market, potentially boosting investor confidence and positively impacting its stock price by aligning with quality benchmarks that attract and retain members.
Investors in these sectors should closely monitor these developments, as they could influence the financial performance and stock valuations of the companies involved.
Technical Analysis
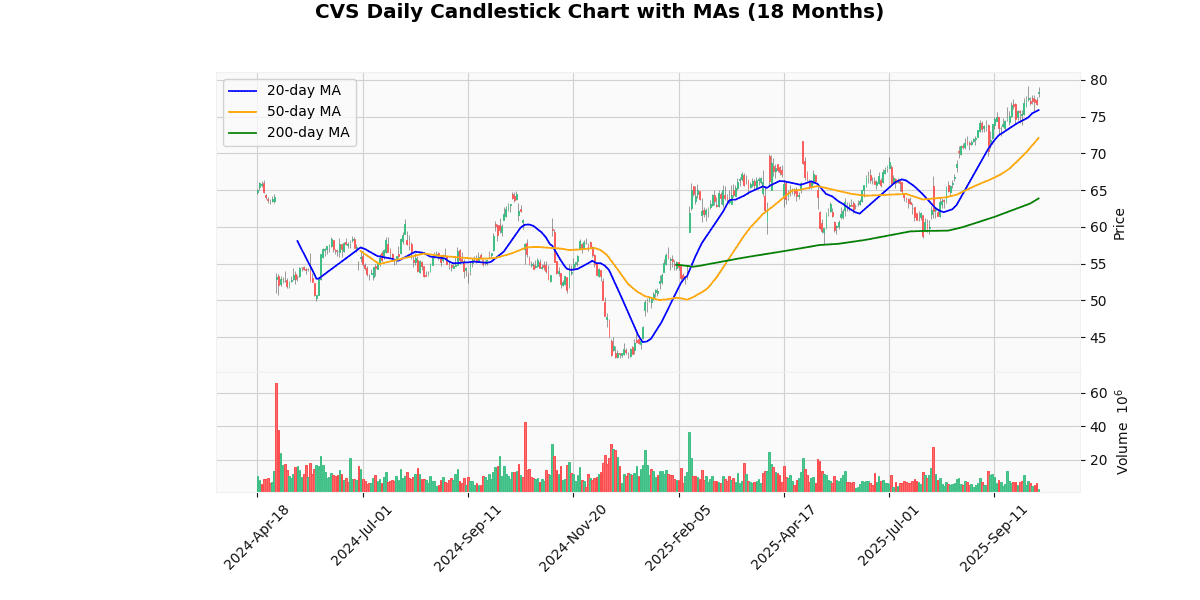
The current price of the asset at $78.26 indicates a bullish trend, as it is positioned above all key moving averages: 20-day MA at $75.87, 50-day MA at $72.08, and 200-day MA at $63.86. This configuration suggests a strong upward momentum in the short, medium, and long term. The price exceeding the 20-day MA, which itself is above the 50-day and 200-day MAs, further confirms a robust bullish sentiment in the market. The significant gap between the current price and the 200-day MA highlights sustained buyer interest and potential underestimation of the asset’s value in previous periods. Investors might view these indicators as a confirmation of continuing strength, potentially leading to increased buying pressure as the asset maintains its upward trajectory.
Recent Ratings
| Date | Status | Outer | Rating | Price |
|---|---|---|---|---|
| 2025-08-18 00:00:00 | Upgrade | UBS | Neutral → Buy | $79 |
| 2025-08-14 00:00:00 | Upgrade | Robert W. Baird | Neutral → Outperform | $82 |
| 2025-02-13 00:00:00 | Upgrade | Leerink Partners | Market Perform → Outperform | $55 → $75 |
| 2025-02-12 00:00:00 | Upgrade | Cantor Fitzgerald | Neutral → Overweight |
Verisk Analytics Inc (VRSK) (2.11%)
Technical Analysis
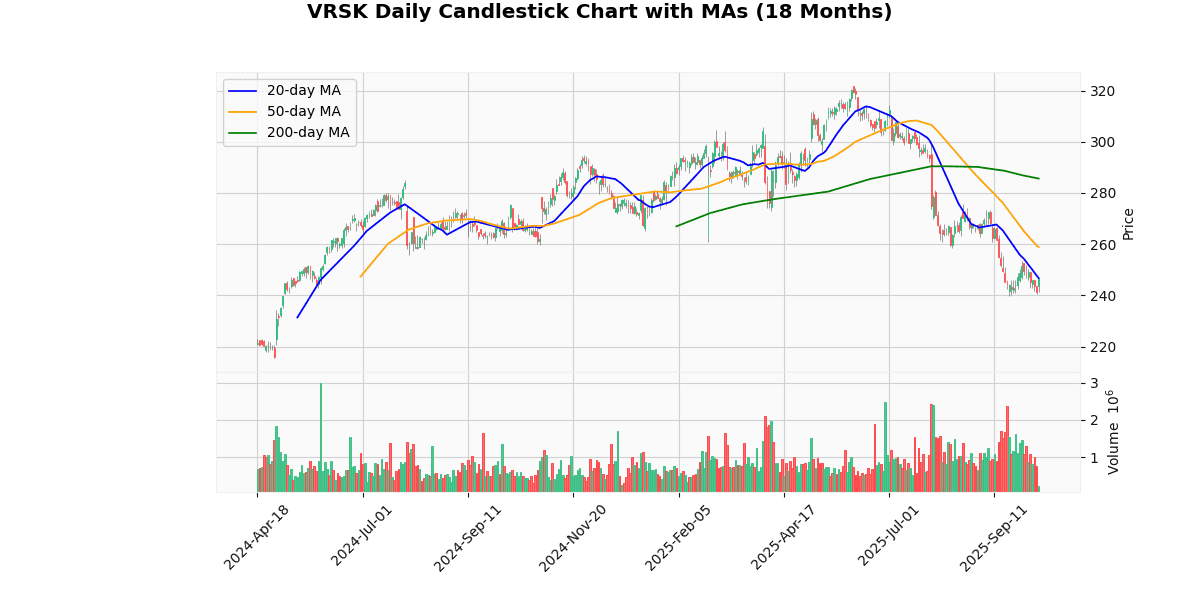
The current price of the asset at $246.8 is positioned just slightly above the 20-day moving average (MA20) of $246.75, indicating a potential stabilization or minor uptrend in the very short term. However, the more extended moving averages present a different narrative. The 50-day moving average (MA50) at $258.84 and the 200-day moving average (MA200) at $285.62 are both significantly higher than the current price, suggesting a longer-term downward trend in the market for this asset.
This positioning below the longer-term moving averages indicates bearish sentiment has been prevailing, potentially due to underlying fundamental issues or broader market conditions affecting the asset. Investors might view the proximity to the MA20 as a pivot point for short-term trades, but the substantial gaps from MA50 and MA200 could deter longer-term investments until more bullish signals emerge.
Recent Ratings
| Date | Status | Outer | Rating | Price |
|---|---|---|---|---|
| 2025-10-01 00:00:00 | Initiated | Seaport Research Partners | Buy | $280 |
| 2025-09-03 00:00:00 | Initiated | Wolfe Research | Outperform | $320 |
| 2025-04-10 00:00:00 | Resumed | BofA Securities | Underperform | $280 |
| 2025-01-10 00:00:00 | Downgrade | Barclays | Overweight → Equal Weight | $310 |
Warner Bros. Discovery Inc (WBD) (2.09%)
Recent News (Last 24 Hours)
Recent developments indicate a dynamic period for Warner Bros. Discovery (WBD). Notably, discussions between Paramount Skydance and Warner Bros. Discovery have been highlighted, suggesting potential strategic collaborations or acquisitions, which could significantly impact WBD’s market positioning and stock performance. The details of these talks, as covered by CNBC TV, remain crucial as they could dictate future corporate strategy and investor sentiment.
Furthermore, a report from Insider Monkey notes that multiple factors have positively influenced WBD’s performance in Q3, hinting at operational successes or favorable market conditions that could bolster investor confidence and enhance stock value.
However, it’s not all positive news. A Zacks report from the previous day points out that WBD’s stock fell more significantly than the broader market, which could raise concerns about underlying issues or sector-specific challenges that might need addressing to reassure stakeholders.
Additionally, MarketWatch discusses Paramount’s interest in acquiring Warner Bros., focusing on the financial logistics of such a deal. This potential acquisition could lead to substantial shifts in market dynamics and competitive advantages, thereby affecting WBD’s stock either positively or negatively depending on the terms and investor reactions to the deal structuring.
Overall, these developments suggest a period of significant activity for Warner Bros. Discovery, with potential impacts on its stock stemming from operational performance, market sentiment, and strategic corporate actions.
Technical Analysis
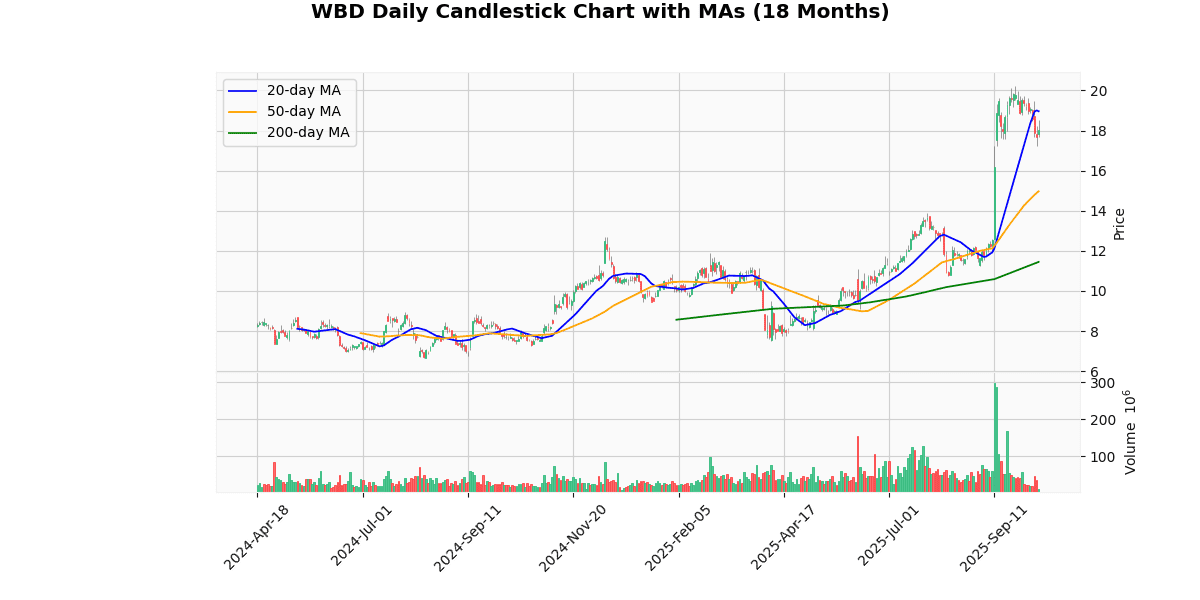
The current price of the asset at $17.99 reflects a recent downtrend when compared to the 20-day moving average (MA20) of $18.96, indicating a short-term bearish sentiment. However, the longer-term perspective provided by the 50-day and 200-day moving averages (MA50 at $14.97 and MA200 at $11.45, respectively) suggests a significant bullish trend over the medium to long term. The current price sitting above both the MA50 and MA200 highlights underlying strength in the asset’s value trajectory. This positioning above longer-term averages, yet below the shorter MA20, may suggest a potential consolidation phase or a temporary pullback in a generally upward trend. Investors might view this as a buying opportunity, anticipating future gains as the price potentially realigns with the shorter-term MA20 or seeks higher resistance levels.
Recent Ratings
| Date | Status | Outer | Rating | Price |
|---|---|---|---|---|
| 2025-09-26 00:00:00 | Downgrade | KeyBanc Capital Markets | Overweight → Sector Weight | |
| 2025-09-16 00:00:00 | Downgrade | TD Cowen | Buy → Hold | $14 |
| 2025-01-21 00:00:00 | Upgrade | MoffettNathanson | Neutral → Buy | $9 → $13 |
| 2024-11-11 00:00:00 | Upgrade | Wolfe Research | Underperform → Peer Perform |
Williams Cos Inc (WMB) (2.04%)
Technical Analysis
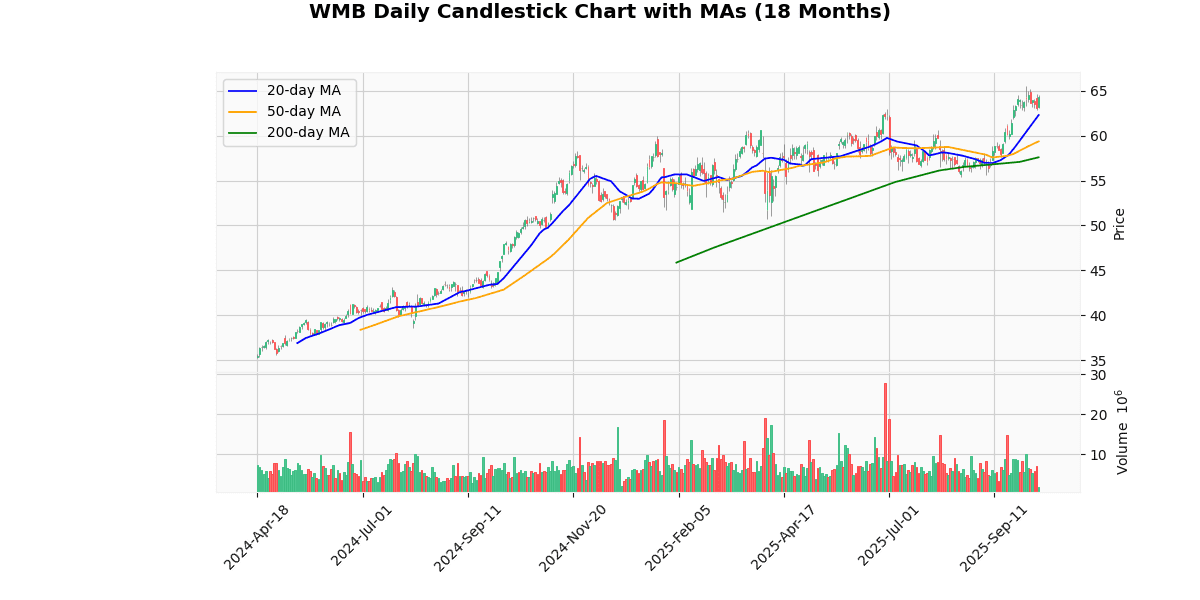
The current price of the asset at $64.13 indicates a bullish trend when analyzed in the context of its moving averages (MAs). The price is positioned above all key MAs: 20-day MA at $62.27, 50-day MA at $59.35, and 200-day MA at $57.58. This alignment suggests a strong upward momentum, as the short-term price (20-day MA) is higher than both medium (50-day MA) and long-term averages (200-day MA), indicating consistent buying interest.
The significant gap between the current price and the 200-day MA also highlights a robust bullish sentiment over the longer term. Investors might view these levels as support zones in case of price pullbacks. Overall, the market positioning is favorable, and the trend appears sustainably positive, potentially attracting more bullish investors looking for growth opportunities.
Recent Ratings
| Date | Status | Outer | Rating | Price |
|---|---|---|---|---|
| 2025-10-09 00:00:00 | Initiated | Jefferies | Buy | $72 |
| 2025-09-19 00:00:00 | Initiated | BMO Capital Markets | Outperform | $66 |
| 2025-08-15 00:00:00 | Upgrade | CIBC | Neutral → Sector Outperform | $64 |
| 2025-07-07 00:00:00 | Initiated | TD Cowen | Buy | $67 |
Southern Company (SO) (2.00%)
Technical Analysis
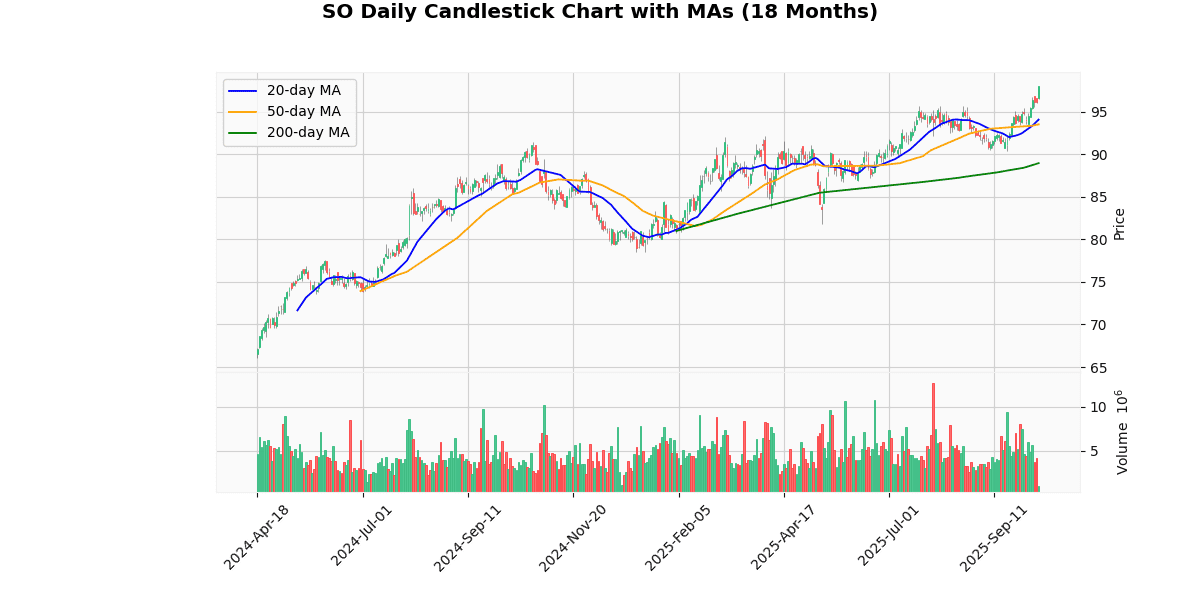
The current price of the asset at $98.03 is displaying a bullish trend as it stands above all key moving averages: the 20-day MA at $94.07, the 50-day MA at $93.51, and the 200-day MA at $88.95. This positioning indicates a strong upward momentum in the short-term, as the price is not only above the shorter 20-day and 50-day MAs but also significantly higher than the long-term 200-day MA. The consistent increase in moving averages from the 200-day to the 20-day suggests that the asset has been gaining value progressively over different time frames, reinforcing the bullish sentiment in the market. Investors might view these metrics as a confirmation of a stable positive trend, potentially attracting more buying interest in anticipation of continued upward movement.
Recent Ratings
| Date | Status | Outer | Rating | Price |
|---|---|---|---|---|
| 2025-10-07 00:00:00 | Initiated | Evercore ISI | In-line | $103 |
| 2025-10-03 00:00:00 | Downgrade | Scotiabank | Sector Outperform → Sector Perform | $99 |
| 2025-06-13 00:00:00 | Initiated | Raymond James | Outperform | $98 |
| 2025-06-05 00:00:00 | Upgrade | Jefferies | Hold → Buy | $100 |
Generac Holdings Inc (GNRC) (1.95%)
Technical Analysis
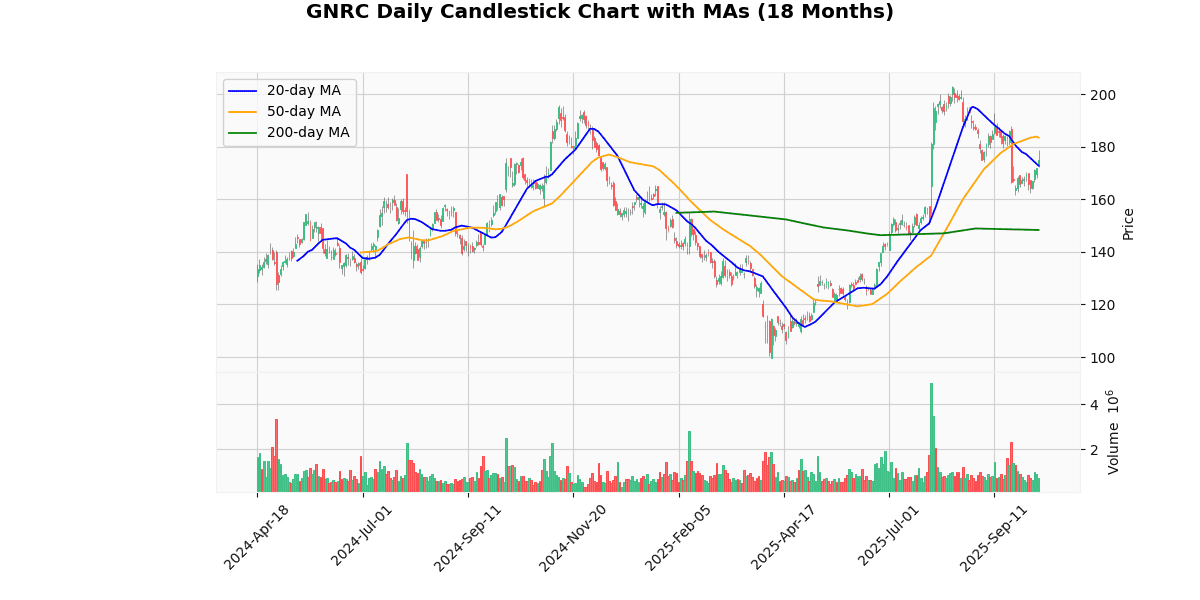
The current price of the asset at $175.5 is positioned above the 20-day moving average (MA20) of $172.8, indicating a short-term upward trend and potential bullish sentiment in recent trading sessions. However, it is trading below the 50-day moving average (MA50) of $183.48, suggesting that the medium-term trend has been bearish with the price experiencing a downward correction from higher levels. Notably, the current price is significantly above the 200-day moving average (MA200) of $148.34, highlighting a strong long-term upward trend. This positioning above the MA200 but below the MA50 could signal a consolidation phase or a potential pivot point where the market is deciding its next major move. Investors might see this as an opportunity to evaluate market entry or exit, considering the mixed signals from different time horizons.
Recent Ratings
| Date | Status | Outer | Rating | Price |
|---|---|---|---|---|
| 2025-08-26 00:00:00 | Downgrade | Citigroup | Buy → Neutral | $219 |
| 2025-07-31 00:00:00 | Reiterated | TD Cowen | Buy | $155 → $198 |
| 2025-07-29 00:00:00 | Upgrade | Guggenheim | Neutral → Buy | $190 |
| 2025-05-07 00:00:00 | Upgrade | Janney | Neutral → Buy |
Cboe Global Markets Inc (CBOE) (1.95%)
Technical Analysis
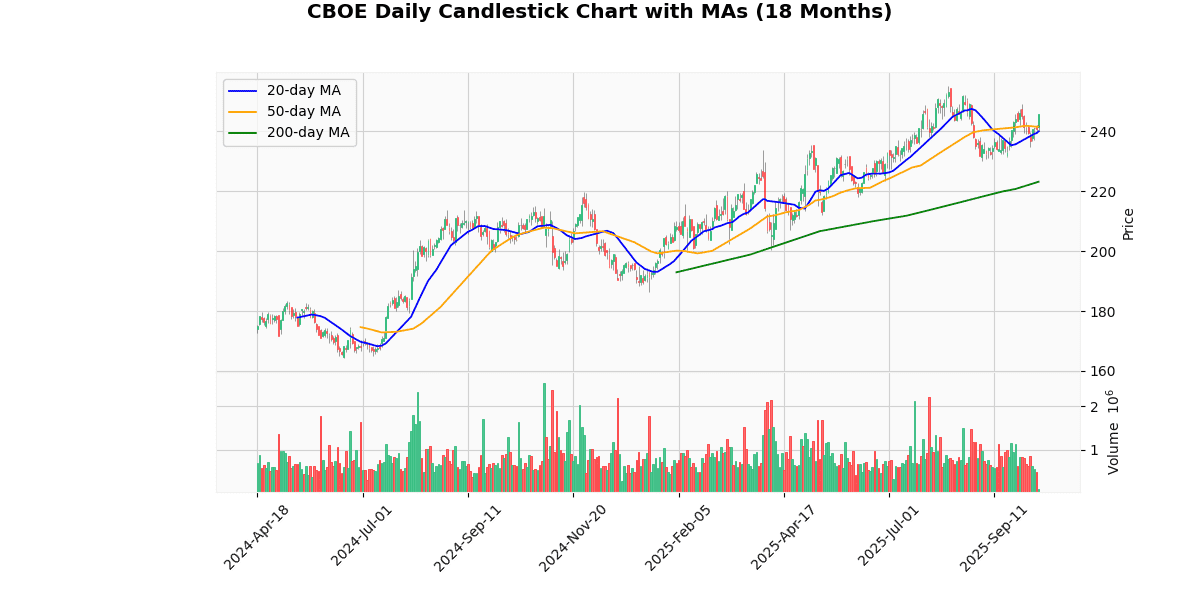
The current price of the asset at $245.6 is exhibiting a bullish trend as it stands above all key moving averages: 20-day MA at $239.97, 50-day MA at $241.64, and 200-day MA at $223.18. This positioning indicates a strong upward momentum in the short-term, as the price is not only above the short-term 20-day and 50-day MAs, suggesting recent buying interest, but also significantly higher than the 200-day MA, reflecting a robust long-term uptrend. The gap between the current price and these moving averages, particularly the 200-day MA, underscores a potential overextension in the market, which could lead to volatility or a price correction. Investors should monitor for any signs of reversal, but the prevailing trend points to continued bullish behavior in the near term.
Recent Ratings
| Date | Status | Outer | Rating | Price |
|---|---|---|---|---|
| 2025-05-14 00:00:00 | Downgrade | Morgan Stanley | Overweight → Underweight | $215 |
| 2025-04-10 00:00:00 | Downgrade | BofA Securities | Buy → Neutral | $227 |
| 2025-04-08 00:00:00 | Upgrade | Morgan Stanley | Underweight → Overweight | $235 |
| 2025-01-10 00:00:00 | Initiated | William Blair | Mkt Perform |
Factset Research Systems Inc (FDS) (1.94%)
Technical Analysis
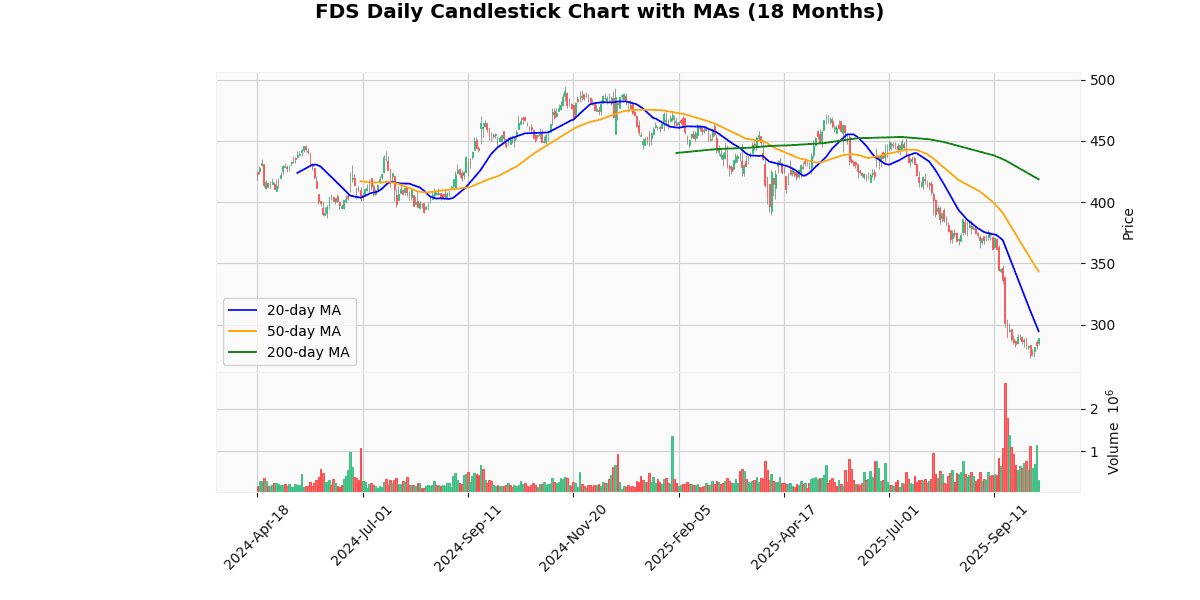
The analysis of the provided price metrics indicates a bearish trend in the market. The current price of $288.7 is below all the key moving averages: 20-day at $294.65, 50-day at $343.64, and 200-day at $418.62. This positioning suggests a sustained downward momentum, as the shorter-term moving average (MA20) is also positioned below the longer-term averages (MA50 and MA200), further confirming the bearish sentiment. The significant gap between the current price and the MA200 highlights a robust downtrend over a longer period. Investors might view this as a potential signal for continued bearish conditions, possibly adjusting their positions to mitigate risk or capitalize on potential further declines. Overall, the market positioning and moving averages strongly suggest a cautious approach for those looking to enter long positions.
Recent Ratings
| Date | Status | Outer | Rating | Price |
|---|---|---|---|---|
| 2025-09-22 00:00:00 | Upgrade | UBS | Neutral → Buy | $425 |
| 2025-09-12 00:00:00 | Upgrade | Rothschild & Co Redburn | Sell → Neutral | $370 |
| 2025-06-26 00:00:00 | Upgrade | Raymond James | Underperform → Mkt Perform | |
| 2025-03-21 00:00:00 | Downgrade | Wells Fargo | Equal Weight → Underweight | $402 |
Worst 10 Performers
Mosaic Company (MOS) (-7.54%)
Recent News (Last 24 Hours)
In recent financial news, several key developments could potentially impact stock markets and investor decisions. Kalshi, a notable player in the financial sector, has successfully raised $300 million, as reported on October 10, 2025. This substantial capital infusion could signal robust confidence from investors and might influence market perceptions positively towards Kalshi’s growth prospects and financial health.
Additionally, BP secured a legal victory against Venture Global, which could alleviate some legal uncertainties and potentially strengthen BP’s stock by enhancing its corporate image and stability in the eyes of investors.
In analyst movements, Align Technology was downgraded, while NetEase received an upgrade from Wall Street analysts. These changes could lead to volatility in the respective stocks, influencing investor sentiment and possibly leading to shifts in stock prices based on perceived future performance.
Mosaic Company also made headlines with its announcement of preliminary third-quarter volumes, coupled with a rating upgrade to ‘Strong Buy’ by Zacks on the previous day. This suggests a positive outlook on Mosaic’s operational performance and financial stability, likely making it an attractive option for investors seeking growth opportunities in the market.
Overall, these developments provide crucial insights and could have significant implications for investment strategies and stock market dynamics.
Technical Analysis
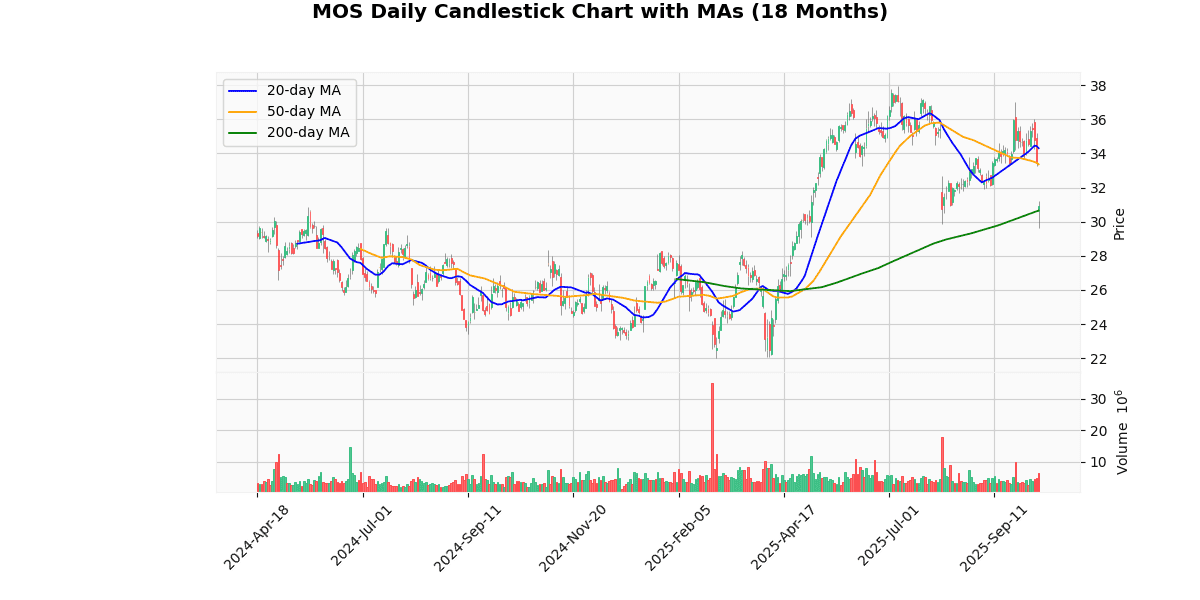
The current price of the asset at $30.81 shows a notable deviation from its short and medium-term moving averages, with the 20-day moving average (MA20) at $34.3 and the 50-day moving average (MA50) at $33.36, indicating a bearish trend in the recent weeks. This downward movement suggests that the asset has been underperforming relative to its recent historical prices. However, the current price is slightly above the 200-day moving average (MA200) at $30.65, which could signal a potential support level. If the price remains above the MA200, it might indicate a stabilization or potential reversal of the downtrend. Investors should monitor if the price can sustain above the MA200 to confirm whether the longer-term trend might shift from bearish to bullish.
Recent Ratings
| Date | Status | Outer | Rating | Price |
|---|---|---|---|---|
| 2025-10-10 | Downgrade | Scotiabank | Sector Outperform → Sector Perform | $34 |
| 2025-07-23 00:00:00 | Upgrade | UBS | Neutral → Buy | $45 |
| 2025-05-08 00:00:00 | Upgrade | RBC Capital Mkts | Sector Perform → Outperform | $40 |
| 2025-03-20 00:00:00 | Upgrade | Oppenheimer | Perform → Outperform | $33 |
Block Inc (XYZ) (-5.95%)
Recent News (Last 24 Hours)
Recent developments surrounding Block Inc. (formerly Square Inc.) and its association with Bitcoin have potential implications for its stock performance. Notably, Jack Dorsey, a prominent advocate for Bitcoin, is pushing for tax exemptions on everyday Bitcoin transactions, a move supported by Senator Cynthia Lummis through a bill she introduced. This legislative support could enhance the adoption and usability of Bitcoin, potentially benefiting Block, which is actively integrating Bitcoin-related services.
Furthermore, Block is set to announce its Q3 2025 results soon, an event closely watched by investors for insights into the company’s financial health and strategic direction, especially in its cryptocurrency ventures. The introduction of new features to Square AI and the launch of Square Bitcoin are pivotal developments that could influence investor sentiment by showcasing Block’s innovation and expansion in digital payment solutions.
Additionally, unusual options activity indicates bullish sentiment among traders regarding Block’s stock, suggesting an anticipation of positive movements following the upcoming earnings report and recent strategic initiatives. This confluence of product innovation, legislative support for cryptocurrency, and investor optimism could collectively drive positive momentum for Block’s stock in the near term.
Technical Analysis
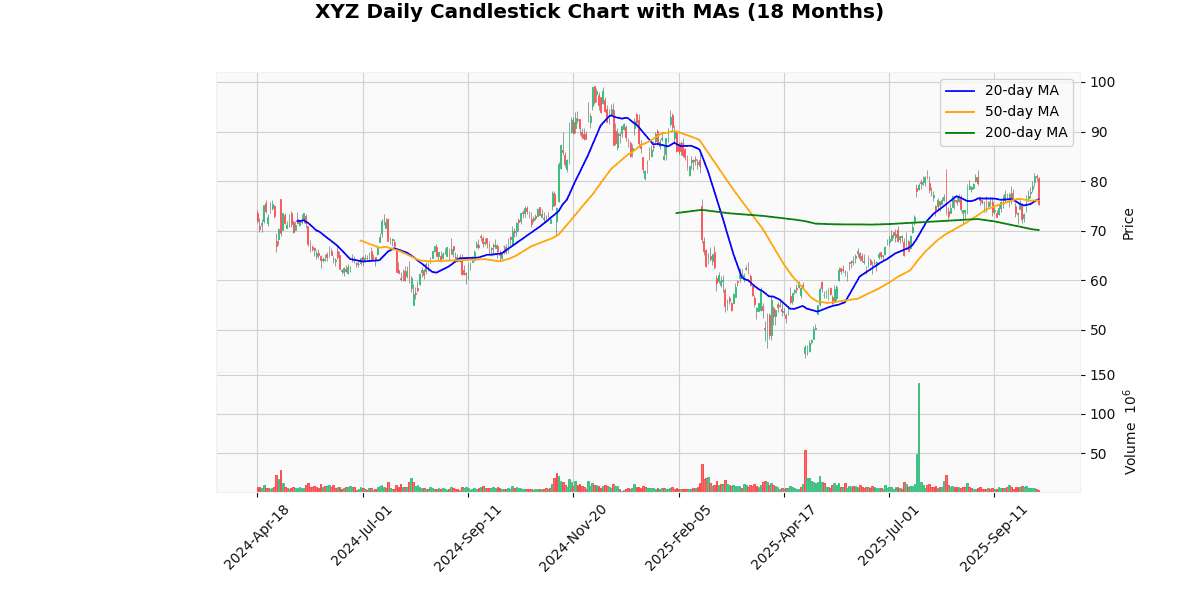
The current price of the asset at $75.55 is positioned below both the 20-day and 50-day moving averages (MA20 at $76.37 and MA50 at $76.13, respectively), indicating a short-term bearish sentiment in the market. This suggests that the asset has been experiencing a recent downturn or correction, as prices have dipped below the levels typically considered benchmarks for short-term trading momentum. However, the price remains well above the 200-day moving average (MA200 at $70.15), which signals that the longer-term trend is still bullish. The significant gap between the current price and the MA200 suggests that despite recent pullbacks, the overall upward trend over the past months is intact. Investors might view the current dip as a potential buying opportunity, assuming the long-term bullish trend will continue.
Recent Ratings
| Date | Status | Outer | Rating | Price |
|---|---|---|---|---|
| 2025-09-02 00:00:00 | Downgrade | BNP Paribas Exane | Outperform → Neutral | $86 |
| 2025-08-08 00:00:00 | Reiterated | Monness Crespi & Hardt | Buy | $95 → $105 |
| 2025-08-08 00:00:00 | Downgrade | Compass Point | Buy → Sell | $65 |
| 2025-08-05 00:00:00 | Downgrade | Morgan Stanley | Overweight → Equal-Weight | $73 |
Advanced Micro Devices Inc (AMD) (-5.67%)
Recent News (Last 24 Hours)
Recent news highlights significant developments in the AI and semiconductor sectors, particularly focusing on Advanced Micro Devices (AMD) and its competitors. AMD’s stock has shown remarkable growth, surging 24% due to its partnership with OpenAI, as reported by Motley Fool. This partnership, along with a strong AI ramp visibility indicated by AMD’s CFO, has bolstered investor confidence, potentially positioning AMD for sustained growth in the high-demand AI market.
Concurrently, Nvidia has also been in the spotlight, achieving a record high in stock prices, driven by its advancements in AI chips. This suggests a robust competitive landscape in the AI sector, which could influence market dynamics and investor strategies.
The Senate’s recent decision to pass AI chip export limits to China involving both Nvidia and AMD introduces a geopolitical dimension that could impact these companies’ global supply chains and market strategies. This regulatory change may necessitate strategic adjustments to maintain competitive advantage and compliance.
Overall, these developments suggest a bullish outlook for AI-focused semiconductor stocks, though geopolitical and regulatory challenges could pose risks. Investors should monitor these factors closely, as they could significantly impact market positions and stock valuations in this rapidly evolving sector.
Technical Analysis
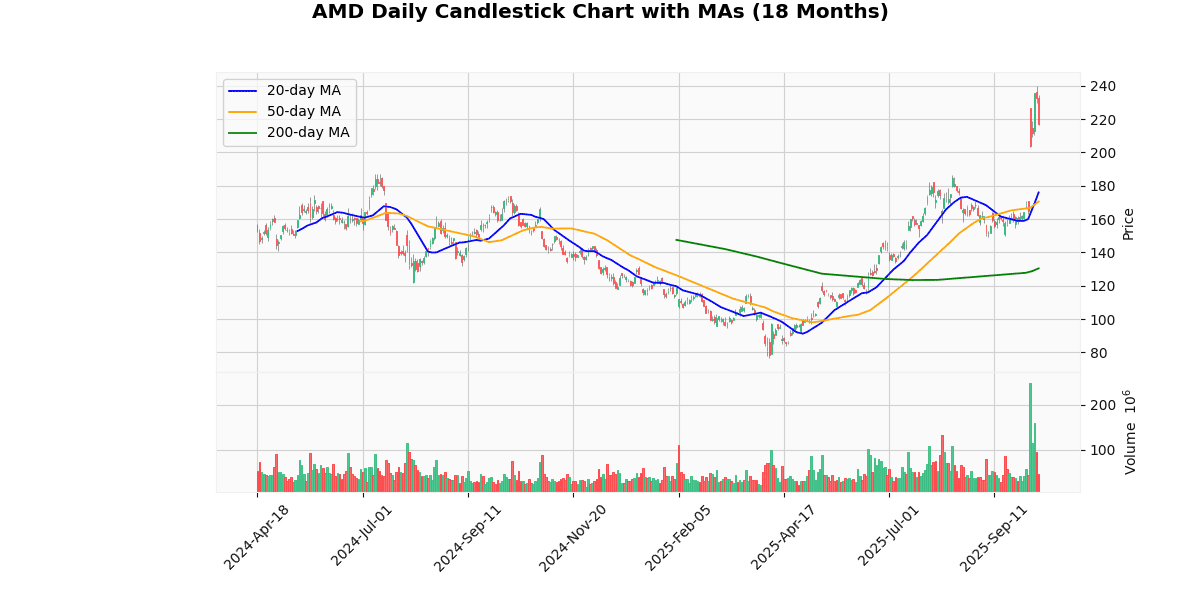
The current price of the asset at $217.38 shows a significant uptrend when compared to its moving averages: 20-day MA at $176.05, 50-day MA at $170.56, and 200-day MA at $130.47. This indicates a robust bullish momentum in the short to medium term, as the current price is well above all key moving averages. The substantial gap between the current price and the 200-day MA highlights a strong upward trend over a longer period. The consistent increase in moving averages, with the 20-day and 50-day MAs also positioned above the 200-day MA, further confirms the bullish market sentiment. Investors might view this as a potential overextension of the market, suggesting a possible reevaluation of entry points, as the asset could be perceived as overbought in the near term.
Recent Ratings
| Date | Status | Outer | Rating | Price |
|---|---|---|---|---|
| 2025-10-08 00:00:00 | Upgrade | DZ Bank | Hold → Buy | $250 |
| 2025-10-07 00:00:00 | Upgrade | Jefferies | Hold → Buy | $300 |
| 2025-09-11 00:00:00 | Downgrade | Erste Group | Buy → Hold | |
| 2025-09-04 00:00:00 | Downgrade | Seaport Research Partners | Buy → Neutral |
Netapp Inc (NTAP) (-5.30%)
Recent News (Last 24 Hours)
NetApp Inc. has experienced a significant surge in its stock price, climbing 46% over the past six months as reported by Zacks on October 10, 2025. This impressive performance prompts investors and analysts to speculate about the future trajectory of the company’s stock. The rise in NetApp’s stock is likely attributed to robust financial performances, strategic acquisitions, and strong demand for cloud-based storage solutions, which have been pivotal in driving revenue growth. Looking ahead, the potential for further growth might hinge on the company’s ability to maintain its competitive edge in the cloud storage market and its response to global economic fluctuations which could impact IT spending. Investors should closely monitor NetApp’s upcoming quarterly earnings reports and any strategic announcements that could influence the stock’s momentum. This sustained increase in stock value could potentially attract more institutional investors and positively affect the company’s market capitalization and shareholder value.
Technical Analysis
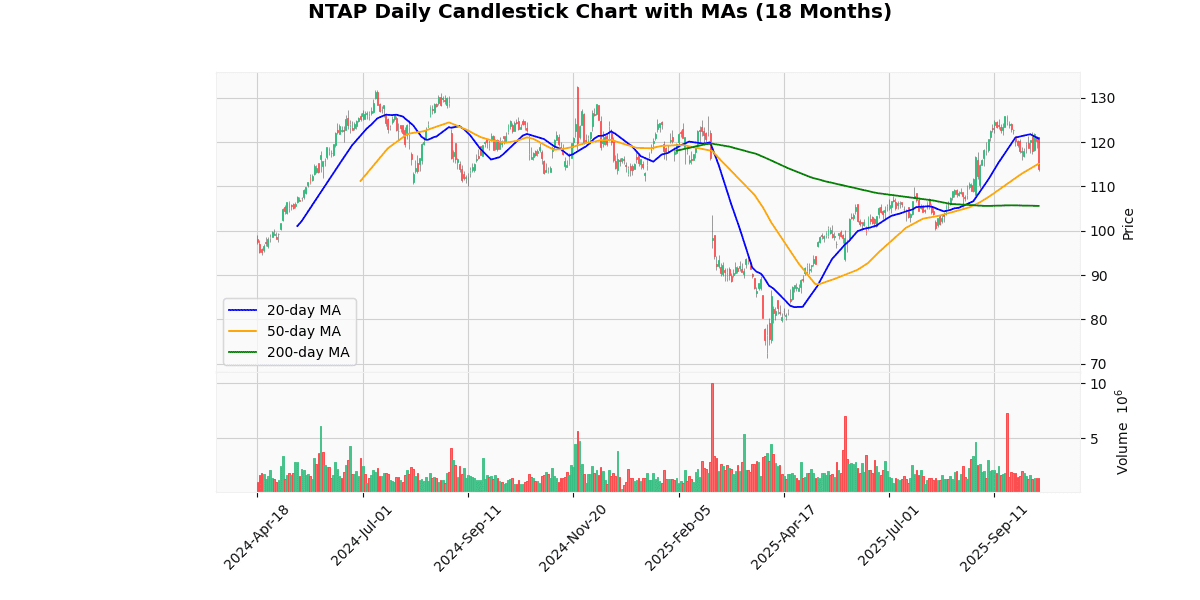
The current price of the asset at $113.72 indicates a recent downtrend, as it is positioned below both the 20-day and 50-day moving averages (MAs), which are $120.81 and $115.13, respectively. This positioning suggests short-term bearish sentiment in the market, as the price has fallen below the levels that traders typically use to gauge medium-term trends. However, the price remains above the 200-day MA of $105.61, indicating that the longer-term trend is still bullish. The gap between the 200-day MA and the current price suggests that despite recent pullbacks, the overall upward momentum from earlier periods could still provide a supportive base for the price. Investors might view dips as buying opportunities, anticipating potential rebounds as the price approaches the 200-day MA.
Recent Ratings
| Date | Status | Outer | Rating | Price |
|---|---|---|---|---|
| 2025-08-21 00:00:00 | Resumed | Morgan Stanley | Equal-Weight | $115 |
| 2025-04-30 00:00:00 | Upgrade | Barclays | Equal Weight → Overweight | $115 |
| 2025-02-28 00:00:00 | Reiterated | TD Cowen | Buy | $160 → $130 |
| 2025-02-19 00:00:00 | Upgrade | BofA Securities | Underperform → Neutral | $121 → $128 |
Teradyne Inc (TER) (-5.19%)
Technical Analysis
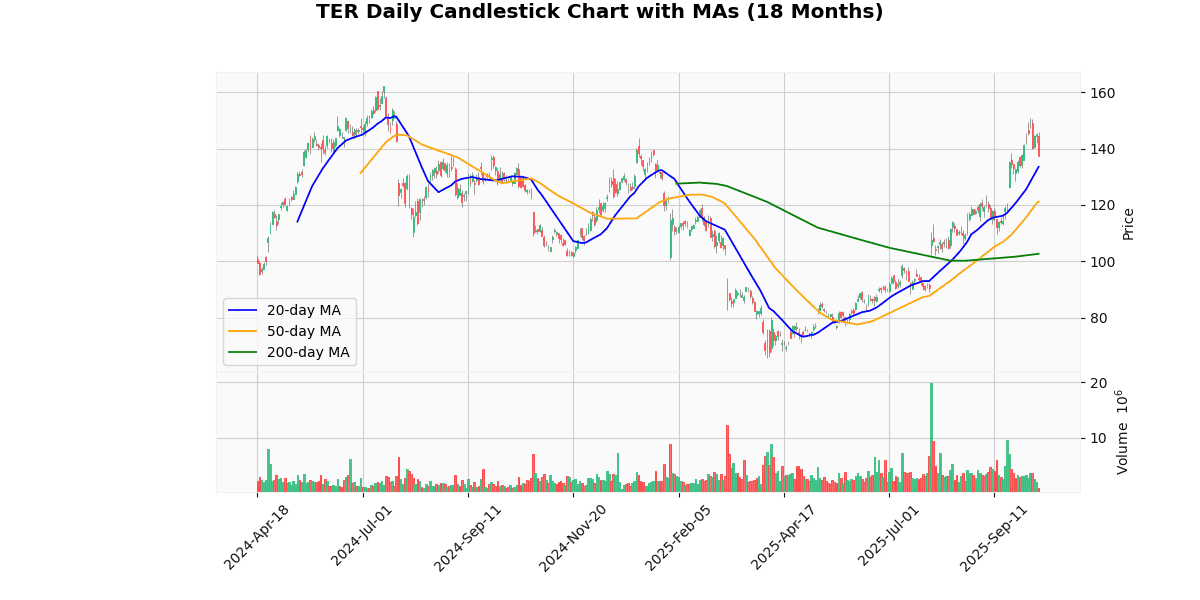
The current price of the asset at $137.48 exhibits a robust upward trend when analyzed against its moving averages (MAs). It is trading well above the 20-day MA of $133.54, the 50-day MA of $121.17, and significantly surpasses the 200-day MA of $102.68. This positioning indicates a strong bullish momentum in the short, medium, and long term. The consistent elevation above all three key MAs suggests that the asset has maintained a solid upward trajectory over an extended period. The substantial gap between the current price and the 200-day MA highlights a possible overextension in the market, which could lead to volatility or price corrections in the near future. Investors should monitor for potential reversion to mean values but also recognize the prevailing positive market sentiment driving current prices.
Recent Ratings
| Date | Status | Outer | Rating | Price |
|---|---|---|---|---|
| 2025-09-22 00:00:00 | Reiterated | Susquehanna | Positive | $133 → $200 |
| 2025-07-31 00:00:00 | Upgrade | Morgan Stanley | Underweight → Equal-Weight | $100 |
| 2025-07-17 00:00:00 | Downgrade | JP Morgan | Overweight → Neutral | $102 |
| 2025-07-10 00:00:00 | Initiated | Goldman | Sell | $80 |
Best Buy Co. Inc (BBY) (-5.12%)
Recent News (Last 24 Hours)
In a recent analysis by TheStreet, dated October 9, 2025, Best Buy and Target are reported to be facing significant struggles. The challenges for these major retailers are attributed to a combination of economic pressures and shifting consumer behaviors. The detailed reasons behind their struggles, which could include factors such as increased competition, changes in consumer spending habits, or operational inefficiencies, were not specified in the summary provided.
From a financial perspective, the struggles of Best Buy and Target could have various implications for their stock performance. Investors might exhibit caution, potentially leading to a decrease in stock prices due to concerns over future profitability and growth prospects. Additionally, if these struggles are indicative of broader sectoral issues, it could also impact other companies within the retail industry. Investors and stakeholders will likely monitor upcoming financial reports and statements from these companies for further insights and confirmation of the underlying issues and their potential resolutions.
Technical Analysis
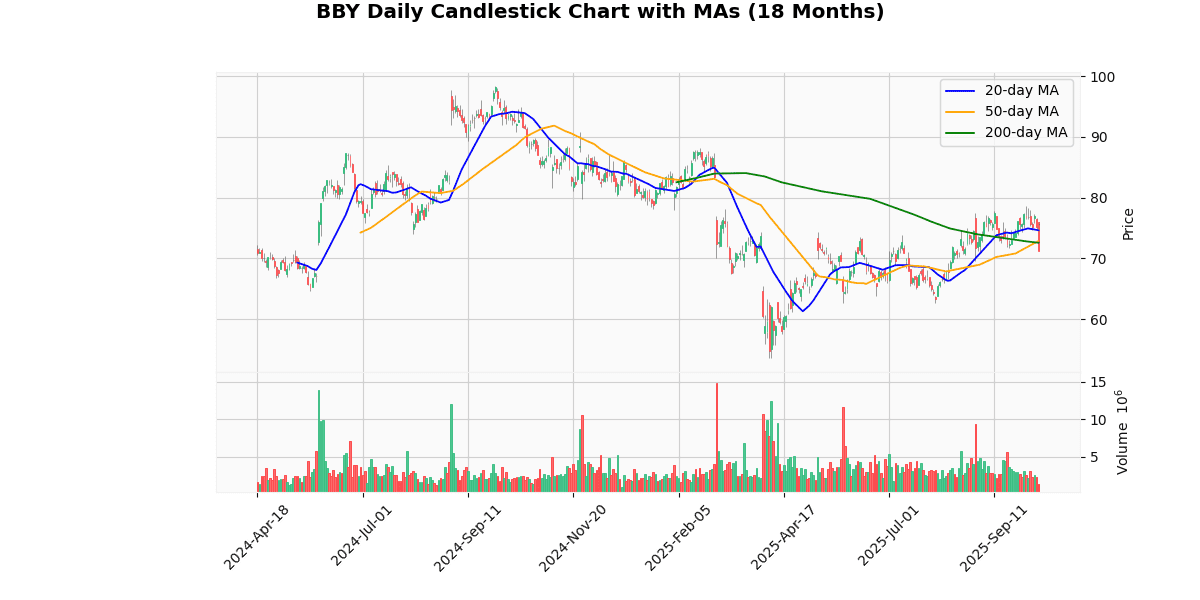
The current price of the asset at $71.23 is trading below all key moving averages: the 20-day MA at $74.62, the 50-day MA at $72.89, and the 200-day MA at $72.58. This positioning indicates a bearish trend in the short to medium term, as the price is consistently below the averages that typically represent support levels. The fact that the 20-day MA is above both the 50-day and 200-day MAs further suggests that there was a recent downturn in price, which could be indicative of increasing bearish momentum. Investors might view this as a potential signal for a continued downward trajectory, warranting a cautious approach. However, for contrarian investors, this could also be seen as a potential buying opportunity if they believe the market will correct upwards towards these moving averages.
Recent Ratings
| Date | Status | Outer | Rating | Price |
|---|---|---|---|---|
| 2025-07-14 00:00:00 | Downgrade | Piper Sandler | Overweight → Neutral | $75 |
| 2025-05-23 00:00:00 | Reiterated | Telsey Advisory Group | Outperform | $100 → $90 |
| 2025-04-03 00:00:00 | Downgrade | Citigroup | Buy → Neutral | $70 |
| 2025-03-05 00:00:00 | Reiterated | Telsey Advisory Group | Outperform | $110 → $100 |
Super Micro Computer Inc (SMCI) (-4.94%)
Technical Analysis
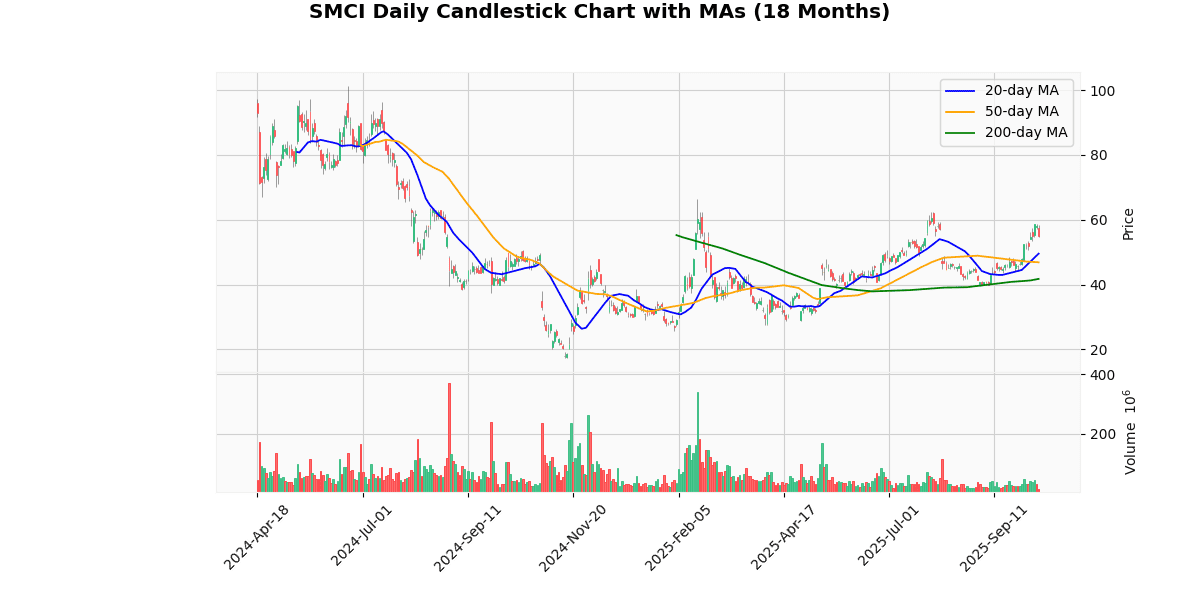
The current price of the asset at $54.67 indicates a robust upward trend when compared to its moving averages: 20-day MA at $49.56, 50-day MA at $46.89, and 200-day MA at $41.77. This pattern suggests a strong bullish momentum, as the current price is significantly above all key moving averages, which are themselves in a positive alignment (each shorter MA above the longer ones). This alignment typically signals continued bullish sentiment in the market. The substantial gap between the current price and the 200-day MA highlights a potential overextension in the short term, which could lead to a price correction. However, the consistent upward trajectory across these periods suggests solid investor confidence and a favorable market positioning for further gains, barring any external shocks or shifts in market fundamentals.
Recent Ratings
| Date | Status | Outer | Rating | Price |
|---|---|---|---|---|
| 2025-09-16 00:00:00 | Initiated | Bernstein | Mkt Perform | $46 |
| 2025-07-09 00:00:00 | Resumed | BofA Securities | Underperform | $35 |
| 2025-06-26 00:00:00 | Initiated | KeyBanc Capital Markets | Sector Weight | |
| 2025-05-07 00:00:00 | Resumed | Needham | Buy | $39 |
Hewlett Packard Enterprise Co (HPE) (-4.82%)
Recent News (Last 24 Hours)
Dell Technologies Inc. has experienced a significant surge in its stock price, climbing 32% over the past month. This remarkable increase prompts investors and analysts to evaluate the sustainability of this growth and consider whether the stock remains a viable buy at its current level. The sharp rise in Dell’s stock could be attributed to various factors including robust quarterly earnings, strategic corporate developments, or market conditions favoring technology stocks. Investors should closely monitor Dell’s upcoming financial reports and any announcements regarding business strategies or market expansion, which could further influence the stock’s performance. Additionally, market sentiment and tech industry trends should also be considered as they play crucial roles in the stock’s future trajectory. This current momentum might attract more investors looking for growth stocks, potentially driving the price up further if the company continues to perform well. However, cautious investors might also consider the risk of a possible correction after such a rapid increase.
Technical Analysis
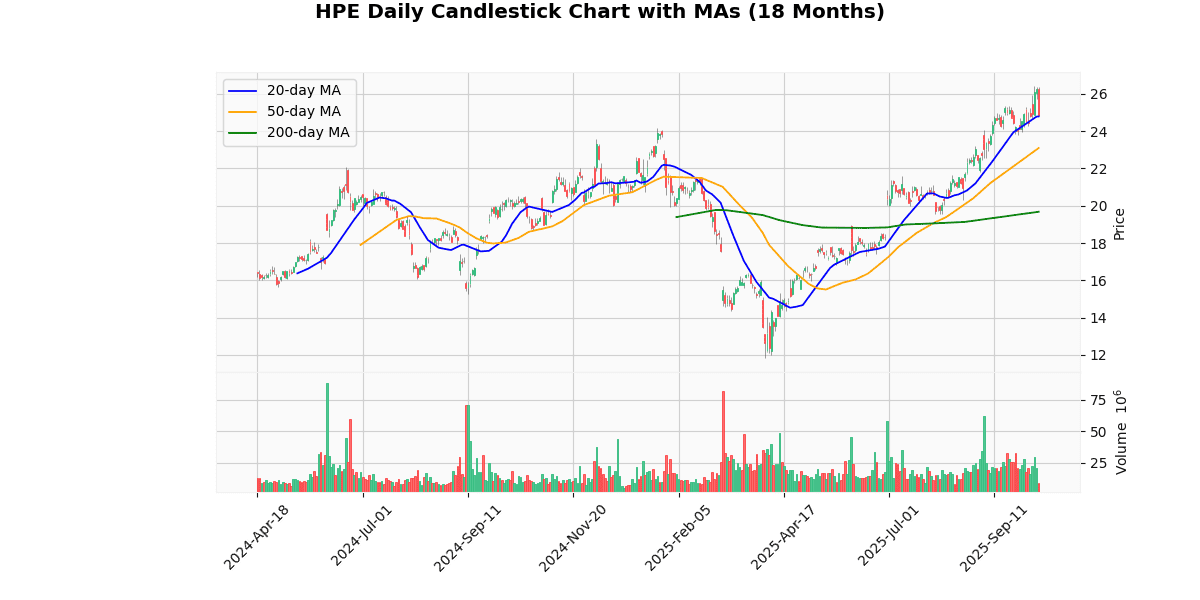
The current price of the asset at $24.83 shows a positive trajectory when analyzed against its moving averages (MA) across different time frames. It is trading slightly above the 20-day MA of $24.79, indicating a short-term bullish sentiment as it surpasses recent average prices. More significantly, the price stands well above the 50-day and 200-day MAs, at $23.09 and $19.68 respectively, suggesting a robust upward trend over the medium and long term. This consistent elevation above all key MAs not only highlights a strong bullish market positioning but also suggests that the asset has sustained buying interest. Investors might view these indicators as a confirmation of ongoing strength in the asset’s market value, potentially guiding further investment decisions towards maintaining or increasing positions in anticipation of continued upward movement.
Recent Ratings
| Date | Status | Outer | Rating | Price |
|---|---|---|---|---|
| 2025-09-16 00:00:00 | Initiated | Bernstein | Mkt Perform | $24 |
| 2025-08-21 00:00:00 | Upgrade | Morgan Stanley | Equal-Weight → Overweight | $28 |
| 2025-07-25 00:00:00 | Resumed | Citigroup | Buy | $25 |
| 2025-07-24 00:00:00 | Resumed | Goldman | Neutral | $22 |
Synopsys Inc (SNPS) (-4.71%)
Recent News (Last 24 Hours)
Synopsys, Inc. (SNPS) has recently received final regulatory approval to proceed with the divestitures of its Optical Solutions Group and Ansys PowerArtist, as reported on October 10, 2025. This strategic move is expected to streamline Synopsys’ operations and focus its resources on core growth areas, potentially enhancing shareholder value. The divestiture could also lead to improved financial metrics by offloading non-core business units and reducing operational complexities.
In related news, on October 9, 2025, Synopsys shares experienced a decline greater than the broader market, as highlighted by Zacks. This drop may concern investors, particularly in light of the company’s recent strategic decisions. The decline in share price could reflect market reactions to immediate uncertainties surrounding the divestitures, despite their long-term strategic benefits.
Investors should monitor how these divestitures impact Synopsys’ financial health and market position, as these changes could influence the company’s stock performance in upcoming quarters.
Technical Analysis
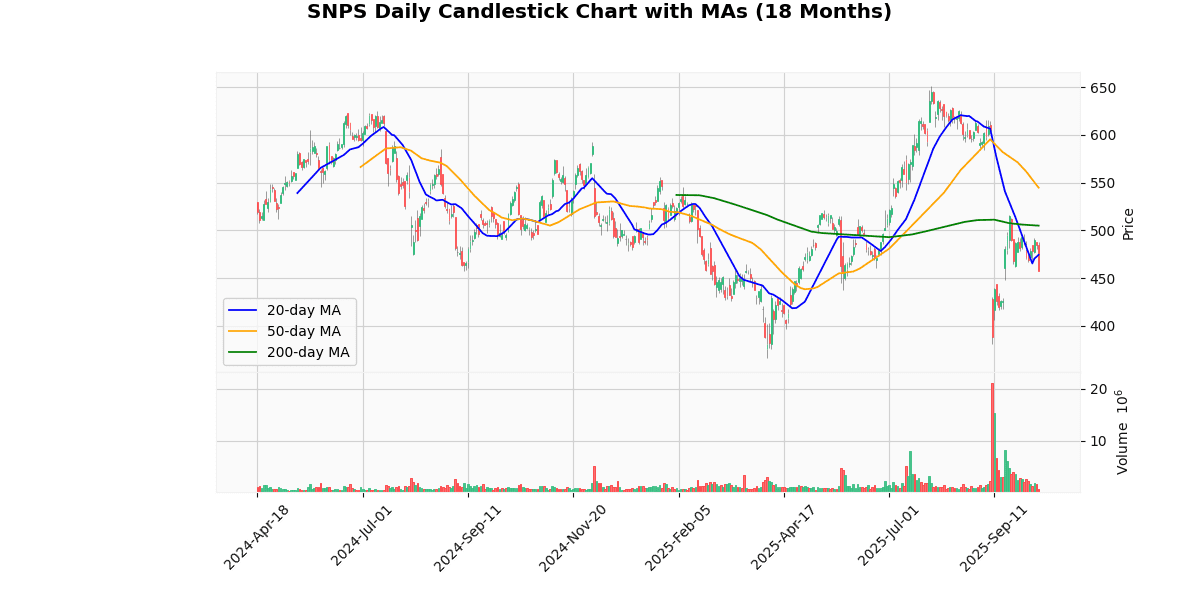
The current price of the asset at $454.5 reflects a bearish trend when analyzed against its moving averages (MAs). It is trading below the 20-day MA of $474.14, the 50-day MA of $544.62, and significantly beneath the 200-day MA of $504.89. This positioning suggests a sustained downward momentum over both short and longer-term periods. The substantial gap between the current price and the 50-day MA indicates a strong bearish sentiment in the market, potentially driven by negative investor outlook or external market pressures. The divergence from the 200-day MA further confirms that the asset is in a longer-term downtrend. Investors might view this as a consolidation phase or a potential entry point if looking for long-term value, but caution is advised given the prevailing negative trends.
Recent Ratings
| Date | Status | Outer | Rating | Price |
|---|---|---|---|---|
| 2025-09-10 00:00:00 | Reiterated | Needham | Buy | $660 → $550 |
| 2025-09-10 00:00:00 | Downgrade | Rosenblatt | Buy → Neutral | $605 |
| 2025-09-10 00:00:00 | Downgrade | Robert W. Baird | Outperform → Neutral | $535 |
| 2025-09-10 00:00:00 | Downgrade | BofA Securities | Buy → Underperform | $525 |
Stanley Black & Decker Inc (SWK) (-4.65%)
Technical Analysis
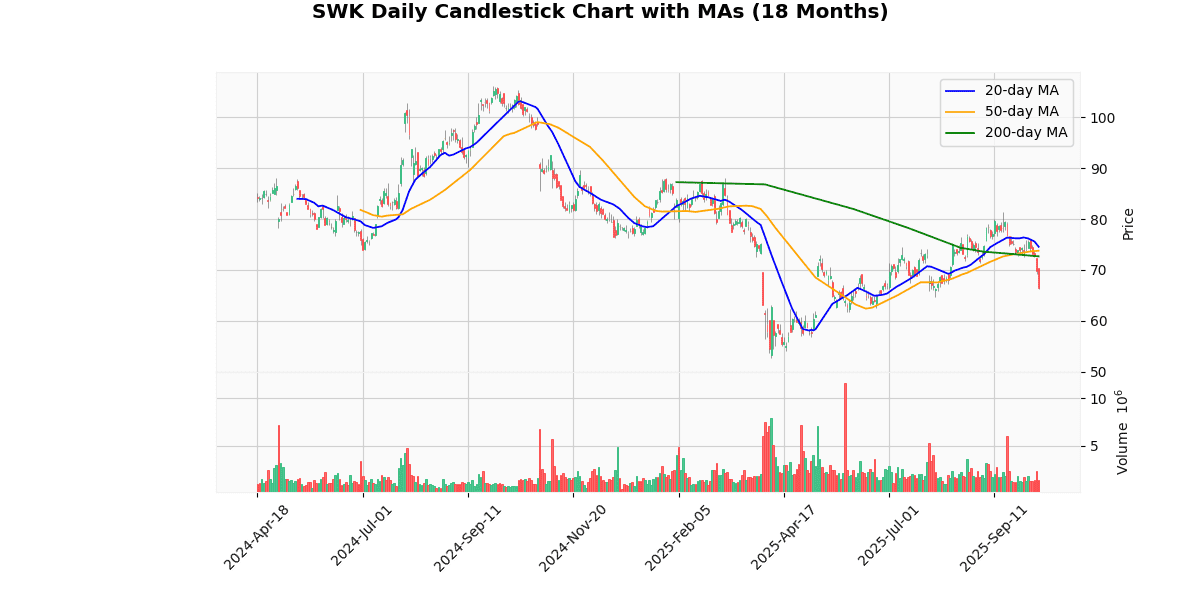
The current price of the asset at $66.28 reflects a significant downtrend when analyzed against its moving averages (MAs). The 20-day MA at $74.54, the 50-day MA at $73.77, and the 200-day MA at $72.66 all sit well above the current price, indicating a bearish momentum in the short, medium, and longer term. This positioning below all key MAs suggests that the asset has been consistently underperforming relative to its historical average prices, and there might be a sustained negative sentiment in the market towards this asset. Investors might view this as a bearish signal, potentially leading to further declines unless a reversal pattern emerges. This trend warrants caution for those holding or considering acquiring the asset, as the market positioning does not yet indicate a recovery phase.
Recent Ratings
| Date | Status | Outer | Rating | Price |
|---|---|---|---|---|
| 2025-07-08 00:00:00 | Upgrade | Wolfe Research | Underperform → Peer Perform | |
| 2025-05-13 00:00:00 | Upgrade | Barclays | Equal Weight → Overweight | $90 |
| 2025-02-19 00:00:00 | Initiated | Jefferies | Buy | $103 |
| 2024-12-19 00:00:00 | Upgrade | Mizuho | Neutral → Outperform | $110 |
Disclaimer
The content on MarketsFN.com is provided for educational and informational purposes only. It does not constitute financial advice, investment recommendations, or trading guidance. All investments involve risks, and past performance does not guarantee future results. You are solely responsible for your investment decisions and should conduct independent research and consult a qualified financial advisor before acting. MarketsFN.com and its authors are not liable for any losses or damages arising from your use of this information.


