US Indices Advance Led by NASDAQ100
DJIA Technical Analysis

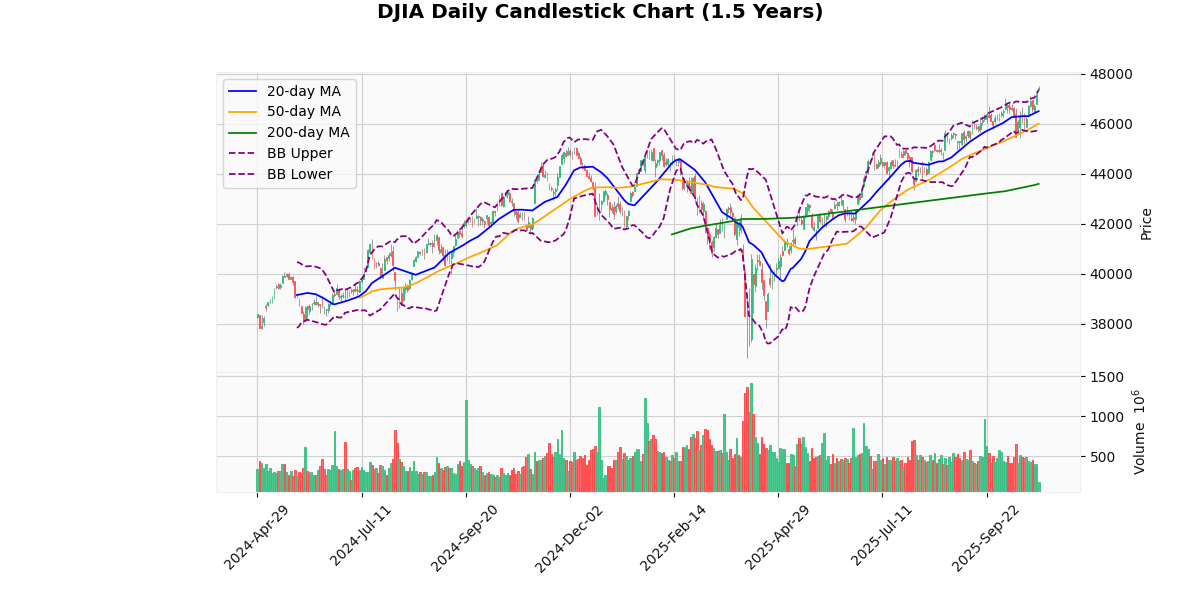
The DJIA currently stands at 47,452.47, marking a 0.52% increase today. The index is exhibiting a bullish trend as evidenced by its position relative to its moving averages: it is trading above the 20-day (46,510.24), 50-day (46,010.29), and significantly above the 200-day (43,599.74) moving averages. This setup indicates sustained upward momentum over the short, medium, and long term.
The Bollinger Bands reveal that the index is trading near the upper band (47,357.47), which typically suggests that the market is relatively high compared to recent prices. This is corroborated by the Relative Strength Index (RSI) at 65.78, approaching the overbought threshold of 70, signaling that the index may be becoming overextended.
The Moving Average Convergence Divergence (MACD) at 291.61 with a signal line at 213.14 shows a bullish crossover, reinforcing the positive momentum indicated by the price above moving averages. This is further supported by the index’s recent performance, having approached its 52-week and year-to-date high at 47,532.3, indicating strong bullish sentiment.
The Average True Range (ATR) of 489.8 suggests moderate volatility, with recent trading ranges confirming this as the index fluctuated between a 3-day high of 47,532.3 and a low of 46,490.06.
In summary, the DJIA is currently exhibiting strong bullish signals, supported by its performance relative to moving averages, Bollinger Bands positioning, and MACD indicators. However, the proximity to the upper Bollinger Band and a high RSI value warrant caution for potential pullbacks or consolidation as the market could be nearing overbought conditions. Investors should watch for any signs of reversal, especially if RSI crosses above 70.
Technical Metrics
| Metric | Value |
|---|---|
| Current Price | 47452.47 |
| Today’s Change (%) | 0.52 |
| 20-day MA | 46510.24 |
| % from 20-day MA | 2.03 |
| 50-day MA | 46010.29 |
| % from 50-day MA | 3.13 |
| 200-day MA | 43599.74 |
| % from 200-day MA | 8.84 |
| Bollinger Upper | 47357.47 |
| % from BB Upper | 0.20 |
| Bollinger Lower | 45663.02 |
| % from BB Lower | 3.92 |
| RSI (14) | 65.78 |
| MACD | 291.61 |
| MACD Signal | 213.14 |
| 3-day High | 47532.30 |
| % from 3-day High | -0.17 |
| 3-day Low | 46490.06 |
| % from 3-day Low | 2.07 |
| 52-week High | 47532.30 |
| % from 52-week High | -0.17 |
| 52-week Low | 36611.78 |
| % from 52-week Low | 29.61 |
| YTD High | 47532.30 |
| % from YTD High | -0.17 |
| YTD Low | 36611.78 |
| % from YTD Low | 29.61 |
| ATR (14) | 489.80 |
The technical outlook for the DJIA shows a bullish trend as the current price of 47,452.47 is positioned above all key moving averages (MA20, MA50, MA200), indicating sustained upward momentum. The index is trading just below its upper Bollinger Band and has recently breached it, suggesting potential overextension in the short term. However, the proximity to the upper band also underscores the strength of the current price level.
The Relative Strength Index (RSI) at 65.78 leans towards the upper end of the neutral range, approaching overbought territory but still offering room for upward movement before extreme levels are reached. The MACD stands at 291.61, above its signal line at 213.14, reinforcing the bullish sentiment as it indicates ongoing positive momentum.
Volatility, as measured by the Average True Range (ATR) of 489.8, remains relatively high, reflecting the significant daily price movements and potential for continued volatility.
Support and resistance levels are crucial, with immediate support likely near the lower Bollinger Band at 45,663.02 and more robust support at the MA200 of 43,599.74. Resistance is currently being tested near the recent 52-week and YTD high of 47,532.3. A break above this level could signal further bullish momentum, while failure to breach could lead to a consolidation or pullback.
Overall, market sentiment appears positive, supported by technical indicators, but traders should remain cautious of potential volatility and resistance near all-time highs.
S&P500 Technical Analysis
The S&P 500 index currently stands at 6858.36, marking a 0.98% increase today. This performance is near its 52-week and year-to-date high of 6860.1, indicating a strong bullish trend. The index’s proximity to these highs, with only a -0.03% difference, suggests potential resistance near this level.
Analyzing the moving averages, the index is above its 20-day (6707.43), 50-day (6603.33), and 200-day (6091.49) moving averages, reflecting a solid uptrend across short, medium, and long-term periods. The percentage differences from these averages are 2.25%, 3.86%, and 12.59% respectively, highlighting sustained bullish momentum.
The Bollinger Bands show the current price nearing the upper band (6831.61), which coupled with a 0.39% difference, might suggest the index is approaching overbought territory. However, the Bollinger Band width, indicated by the difference between the upper and lower bands, remains relatively wide, reducing the likelihood of immediate volatility contraction.
The Relative Strength Index (RSI) at 66.81 is nearing the overbought threshold of 70, which could signal caution among investors about potential price reversals if the index continues to climb without any pullbacks.
The Moving Average Convergence Divergence (MACD) at 47.42 with a signal line at 38.26 indicates a bullish momentum as the MACD line is above the signal line. This is further confirmed by the positive MACD histogram, suggesting continued upward movement.
The Average True Range (ATR) at 70.84 points to a moderately high level of volatility, consistent with the significant movements observed in the index’s recent performance.
In summary, the S&P 500 shows strong bullish signals across several indicators, but caution is advised as it approaches overbought conditions. Investors should watch for potential resistance or reversal signals, particularly if the RSI crosses above 70 or if there are significant pullbacks from the current levels near the 52-week and YTD highs.
Technical Metrics
| Metric | Value |
|---|---|
| Current Price | 6858.36 |
| Today’s Change (%) | 0.98 |
| 20-day MA | 6707.43 |
| % from 20-day MA | 2.25 |
| 50-day MA | 6603.33 |
| % from 50-day MA | 3.86 |
| 200-day MA | 6091.49 |
| % from 200-day MA | 12.59 |
| Bollinger Upper | 6831.61 |
| % from BB Upper | 0.39 |
| Bollinger Lower | 6583.24 |
| % from BB Lower | 4.18 |
| RSI (14) | 66.81 |
| MACD | 47.42 |
| MACD Signal | 38.26 |
| 3-day High | 6860.10 |
| % from 3-day High | -0.03 |
| 3-day Low | 6700.14 |
| % from 3-day Low | 2.36 |
| 52-week High | 6860.10 |
| % from 52-week High | -0.03 |
| 52-week Low | 4835.04 |
| % from 52-week Low | 41.85 |
| YTD High | 6860.10 |
| % from YTD High | -0.03 |
| YTD Low | 4835.04 |
| % from YTD Low | 41.85 |
| ATR (14) | 70.84 |
The technical outlook for the S&P 500 index suggests a strong bullish trend, as evidenced by its current price of 6858.36, which is above all key moving averages (MA20, MA50, and MA200). This positioning indicates sustained upward momentum over the short, medium, and long term. The index is trading just below its upper Bollinger Band and has recently touched a new 52-week and year-to-date high, signaling potential resistance around the 6860.1 level.
The Relative Strength Index (RSI) at 66.81 is nearing the overbought territory but does not yet signal a reversal, suggesting that the bullish sentiment remains robust. The MACD value of 47.42 above its signal line at 38.26 further supports the strength of the current uptrend.
Volatility, as measured by the Average True Range (ATR) of 70.84, remains relatively high, indicating that significant price movements are still possible. Immediate support is likely found near the lower Bollinger Band at 6583.24, with more substantial support at the 20-day moving average of 6707.43.
Overall, the market sentiment appears positive, with the index showing strong upward momentum. Investors should watch for potential resistance at the recent highs and consider the possibility of short-term pullbacks, especially if the RSI moves into overbought territory.
NASDAQ100 Technical Analysis

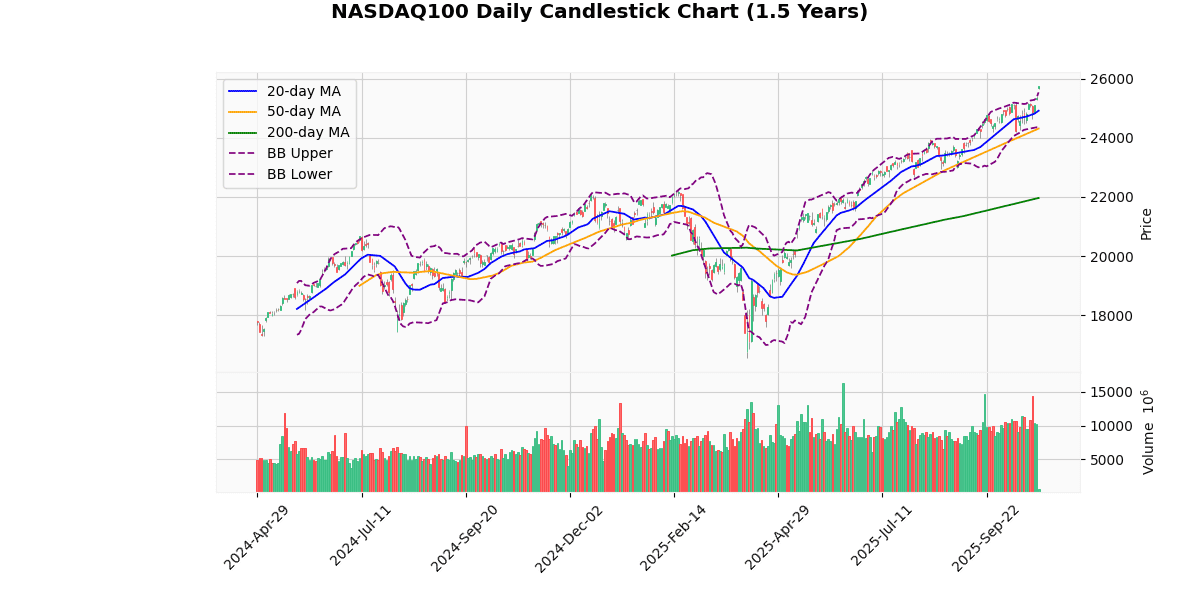
The NASDAQ100 index is currently priced at 25,758.32, marking a 1.58% increase today. This price is just below its 52-week and year-to-date high of 25,765.58, indicating strong recent performance with minimal deviation (-0.03%) from the peak.
The index is trading well above all key moving averages (20-day at 24,917.28, 50-day at 24,313.35, and 200-day at 21,966.19), suggesting a robust upward trend. The percentage differences from these averages (3.38% from MA20, 5.94% from MA50, and 17.26% from MA200) further underscore the bullish momentum.
Bollinger Bands reveal that the current price is above the upper band (25,540.34), typically a signal of overextension in the short term. However, the price is still within close proximity to this band, suggesting that while the market is potentially overbought, it hasn’t moved into extreme territory.
The Relative Strength Index (RSI) at 67.52 is approaching the overbought threshold of 70, which could indicate a potential pullback or stabilization in the near future if the index continues to rise.
The Moving Average Convergence Divergence (MACD) at 274.27 with a signal line at 227.68 shows a bullish crossover, reinforcing the current upward trend. This is supported by the positive divergence between the MACD and its signal line.
The index’s Average True Range (ATR) at 343.07 reflects high volatility, consistent with the significant movements and the recent highs and lows.
In summary, the NASDAQ100 is exhibiting strong bullish signals with its performance above moving averages and Bollinger Bands, coupled with a bullish MACD. However, the proximity to the upper Bollinger Band and a high RSI suggests cautious monitoring for signs of overbought conditions that could precede a short-term pullback.
Technical Metrics
| Metric | Value |
|---|---|
| Current Price | 25758.32 |
| Today’s Change (%) | 1.58 |
| 20-day MA | 24917.28 |
| % from 20-day MA | 3.38 |
| 50-day MA | 24313.35 |
| % from 50-day MA | 5.94 |
| 200-day MA | 21966.19 |
| % from 200-day MA | 17.26 |
| Bollinger Upper | 25540.34 |
| % from BB Upper | 0.85 |
| Bollinger Lower | 24294.22 |
| % from BB Lower | 6.03 |
| RSI (14) | 67.52 |
| MACD | 274.27 |
| MACD Signal | 227.68 |
| 3-day High | 25765.58 |
| % from 3-day High | -0.03 |
| 3-day Low | 24856.34 |
| % from 3-day Low | 3.63 |
| 52-week High | 25765.58 |
| % from 52-week High | -0.03 |
| 52-week Low | 16542.20 |
| % from 52-week Low | 55.71 |
| YTD High | 25765.58 |
| % from YTD High | -0.03 |
| YTD Low | 16542.20 |
| % from YTD Low | 55.71 |
| ATR (14) | 343.07 |
The technical outlook for the NASDAQ100 index presents a bullish trend, as evidenced by its current price of 25758.32, which is above all key moving averages (MA20, MA50, MA200). This indicates a strong upward momentum over short, medium, and long-term periods. The index is trading near its 52-week and year-to-date highs, slightly below the upper Bollinger Band, suggesting some level of overextension but still within a bullish context.
The Relative Strength Index (RSI) at 67.52 is approaching the overbought territory, which could signal caution among traders about potential pullbacks or consolidation in the near term. However, the MACD value at 274.27, above its signal line at 227.68, supports the continuation of the bullish trend.
Volatility, as measured by the Average True Range (ATR) of 343.07, remains elevated, indicating significant daily price movements that could offer trading opportunities but also suggest caution due to potential price swings.
Potential resistance is likely at the recent 52-week high of 25765.58, while support might be found around the lower Bollinger Band at 24294.22 and further down at the MA20 at 24917.28. Market sentiment appears positive, but traders should watch for any signs of reversal or increased volatility that could affect the stability of the current trend.
RUSSELL2000 Technical Analysis

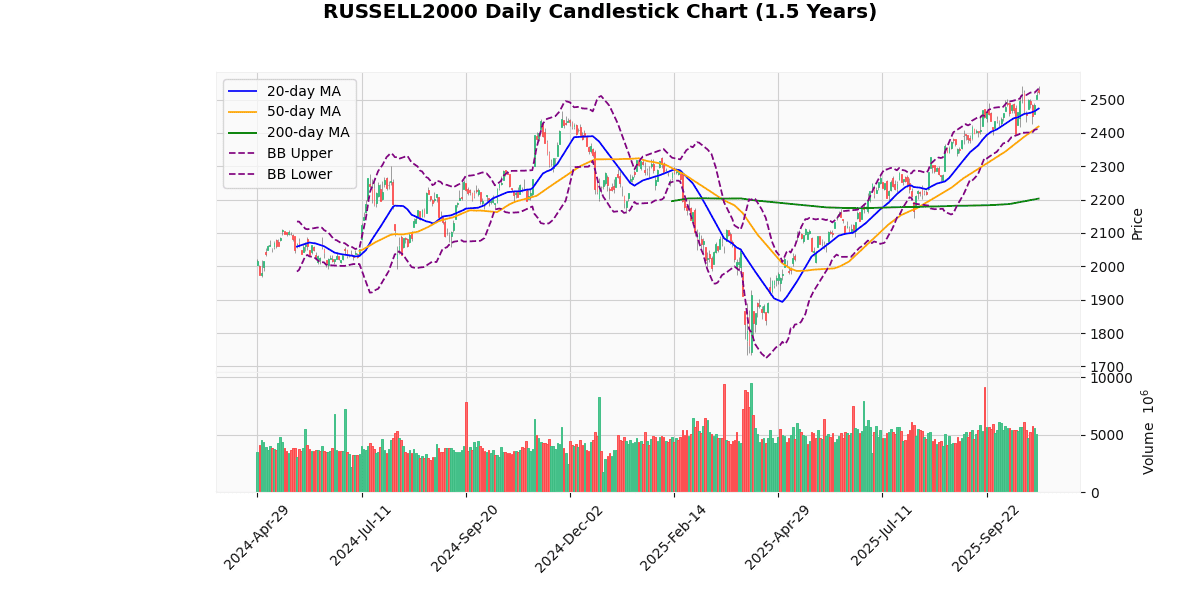
The Russell 2000 index is currently priced at 2521.31, reflecting a modest increase of 0.31% today. This performance is indicative of a bullish trend as evidenced by the index trading above its 20-day (2472.91), 50-day (2419.31), and 200-day (2203.09) moving averages, suggesting sustained upward momentum over short, medium, and long-term periods.
The Bollinger Bands show the index nearing the upper band at 2532.79, which typically suggests a potential resistance level. The proximity to the upper band, coupled with a relatively high RSI of 59.06, indicates that the index might be approaching overbought territory, although it is not yet conclusive as the RSI is below the typical overbought threshold of 70.
The MACD value at 23.39 with a signal line at 23.03 confirms the ongoing bullish momentum, as evidenced by the MACD line being above the signal line. This is further corroborated by the index’s performance relative to its 3-day high of 2539.94 and low of 2457.33, showing resilience and a tendency to push towards recent peaks.
Considering the index’s performance against its 52-week and YTD metrics, it is currently trading very close to its peak levels (52-week and YTD high of 2541.67), indicating strong annual performance but also suggesting caution as it approaches these historical resistance levels.
The Average True Range (ATR) of 42.33 points to a moderately volatile environment, which is typical for an index like the Russell 2000 that includes smaller cap stocks. This volatility suggests that while the upward trend is strong, price swings can be expected, which traders should account for in their risk management strategies.
In summary, the Russell 2000 is exhibiting strong bullish signals across several indicators, but caution is warranted near its current levels due to potential overbought conditions and approaching historical highs. Investors should watch for any signs of reversal or consolidation, particularly if the RSI moves into overbought territory or if the index starts to consistently touch or breach the upper Bollinger Band.
Technical Metrics
| Metric | Value |
|---|---|
| Current Price | 2521.31 |
| Today’s Change (%) | 0.31 |
| 20-day MA | 2472.91 |
| % from 20-day MA | 1.96 |
| 50-day MA | 2419.31 |
| % from 50-day MA | 4.22 |
| 200-day MA | 2203.09 |
| % from 200-day MA | 14.44 |
| Bollinger Upper | 2532.79 |
| % from BB Upper | -0.45 |
| Bollinger Lower | 2413.02 |
| % from BB Lower | 4.49 |
| RSI (14) | 59.06 |
| MACD | 23.39 |
| MACD Signal | 23.03 |
| 3-day High | 2539.94 |
| % from 3-day High | -0.73 |
| 3-day Low | 2457.33 |
| % from 3-day Low | 2.60 |
| 52-week High | 2541.67 |
| % from 52-week High | -0.80 |
| 52-week Low | 1732.99 |
| % from 52-week Low | 45.49 |
| YTD High | 2541.67 |
| % from YTD High | -0.80 |
| YTD Low | 1732.99 |
| % from YTD Low | 45.49 |
| ATR (14) | 42.33 |
The technical outlook for the Russell 2000 index suggests a generally bullish sentiment as indicated by its current price of 2521.31, which is above all key moving averages (20-day, 50-day, and 200-day). The index’s position above these averages highlights a strong upward trend over short, medium, and long-term periods. The proximity of the current price to the upper Bollinger Band, which is at 2532.79, and its recent high near the 52-week and year-to-date highs around 2541.67, signals that the index is testing resistance levels that could define the near-term market direction.
The Relative Strength Index (RSI) at 59.06 suggests the market is neither overbought nor oversold, providing room for potential price movements either way without immediate reversal pressures. The MACD value of 23.39, slightly above its signal line at 23.03, supports the momentum in the bullish direction.
Volatility, as measured by the Average True Range (ATR) of 42.33, indicates moderate daily price movements, which aligns with the current stable yet positive market sentiment.
Potential resistance is observed near the recent highs (2539.94 and 2541.67), while support might be found around the lower Bollinger Band at 2413.02 and further at the 20-day moving average of 2472.91. The index’s performance above these levels could encourage bullish sentiments, whereas a break below could prompt a reassessment of the bullish outlook.


