US Indices Climb; NASDAQ100 Leads Gains
DJIA Technical Analysis

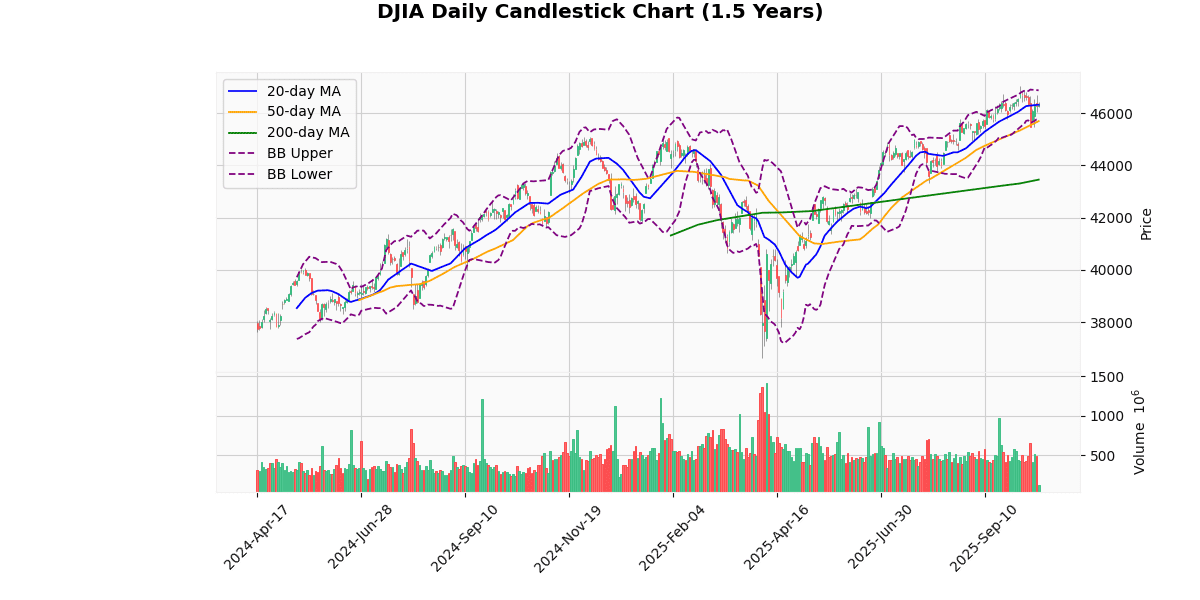
The DJIA currently stands at 46,314.87, reflecting a modest increase of 0.13% today. This performance places the index just slightly below its 20-day moving average (MA20) of 46,319.13, indicating a near-term equilibrium in price levels. The longer-term moving averages, MA50 at 45,688.56 and MA200 at 43,453.08, suggest a bullish trend, as the current price is above both these levels. This is further supported by the percentage differences from these averages, with the index up 1.37% from the MA50 and 6.59% from the MA200.
The Bollinger Bands show the upper and lower limits at 46,870.38 and 45,767.87, respectively, with the index trading close to the middle band (also the MA20). This positioning within the Bollinger Bands indicates a lack of strong volatility in the short term.
The Relative Strength Index (RSI) at 54.02 points to neither overbought nor oversold conditions, suggesting a balanced market sentiment. However, the Moving Average Convergence Divergence (MACD) at 143.23, below its signal line at 215.08, indicates a potential bearish momentum as it signifies a recent crossover.
The index’s proximity to its 3-day high of 46,693.34 and low of 45,452.03, alongside a relatively high Average True Range (ATR) of 484.81, suggests notable intraday volatility. The recent price is also close to its 52-week and year-to-date highs, indicating that the index is testing upper resistance levels.
In summary, while the DJIA shows a stable upward trend over the medium to long term, the recent MACD crossover and proximity to significant highs could suggest potential consolidation or a slight pullback in the near term. Investors should watch for any further MACD developments or a breakout from the Bollinger Bands for clearer directional signals.
Technical Metrics
| Metric | Value |
|---|---|
| Current Price | 46314.87 |
| Today’s Change (%) | 0.13 |
| 20-day MA | 46319.13 |
| % from 20-day MA | -0.01 |
| 50-day MA | 45688.56 |
| % from 50-day MA | 1.37 |
| 200-day MA | 43453.08 |
| % from 200-day MA | 6.59 |
| Bollinger Upper | 46870.38 |
| % from BB Upper | -1.19 |
| Bollinger Lower | 45767.87 |
| % from BB Lower | 1.20 |
| RSI (14) | 54.02 |
| MACD | 143.23 |
| MACD Signal | 215.08 |
| 3-day High | 46693.34 |
| % from 3-day High | -0.81 |
| 3-day Low | 45452.03 |
| % from 3-day Low | 1.90 |
| 52-week High | 47049.64 |
| % from 52-week High | -1.56 |
| 52-week Low | 36611.78 |
| % from 52-week Low | 26.50 |
| YTD High | 47049.64 |
| % from YTD High | -1.56 |
| YTD Low | 36611.78 |
| % from YTD Low | 26.50 |
| ATR (14) | 484.81 |
The technical outlook for the DJIA shows a relatively stable market condition with the current price of 46,314.87 hovering near the 20-day moving average (MA20) of 46,319.13, indicating a balanced short-term sentiment. The index is also well above its 50-day and 200-day moving averages, suggesting a strong medium to long-term upward trend.
The Bollinger Bands indicate a moderate level of volatility, with the current price near the middle band, and the bands themselves not showing significant expansion. This positioning implies that the index is not experiencing extreme volatility, supported by the ATR of 484.81, which, while substantial, is consistent with normal fluctuations for the index.
The RSI at 54.02 points to neither overbought nor oversold conditions, suggesting a lack of strong momentum in either direction. However, the MACD value at 143.23 being below its signal line at 215.08 could indicate a potential slowdown in the bullish momentum or a consolidation phase.
Key support and resistance levels are derived from recent highs and lows. The immediate support can be seen around the recent 3-day low of 45,452.03, while resistance might be tested near the 3-day high of 46,693.34. Further resistance could be anticipated near the 52-week high of 47,049.64.
Overall, the market sentiment appears cautiously optimistic, with the index maintaining a steady position above significant moving averages and no immediate signs of bearish reversals. Investors might look for signs of either a breakout above the recent highs or a pullback if bearish signals strengthen, particularly watching the MACD for shifts in momentum.
S&P500 Technical Analysis

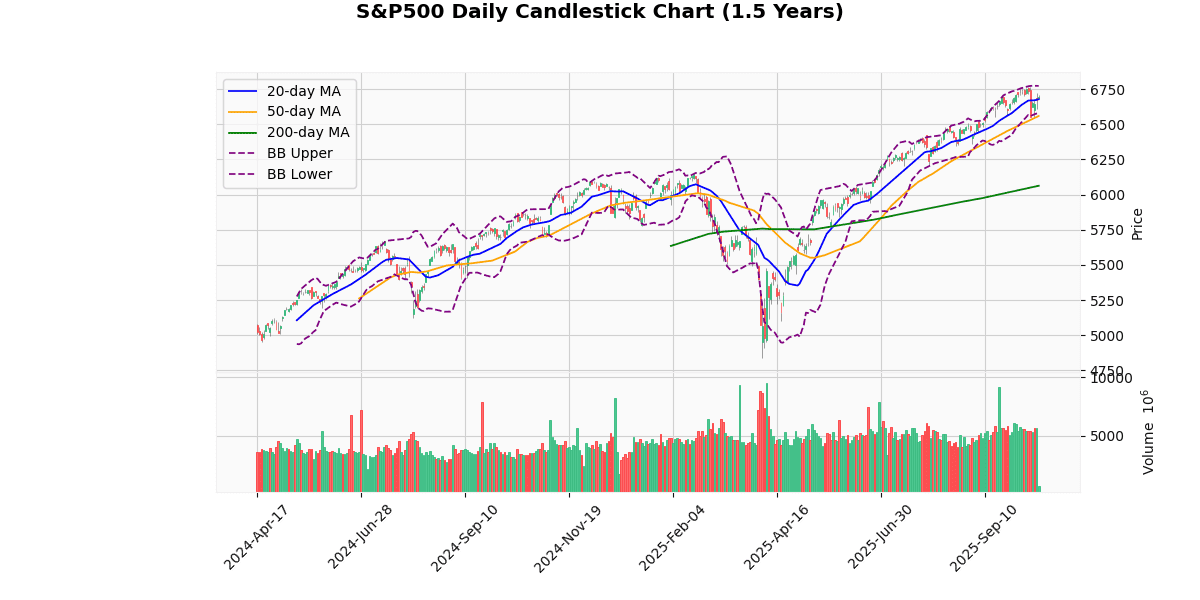
The S&P 500 index is currently priced at 6696.44, marking a modest increase of 0.38% today. This performance places the index above its 20-day moving average (MA20) of 6677.81 and significantly higher than both its 50-day (MA50) at 6558.9 and 200-day (MA200) moving averages at 6062.73. This indicates a strong bullish trend over the short and medium term.
The index is trading near the upper Bollinger Band (6773.06), suggesting that it is approaching overbought territory, although it has not breached this level. The proximity to the upper band, coupled with a Relative Strength Index (RSI) of 56.2, indicates moderate bullish momentum without entering the overbought zone (RSI 70+).
The Moving Average Convergence Divergence (MACD) at 33.15 is currently below its signal line at 45.34, showing a bearish crossover. This could suggest a potential slowdown in the upward momentum or a forthcoming correction, especially if the MACD continues to diverge negatively.
The index’s performance relative to its recent highs and lows shows it is 1.01% below its 52-week and YTD high of 6764.58, yet significantly above the 52-week and YTD low of 4835.04 by 38.5%. This substantial year-to-date improvement highlights strong annual momentum.
The Average True Range (ATR) of 69.06 points to a relatively stable volatility level, consistent with the index’s recent price range and movements.
In summary, the S&P 500 exhibits a robust uptrend with the potential for short-term volatility or correction as suggested by the MACD’s bearish signals. Investors should watch for any further divergence in MACD or significant breaches of Bollinger Bands for stronger directional cues.
Technical Metrics
| Metric | Value |
|---|---|
| Current Price | 6696.44 |
| Today’s Change (%) | 0.38 |
| 20-day MA | 6677.81 |
| % from 20-day MA | 0.28 |
| 50-day MA | 6558.90 |
| % from 50-day MA | 2.10 |
| 200-day MA | 6062.73 |
| % from 200-day MA | 10.45 |
| Bollinger Upper | 6773.06 |
| % from BB Upper | -1.13 |
| Bollinger Lower | 6582.55 |
| % from BB Lower | 1.73 |
| RSI (14) | 56.20 |
| MACD | 33.15 |
| MACD Signal | 45.34 |
| 3-day High | 6724.12 |
| % from 3-day High | -0.41 |
| 3-day Low | 6555.07 |
| % from 3-day Low | 2.16 |
| 52-week High | 6764.58 |
| % from 52-week High | -1.01 |
| 52-week Low | 4835.04 |
| % from 52-week Low | 38.50 |
| YTD High | 6764.58 |
| % from YTD High | -1.01 |
| YTD Low | 4835.04 |
| % from YTD Low | 38.50 |
| ATR (14) | 69.06 |
The S&P 500 index exhibits a bullish trend as evidenced by its current price of 6696.44, which is above all key moving averages (MA20, MA50, MA200), indicating sustained upward momentum over short, medium, and long-term periods. The index’s position relative to its Bollinger Bands, slightly below the upper band and above the middle band, suggests that it is not in an overbought territory, providing room for potential upward movement without immediate reversal pressures.
The Relative Strength Index (RSI) at 56.2 is neutral, pointing neither to overbought nor oversold conditions, supporting a stable market sentiment. However, the Moving Average Convergence Divergence (MACD) below its signal line indicates some bearish undercurrents in the short term, possibly hinting at a consolidation or mild pullback before further gains.
The Average True Range (ATR) of 69.06 reflects moderate volatility, typical for a market that is seeing active but not extreme fluctuations. This level of volatility supports potential trading opportunities within defined ranges.
Key support and resistance levels to watch include the recent 3-day low at 6555.07 and the 3-day high at 6724.12, respectively. A breach above the recent high could see the index testing its 52-week high at 6764.58, while a drop below the support level might lead to a test of the lower Bollinger Band at 6582.55. Overall, the market sentiment appears cautiously optimistic, with technical indicators supporting a continuation of the current trend with watchful monitoring of emerging bearish signals.
NASDAQ100 Technical Analysis

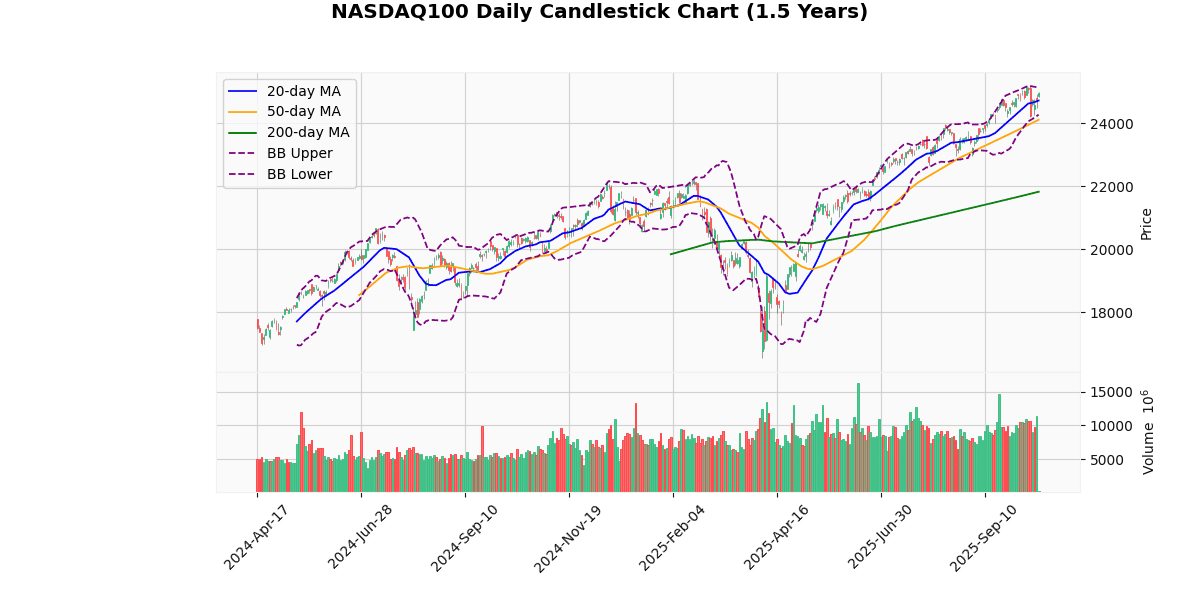
The NASDAQ100 index is currently priced at 24,955.32, marking a modest increase of 0.85% today. This performance places the index above its 20-day (24,722.41) and 50-day (24,110.94) moving averages, suggesting a bullish short-term trend. The significant gap above the 200-day moving average (21,828.91) indicates a strong bullish trend over the longer term.
The Bollinger Bands show the index nearing the upper band (25,170.65), which typically suggests the price is relatively high, potentially approaching overbought territory. However, the current RSI at 58.17 does not yet indicate overbought conditions (typically above 70), leaving some room for upward movement before the market might consider the index overextended.
The MACD (203.99) is currently below its signal line (246.52), indicating a potential bearish reversal or a slowdown in the bullish momentum. This divergence could be a signal for traders to watch for possible short-term pullbacks or consolidation.
The index is trading close to its 3-day high (24,998.3) and has shown resilience by staying well above its 3-day low (24,256.28). The proximity to the 52-week and YTD highs (25,195.28) suggests that the index is testing critical resistance levels. A break above these levels could trigger further bullish momentum.
The Average True Range (ATR) at 328.35 points to a relatively high level of volatility, which is typical for this index given its tech-heavy composition. This volatility indicates that while the upward trend is strong, price swings can be significant, suggesting that investors should be prepared for potential rapid changes in market conditions.
Overall, the NASDAQ100 shows a robust upward trend with potential resistance near the 52-week and YTD highs. The MACD and proximity to the upper Bollinger Band warrant caution for potential short-term pullbacks. Investors should monitor these indicators closely for signs of a directional shift or continuation of the current trend.
Technical Metrics
| Metric | Value |
|---|---|
| Current Price | 24955.32 |
| Today’s Change (%) | 0.85 |
| 20-day MA | 24722.41 |
| % from 20-day MA | 0.94 |
| 50-day MA | 24110.94 |
| % from 50-day MA | 3.50 |
| 200-day MA | 21828.91 |
| % from 200-day MA | 14.32 |
| Bollinger Upper | 25170.65 |
| % from BB Upper | -0.86 |
| Bollinger Lower | 24274.18 |
| % from BB Lower | 2.81 |
| RSI (14) | 58.17 |
| MACD | 203.99 |
| MACD Signal | 246.52 |
| 3-day High | 24998.30 |
| % from 3-day High | -0.17 |
| 3-day Low | 24256.28 |
| % from 3-day Low | 2.88 |
| 52-week High | 25195.28 |
| % from 52-week High | -0.95 |
| 52-week Low | 16542.20 |
| % from 52-week Low | 50.86 |
| YTD High | 25195.28 |
| % from YTD High | -0.95 |
| YTD Low | 16542.20 |
| % from YTD Low | 50.86 |
| ATR (14) | 328.35 |
The NASDAQ100 index is currently showing a bullish trend, as indicated by its position relative to its moving averages. The current price of 24955.32 is above the 20-day (24722.41), 50-day (24110.94), and 200-day (21828.91) moving averages, suggesting a strong upward momentum over both short and long-term periods. The index is also positioned near the upper Bollinger Band (25170.65), which typically signals that it is trading at relatively high levels, though it is not yet in the overbought territory.
The Relative Strength Index (RSI) at 58.17 indicates neither overbought nor oversold conditions, supporting a stable continuation of the current trend. However, the MACD (203.99) being below its signal line (246.52) suggests a potential slowdown in the bullish momentum or a consolidation phase.
The Average True Range (ATR) at 328.35 points to a moderate level of volatility, which is consistent with the index’s recent price movements between its 3-day high and low.
Key support and resistance levels are evident with immediate resistance near the 52-week high of 25195.28 and support around the lower Bollinger Band at 24274.18. The market sentiment appears positive, as indicated by the index’s performance relative to its historical highs and lows, and the positioning above all major moving averages. Investors should watch for any shifts in the MACD and RSI for early signals of changes in the current trend.
RUSSELL2000 Technical Analysis

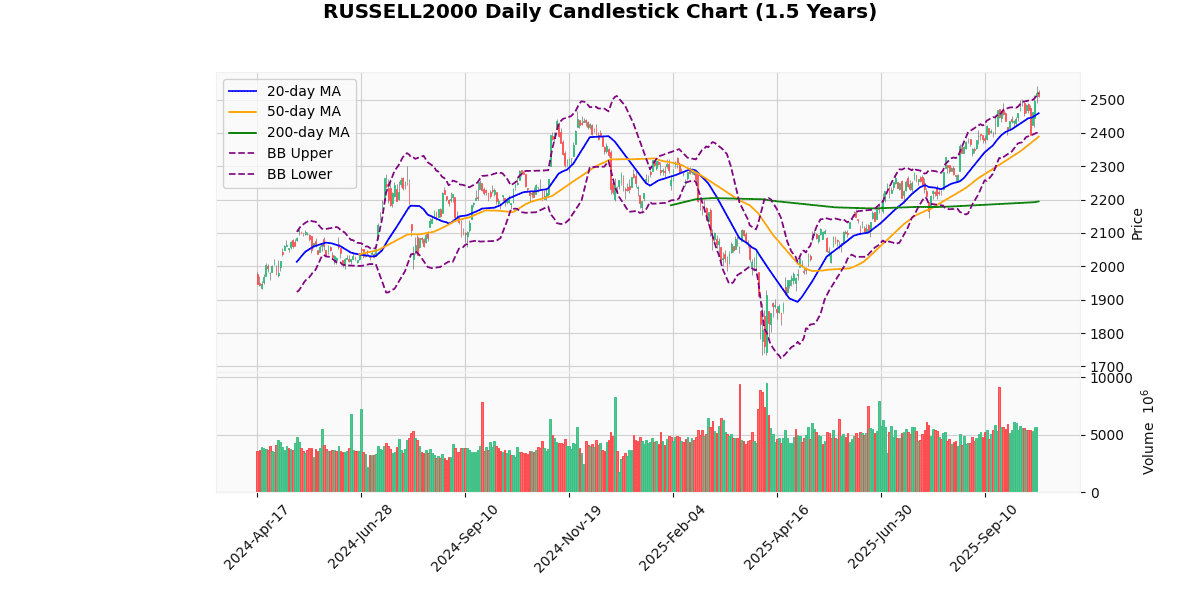
The Russell 2000 Index is currently priced at 2511.53, reflecting a slight decrease of 0.33% today. This movement places it near the upper Bollinger Band (2520.05), suggesting potential resistance or a near-term top. The index is trading above all key moving averages (20-day at 2458.96, 50-day at 2388.95, and 200-day at 2194.84), indicating a strong bullish trend over short, medium, and long-term periods.
The Relative Strength Index (RSI) at 61.25 is slightly above the midpoint but below the typical overbought threshold of 70, suggesting there is still room for upward movement before the index becomes technically overbought. The Moving Average Convergence Divergence (MACD) at 29.13 above its signal line at 27.9 confirms the ongoing bullish momentum, as evidenced by the positive histogram.
The index’s proximity to its 52-week and year-to-date high (2541.67), with only a -1.19% difference, indicates strong recent performance. However, this could also signal caution if the index fails to break past this level, potentially leading to a consolidation or pullback.
The Average True Range (ATR) of 40.83 points to a moderate level of volatility, which is consistent with the index’s recent price range between the 3-day high and low (2541.67 and 2417.74, respectively).
In summary, the Russell 2000 shows robust bullish signals across moving averages and MACD, with an RSI that suggests further potential upside. However, the proximity to the upper Bollinger Band and recent highs calls for careful monitoring for signs of reversal or consolidation. Investors should watch for any significant breaches below key moving averages or changes in the MACD and RSI for early signs of a shift in trend.
Technical Metrics
| Metric | Value |
|---|---|
| Current Price | 2511.53 |
| Today’s Change (%) | -0.33 |
| 20-day MA | 2458.96 |
| % from 20-day MA | 2.14 |
| 50-day MA | 2388.95 |
| % from 50-day MA | 5.13 |
| 200-day MA | 2194.84 |
| % from 200-day MA | 14.43 |
| Bollinger Upper | 2520.05 |
| % from BB Upper | -0.34 |
| Bollinger Lower | 2397.86 |
| % from BB Lower | 4.74 |
| RSI (14) | 61.25 |
| MACD | 29.13 |
| MACD Signal | 27.90 |
| 3-day High | 2541.67 |
| % from 3-day High | -1.19 |
| 3-day Low | 2417.74 |
| % from 3-day Low | 3.88 |
| 52-week High | 2541.67 |
| % from 52-week High | -1.19 |
| 52-week Low | 1732.99 |
| % from 52-week Low | 44.92 |
| YTD High | 2541.67 |
| % from YTD High | -1.19 |
| YTD Low | 1732.99 |
| % from YTD Low | 44.92 |
| ATR (14) | 40.83 |
The technical outlook for the Russell 2000 index suggests a generally bullish trend, as indicated by its current price of 2511.53, which is above all key moving averages (MA20 at 2458.96, MA50 at 2388.95, and MA200 at 2194.84). This positioning above the moving averages highlights a strong upward momentum over short, medium, and long-term periods.
The index is trading near the upper Bollinger Band (2520.05), suggesting that it is at the higher end of its current trading range, but not excessively so, as it is only slightly below this upper limit. The Relative Strength Index (RSI) at 61.25 points to a somewhat overbought condition but not extremely so, indicating continued buyer interest. The MACD value at 29.13 above its signal line at 27.9 further supports the bullish momentum.
Volatility, as measured by the Average True Range (ATR) of 40.83, suggests moderate price fluctuations, which is typical for an index like the Russell 2000.
Key support and resistance levels to watch would be the recent 3-day low at 2417.74 and the 52-week high at 2541.67, respectively. The index’s performance near these levels could indicate potential reversals or continuation of the current trend. Overall market sentiment appears positive, supported by technical indicators, but investors should remain cautious of potential volatility and shifts in momentum.


