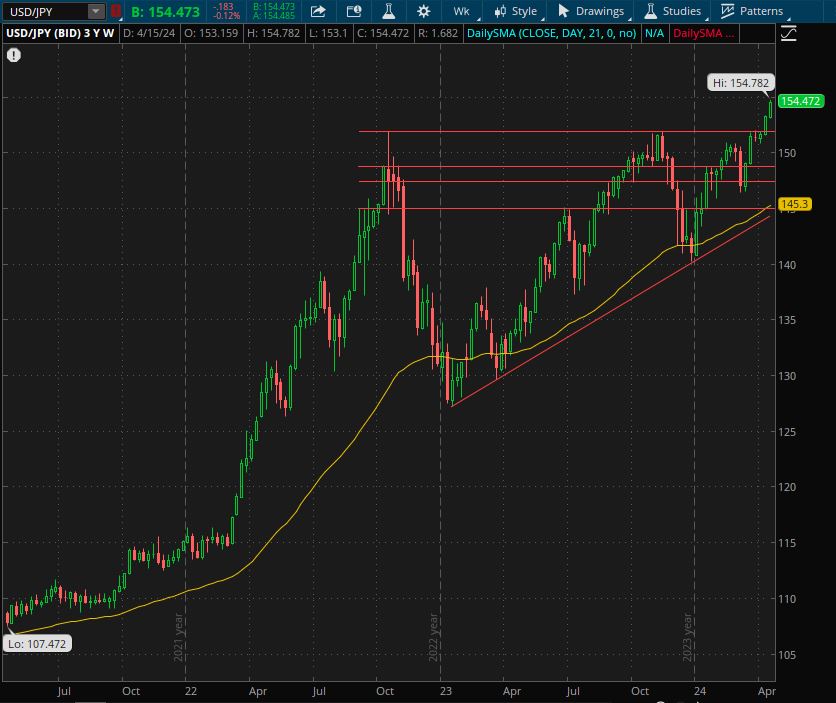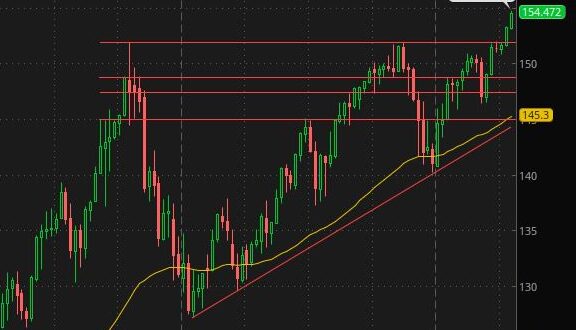
This image displays a weekly candlestick chart for the USD/JPY currency pair. The chart shows price up for the second consecutive week after the breakout of the multiyear double top, which initially gave the impression to resist after a triple top was information but later developed in a hook which led the way to the bullish leg. Next possible resistance area 155 and 160. In case of weakness of the rate below 151.90 possible tests of 146.5. Below 145 there will be a review of the long term positive technical framework.
Bank of Japan actions expectations and macro framework would play a decisive role.
In March, Japan experienced a deceleration in its core inflation rate, and a key index that measures wider price movements dropped below 3% for the first time in more than a year, according to recent data released on Friday. Analysts have mentioned that the diminishing strength of the yen might pose challenges to the Bank of Japan’s policy discussions. The market will be looking closely for any hawkish indications from the BOJ that could signal an attempt to curb the yen’s decline ahead of the predicted timeline of rate hikes, which should be in October.
Trend followers appeased by carry trade and Yen weakness would thus be in alert for any possible structural weakness of the multiyear bullish trend.


