The rate is trading above its most relevant daily moving averages at 143.83, up by 0.08%.
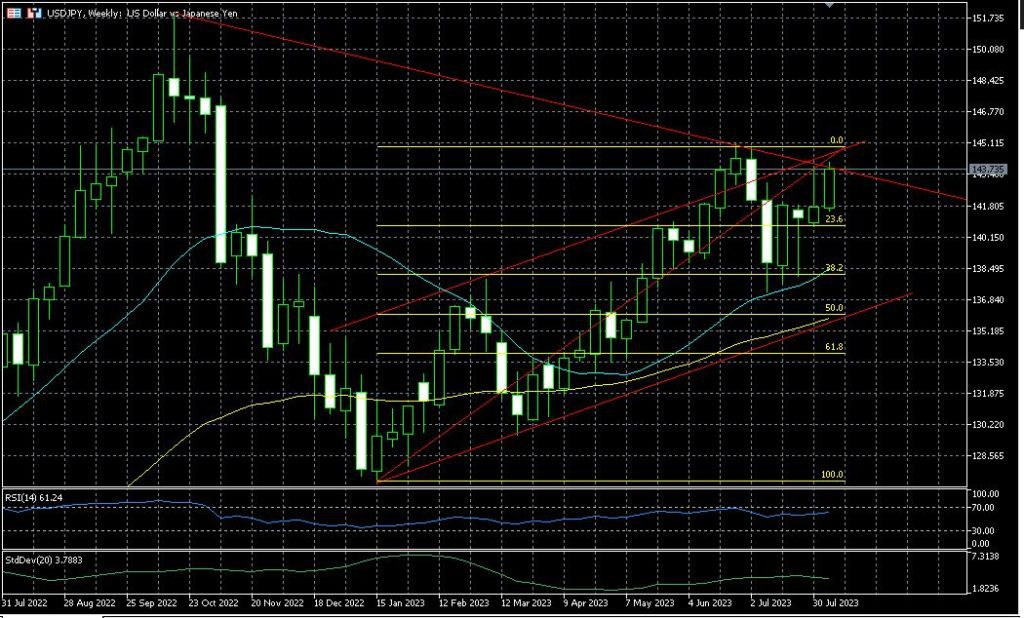
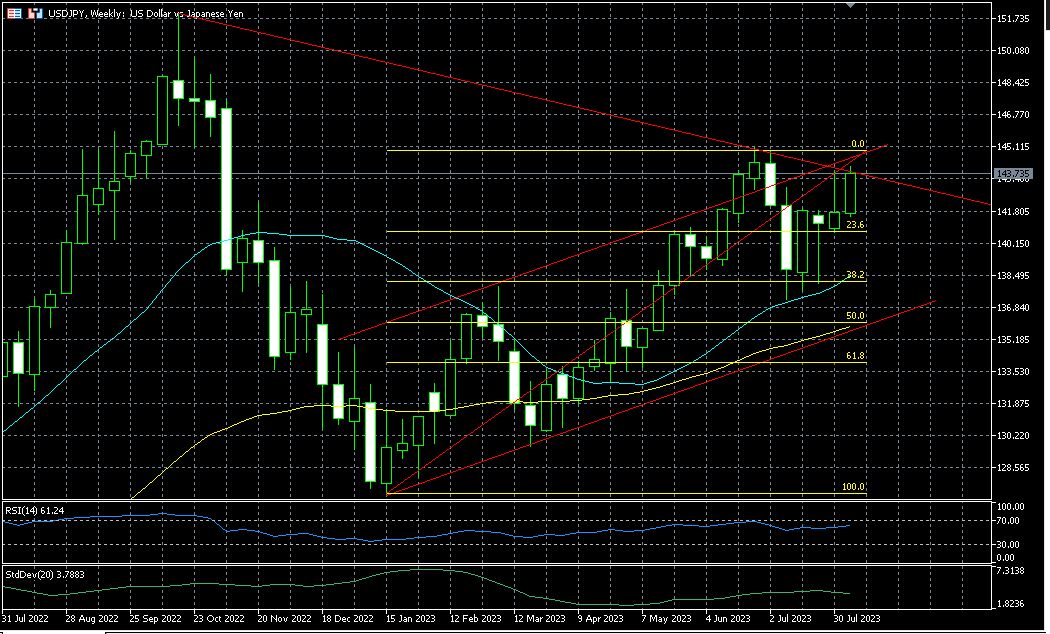
USD/JPY 2023 high is at 145.13, meaning the rate will need to increase by only 0.9% to make this test. Long term framework is currently in a very interesting position because the pair is testing on the weekly chart the supply line that links lower highs, that was generated from last year multiyear top at 151.94.
From a short term perspective, the 2023 top static resistance would be either the beginning of a trading range in case bearish forces would win or a spring to lift the rate in case of a breakout.
On a longer time horizon however, an end of week or end of month (better) breakout of the supply line would be a better compass to evaluate the development of trading momentum.
In these situations, aggressive trading is penalized due to the frequency of fake breakouts.


