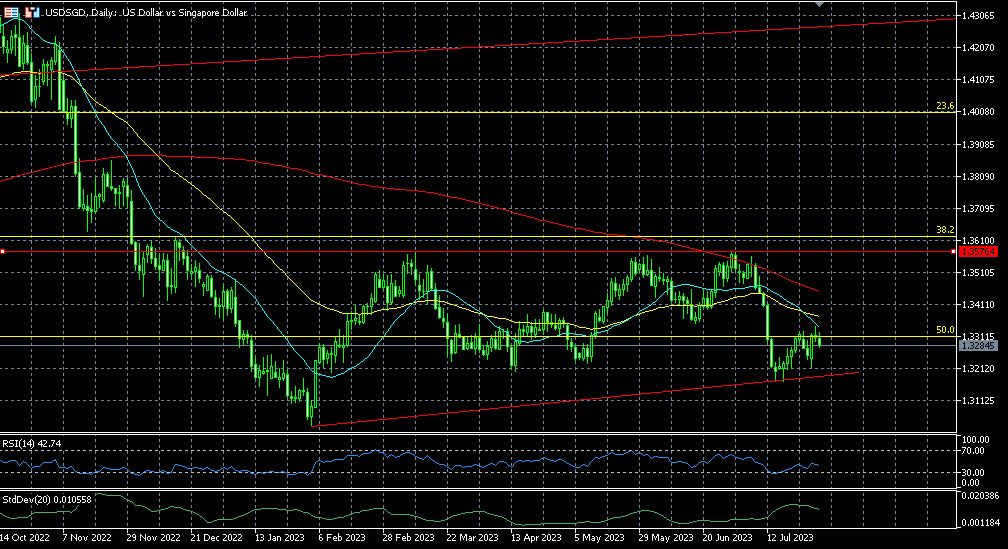
The pair, which is trading at 1.3278, down 0.23%, found resistence against both the 21 day SMA and 55 day EMA. It is moving closer to the trendline that links higher lows generated last February.
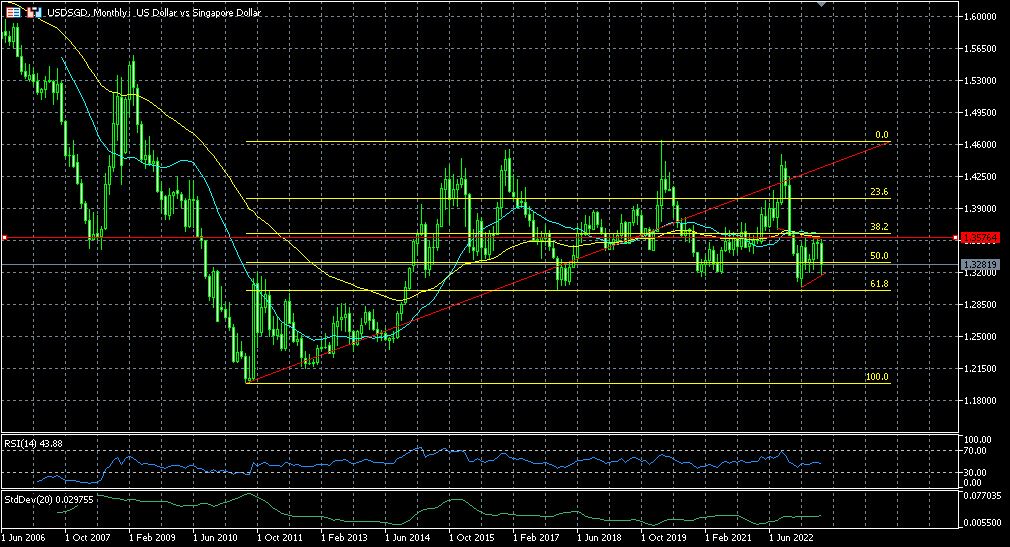
Below this dynamic level the pair could test 1.3, and in case prices would trade below this support bearish forces would bring likely to test USD/SGD to 1.285, the 61.8% Fibonacci retracement of the uptrend 2011-2015 and then 1.25.
If the intermediate dynamic support will bring buying pressure, the pair could test 1.34 and then 1.358. A breakout above its 2023 high 1.3576 will probably trigger a breakout wave with 1.38 as a likely key resistance.


