# Vera Bradley Inc. (VRA) Post Earning Analysis
Vera Bradley, Inc., founded in 1982 by Barbara Bradley Baekgaard and Patricia R. Miller, specializes in designing and selling women’s handbags, luggage, and fashion accessories. The company operates through three segments: Vera Bradley Direct, which sells products through various retail channels; Vera Bradley Indirect, which distributes to retailers and through licensing; and Pura Vida, focusing on wholesale distribution. Headquartered in Roanoke, Indiana, Vera Bradley is known for its colorful patterns and functional designs.
Since there are no recent news updates available, it’s important to consider the potential implications for the stock in question. Typically, a lack of fresh news can mean several things for a stock. If the company has been experiencing stable performance and there are no new updates, this might suggest a period of stability without significant volatility, which could reassure investors looking for steady returns. However, in dynamic sectors such as technology or biotech, a lack of news might raise concerns about stagnation or a lack of innovation, potentially making the stock less attractive to growth-oriented investors. Additionally, in a highly competitive industry, no news might imply that the company is losing ground to competitors who are more actively engaging in new initiatives or announcements. Investors should keep an eye on the broader industry trends and any upcoming events that might affect the company’s stock, such as earnings reports or sector-specific developments.
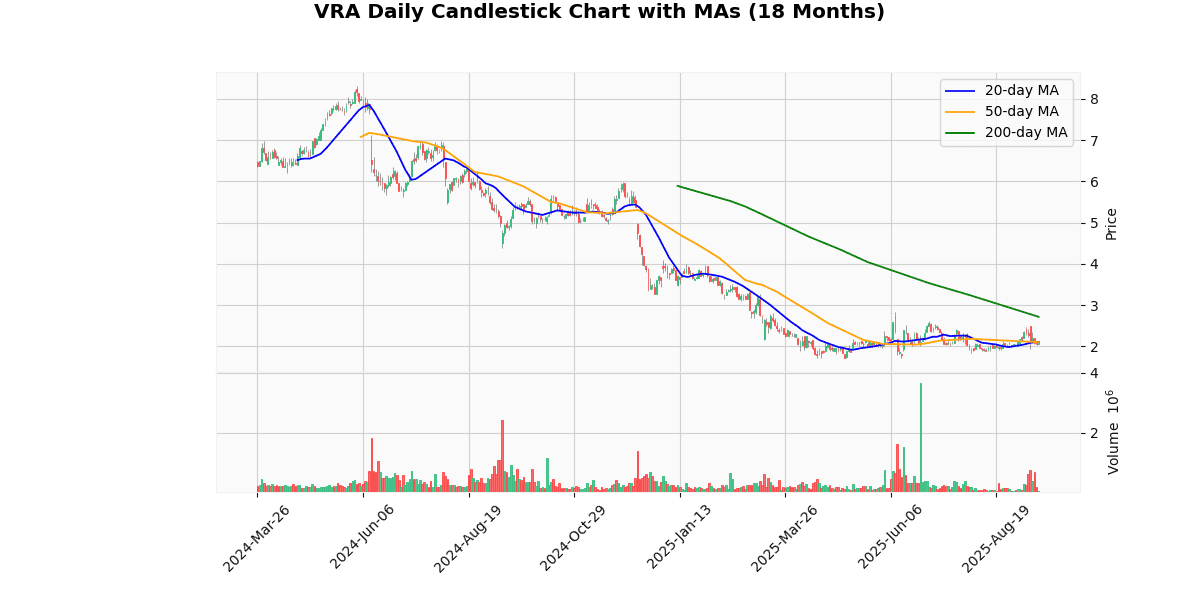
The current price of the asset is $2.09, marking a 0.97% increase today. This price is significantly below the 52-week high of $5.99 and the year-to-date high of $4.00, indicating a substantial decline of 65.11% and 47.75% respectively from these peaks. However, it has recovered 22.22% from both the 52-week and year-to-date lows of $1.71, suggesting some recent upward movement.
The asset is trading below all major moving averages: 0.99% below the 20-day MA, 0.58% below the 50-day MA, and notably 23.08% below the 200-day MA, highlighting a long-term downward trend. The week’s trading range was between $2.03 and $2.20, with the current price closer to the upper end, showing some short-term resilience.
The RSI at 48.63 indicates a neutral momentum, neither overbought nor oversold. The MACD value of 0.02 suggests minimal bullish momentum. Overall, while there has been some recovery from the lowest points of the year, the long-term trend remains bearish, and the asset’s price struggles to regain higher levels.
## Price Chart

## Earnings Trend Table
| Date | Estimate EPS | Reported EPS | Surprise % | |
|---|---|---|---|---|
| 0 | 2025-09-11 | -0.15 | -0.02 | -86.67 |
| 1 | 2025-06-11 | -0.12 | -0.36 | -200.00 |
| 2 | 2025-03-12 | 0.07 | -0.30 | -561.54 |
| 3 | 2024-12-11 | 0.06 | -0.27 | -550.00 |
| 4 | 2024-09-11 | 0.17 | 0.13 | -21.21 |
| 5 | 2024-03-13 | 0.14 | 0.11 | -24.14 |
| 6 | 2023-12-06 | 0.09 | 0.19 | 111.11 |
| 7 | 2023-08-30 | 0.12 | 0.33 | 175.00 |
Analyzing the EPS trends over the last eight quarters reveals significant fluctuations in both the reported EPS and its deviation from estimates. Initially, there was a positive surprise trend, as evidenced in the last two entries from 2023, where the reported EPS significantly exceeded estimates, with surprise percentages of 175.00% and 111.11% respectively. This trend suggests a period of strong financial performance exceeding analyst expectations.
However, starting from the second quarter of 2024, a shift in performance is noticeable. In March and September 2024, the company still managed to report EPS close to or slightly below estimates but with a negative surprise percentage, indicating a tightening gap between expected and actual earnings.
The most concerning trend emerges in the last three quarters of 2025, where the reported EPS not only falls below the estimates but does so with a substantial negative surprise, reaching as low as -561.54% in March 2025. This period marks a significant downturn, with the company not only failing to meet expectations but also reporting negative earnings, a stark contrast to the positive surprises seen in late 2023.
This volatility suggests potential instability in the company’s earnings capability or possible external factors impacting its financial outcomes more severely than anticipated. This pattern warrants close monitoring to understand whether this is a short-term challenge or indicative of a longer-term financial issue.


