**Week of October 03 – October 10, 2025**
## Weekly Market Overview
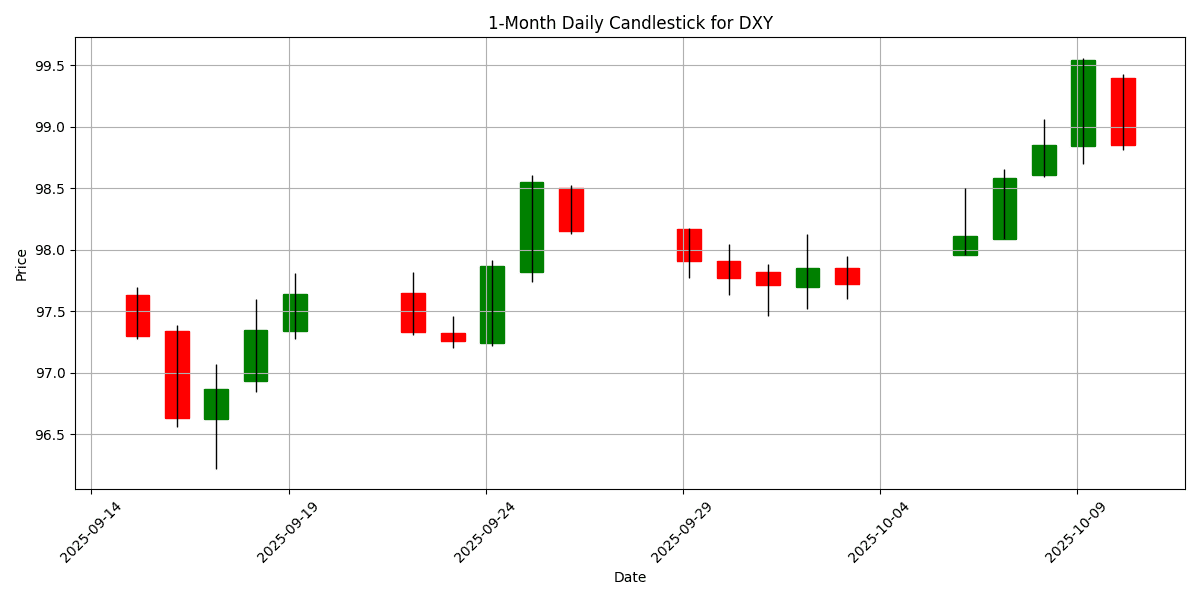
During the week of October 3 to October 10, 2025, the forex market experienced notable fluctuations driven by a combination of economic data releases, central bank insights, and geopolitical tensions. The U.S. Dollar Index (DXY) closed at 99.54, marking a weekly increase of 1.7271%, reflecting a strong performance amid mixed economic signals.
On October 3, a series of economic indicators were released, providing mixed insights into the health of various economies. In the Eurozone, Spain and Italy’s services PMIs outperformed expectations, registering at 54.3 and 52.5, respectively, suggesting resilience in those economies. However, France’s services PMI fell short of forecasts at 48.5, indicating contraction, while Germany’s PMI also disappointed at 51.5, leading to concerns about the overall Eurozone economic outlook. The composite PMI for the Eurozone matched expectations at 51.2, but the mixed results contributed to a cautious sentiment around the euro.
In the U.S., the S&P Global Services PMI of 54.2 exceeded forecasts, while the ISM Non-Manufacturing PMI surprised investors by falling to 50.0, signaling stagnation in the services sector. This divergence fueled speculation regarding the Federal Reserve’s future policy moves, particularly ahead of their upcoming meetings. As a result, the dollar gained traction against major currencies, including the euro and pound.
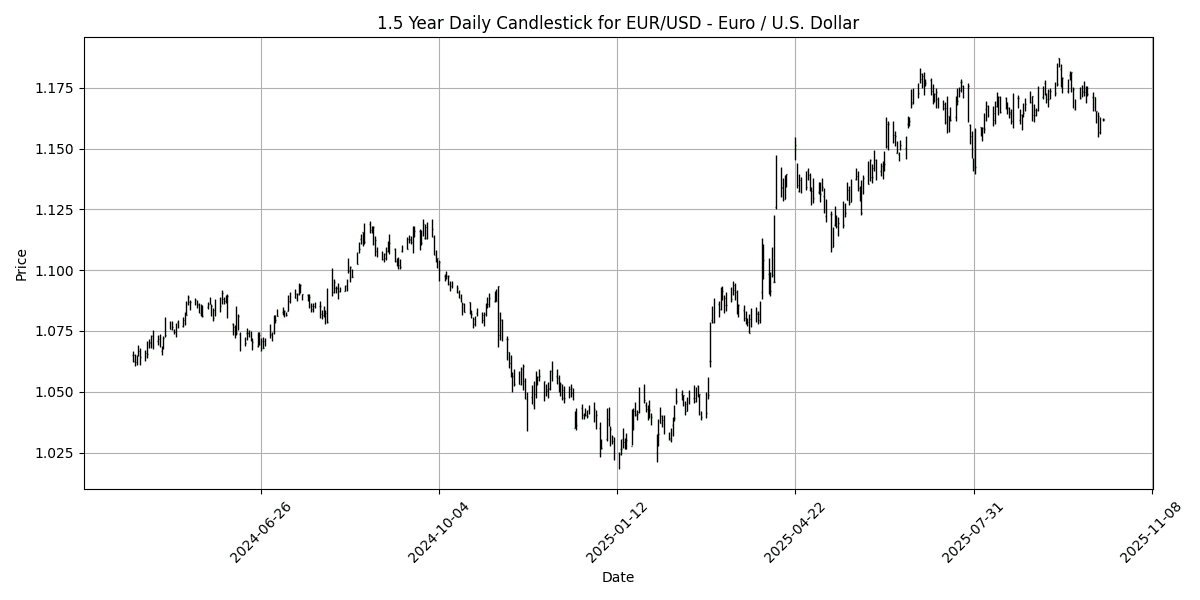
Central bank communications added another layer of complexity. ECB President Christine Lagarde’s comments hinted at a cautious approach to monetary policy, while Fed officials suggested a wait-and-see stance, maintaining the dollar’s strength. The contrasting economic conditions across the Atlantic resulted in the euro losing ground against the dollar, with the EUR/USD pair trading lower throughout the week.
Geopolitical developments also played a significant role in market dynamics. Tensions escalated as President Trump’s announcement of potential tariffs on Chinese imports in response to rare earth export controls rattled investor sentiment. The immediate fallout saw U.S. stocks tumble, erasing $2 trillion in value, which reverberated through global markets, contributing to a risk-off atmosphere.
As the week concluded, the market sentiment shifted, with traders closely monitoring the evolving geopolitical landscape and its implications for economic policies. The dollar emerged as a clear winner, bolstered by safe-haven demand amid uncertainty, while the euro and pound struggled under the weight of disappointing economic data and geopolitical tensions. Overall, the week underscored the intricate interplay of economic indicators, central bank guidance, and global events shaping currency movements in the forex market.
## Major FX Group
| Name | Symbol | Price | Weekly (%) | YTD (%) | MA50 | MA100 | MA200 | RSI | MACD |
|---|---|---|---|---|---|---|---|---|---|
| EUR/USD – Euro / U.S. Dollar | EURUSD | 1.1566 | -1.3561 | 11.15 | 1.1693 | 1.1638 | 1.1214 | 29.72 | -0.0022 |
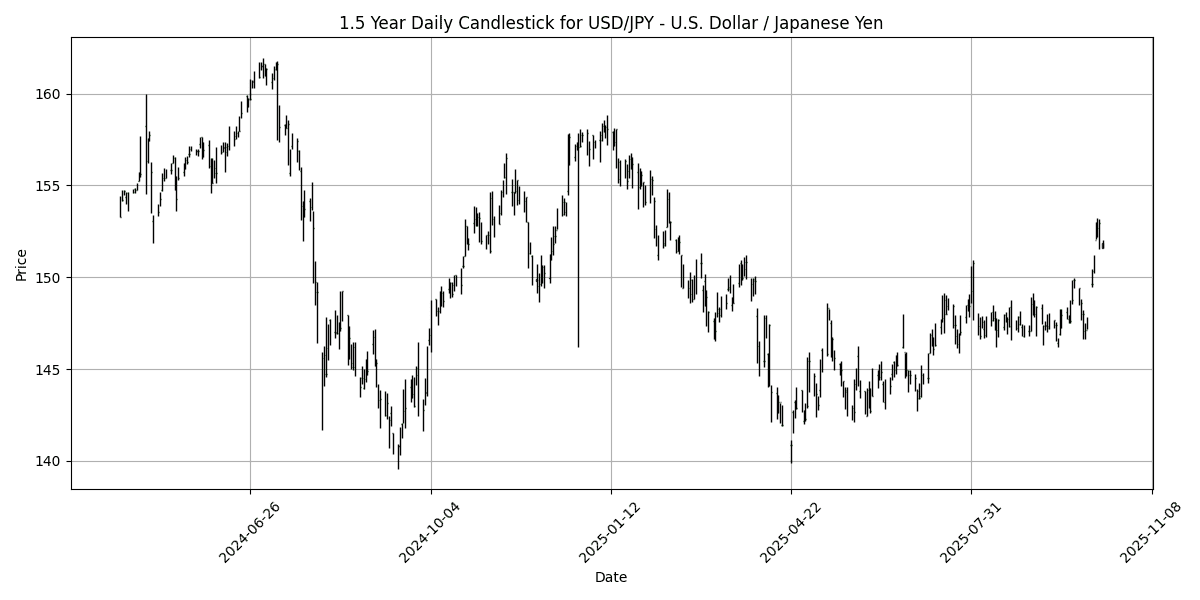
| USD/JPY – U.S. Dollar / Japanese Yen | USDJPY | 152.97 | 3.9517 | -2.5670 | 148.14 | 146.90 | 148.24 | 67.04 | 1.1370 |
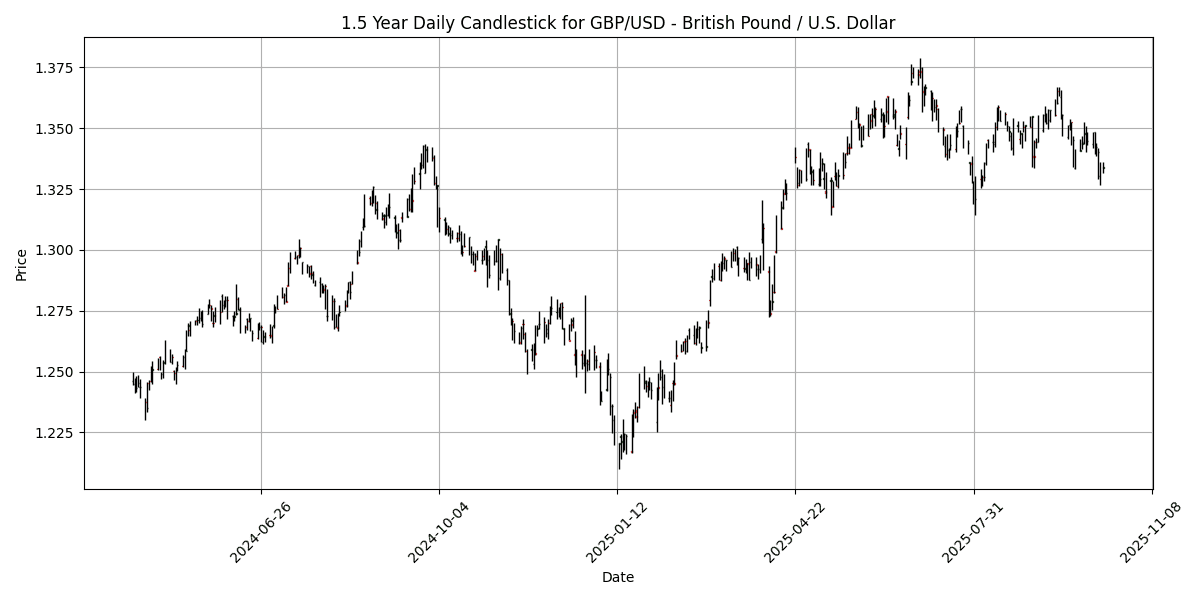
| GBP/USD – British Pound / U.S. Dollar | GBPUSD | 1.3305 | -1.0560 | 6.0236 | 1.3474 | 1.3498 | 1.3165 | 36.55 | -0.0035 |
| USD/CHF – U.S. Dollar / Swiss Franc | USDCHF | 0.8062 | 1.1543 | -10.74 | 0.8006 | 0.8042 | 0.8398 | 65.64 | 0.0005 |
| AUD/USD – Australian Dollar / U.S. Dollar | AUDUSD | 0.6561 | -0.5608 | 5.4823 | 0.6555 | 0.6535 | 0.6420 | 35.22 | -0.0002 |
| USD/CAD – U.S. Dollar / Canadian Dollar | USDCAD | 1.4019 | 0.4154 | -2.3053 | 1.3839 | 1.3766 | 1.3982 | 77.43 | 0.0048 |
| NZD/USD – New Zealand Dollar / U.S. Dollar | NZDUSD | 0.5753 | -1.1512 | 2.0087 | 0.5878 | 0.5943 | 0.5847 | 27.96 | -0.0035 |
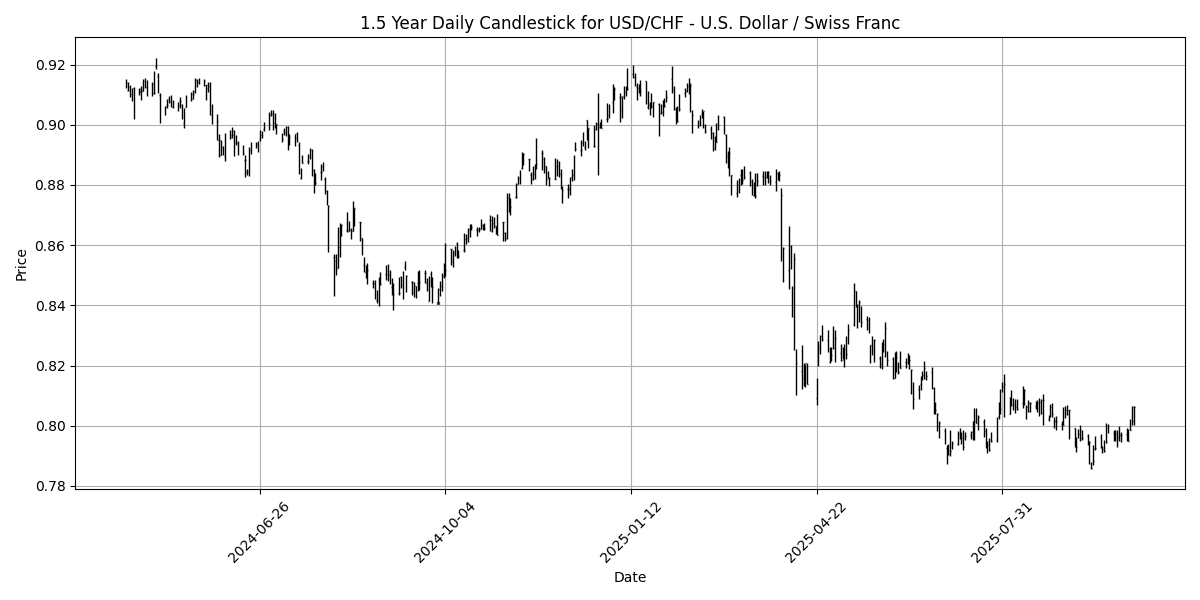
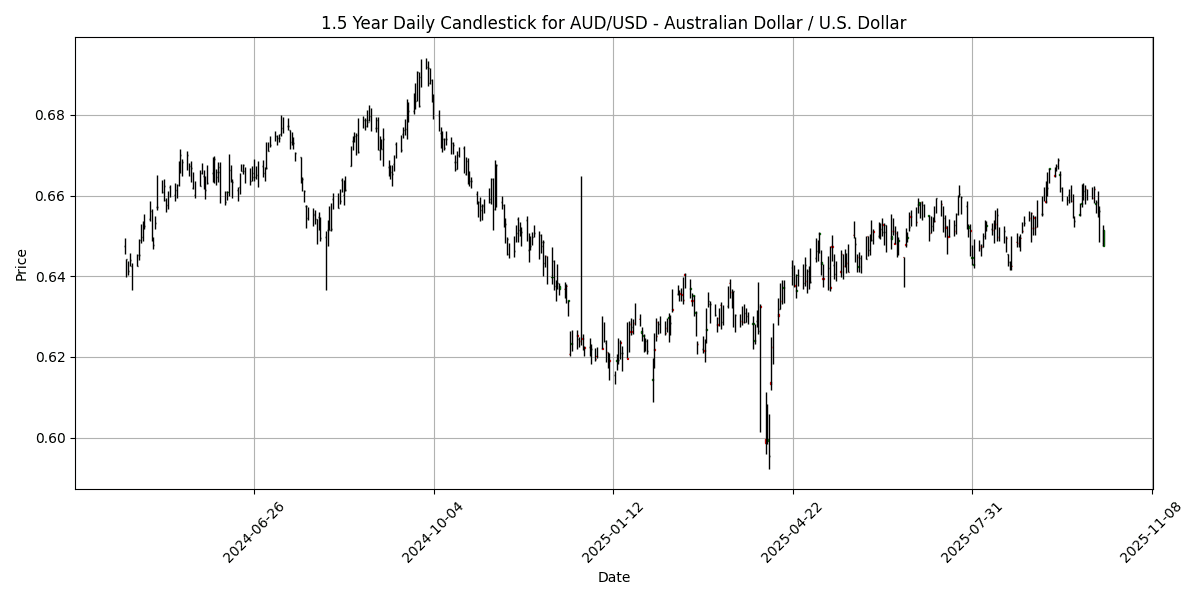
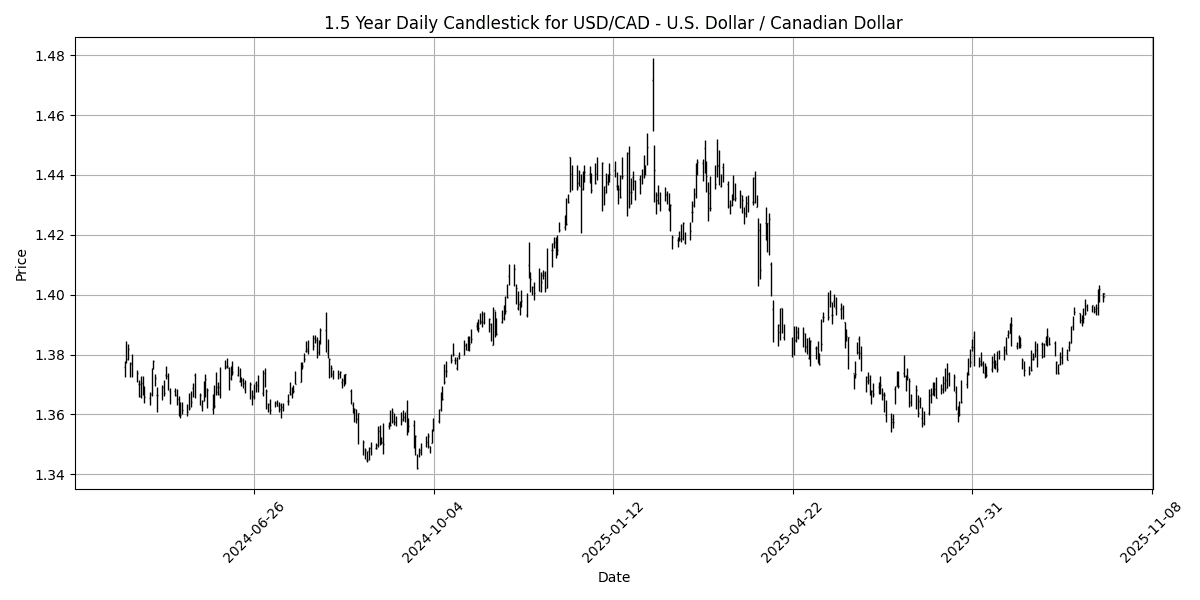
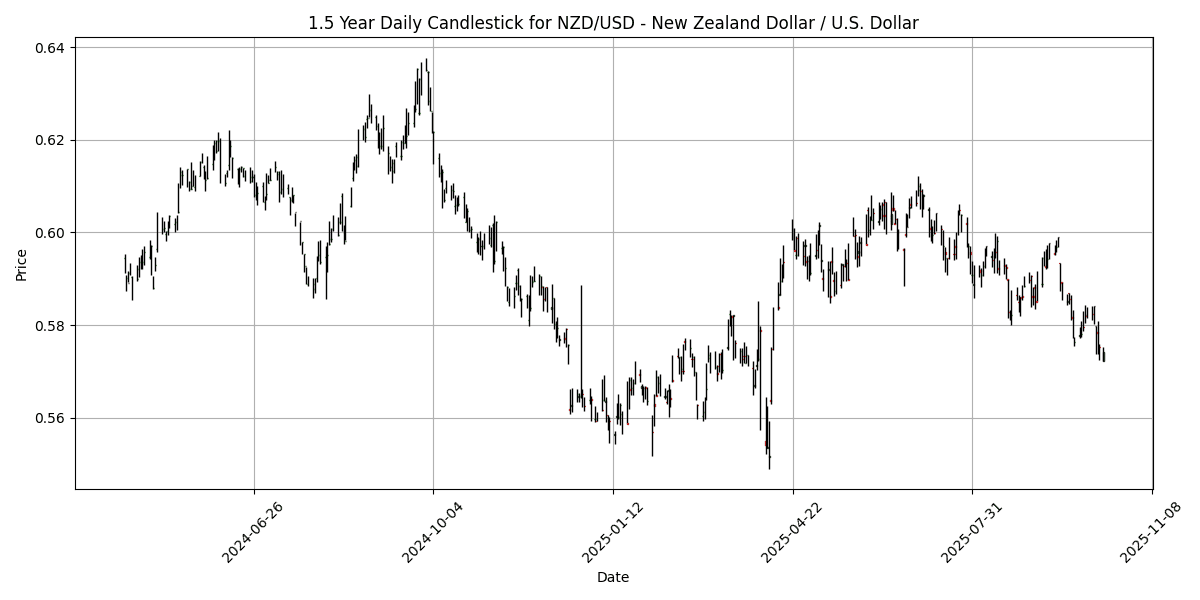
No significant technical comments available for the past week.
## Cross FX Group
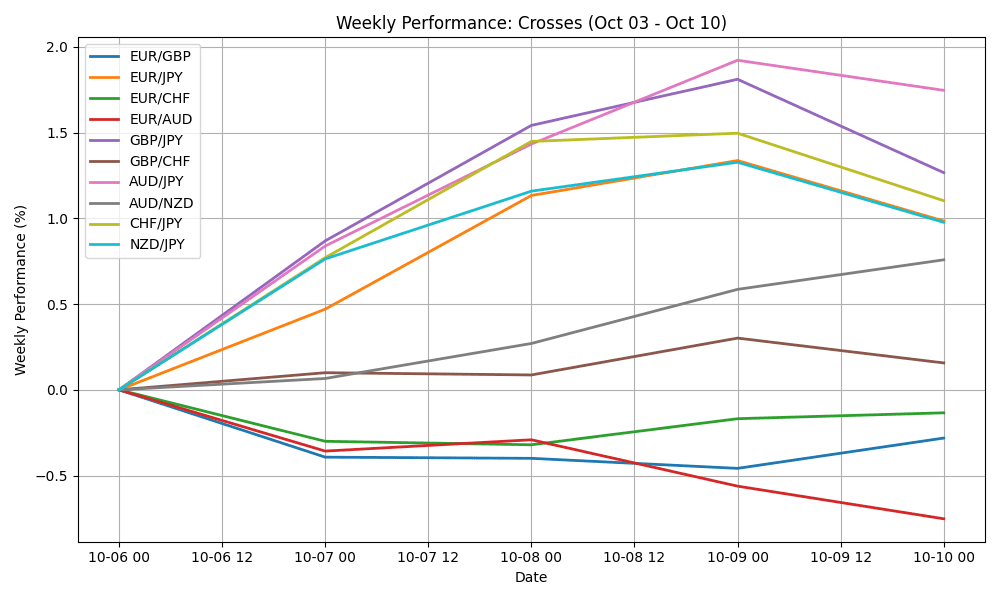
| Name | Symbol | Price | Weekly (%) | YTD (%) | MA50 | MA100 | MA200 | RSI | MACD |
|---|---|---|---|---|---|---|---|---|---|
| EUR/GBP | EURGBP | 0.8693 | -0.2982 | 4.8372 | 0.8677 | 0.8622 | 0.8514 | 39.01 | 0.0005 |
| EUR/JPY | EURJPY | 176.94 | 2.5544 | 8.2932 | 173.20 | 170.96 | 166.07 | 60.84 | 0.9867 |
| EUR/CHF | EURCHF | 0.9324 | -0.2247 | -0.7980 | 0.9360 | 0.9355 | 0.9389 | 32.27 | -0.0011 |
| EUR/AUD | EURAUD | 1.7627 | -0.8103 | 5.3490 | 1.7839 | 1.7809 | 1.7458 | 46.34 | -0.0030 |
| GBP/JPY | GBPJPY | 203.50 | 2.8525 | 3.3021 | 199.57 | 198.27 | 195.00 | 61.53 | 1.0003 |
| GBP/CHF | GBPCHF | 1.0725 | 0.0746 | -5.3690 | 1.0786 | 1.0851 | 1.1030 | 43.92 | -0.0020 |
| AUD/JPY | AUDJPY | 100.36 | 3.3810 | 2.7985 | 97.08 | 95.98 | 95.12 | 59.33 | 0.7118 |
| AUD/NZD | AUDNZD | 1.1404 | 0.5910 | 3.4194 | 1.1151 | 1.0996 | 1.0981 | 60.23 | 0.0064 |
| CHF/JPY | CHFJPY | 189.72 | 2.7766 | 9.1625 | 185.02 | 182.72 | 176.89 | 64.82 | 1.2702 |
| NZD/JPY | NZDJPY | 87.98 | 2.7589 | -0.6190 | 87.05 | 87.27 | 86.61 | 55.34 | 0.1376 |
No significant technical comments available for the past week.
## Exotics and Emerging
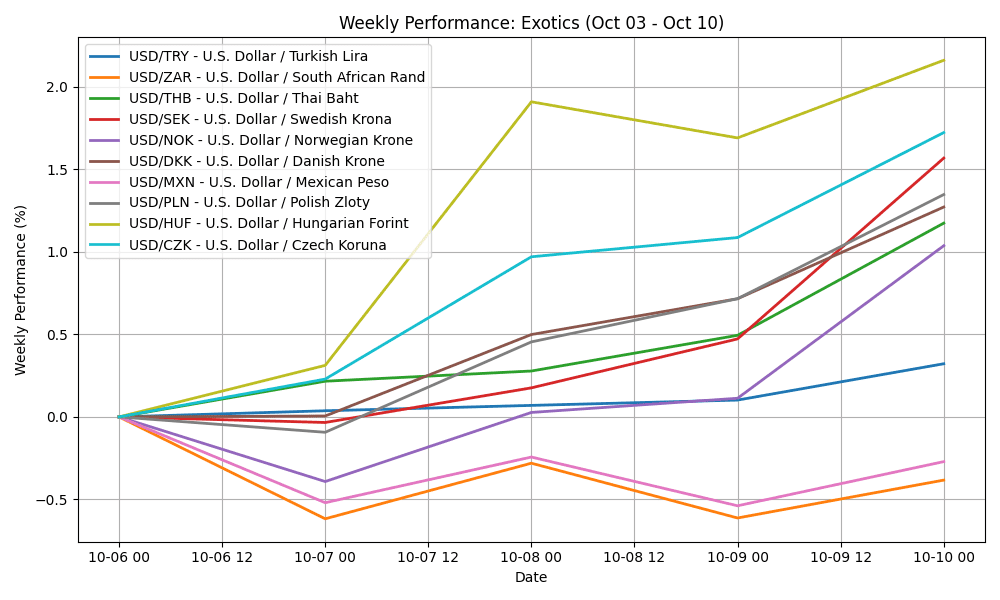
| Name | Symbol | Price | Weekly (%) | YTD (%) | MA50 | MA100 | MA200 | RSI | MACD |
|---|---|---|---|---|---|---|---|---|---|
| USD/TRY – U.S. Dollar / Turkish Lira | USDTRY | 41.82 | 0.4339 | 18.46 | 41.21 | 40.52 | 38.81 | 72.46 | 0.1595 |
| USD/ZAR – U.S. Dollar / South African Rand | USDZAR | 17.19 | -0.4557 | -8.3843 | 17.49 | 17.65 | 18.05 | 52.10 | -0.0751 |
| USD/THB – U.S. Dollar / Thai Baht | USDTHB | 32.77 | 1.0173 | -4.0101 | 32.24 | 32.38 | 33.07 | 80.69 | 0.1392 |
| USD/SEK – U.S. Dollar / Swedish Krona | USDSEK | 9.5319 | 1.4734 | -13.53 | 9.4575 | 9.5149 | 9.9196 | 62.90 | 0.0077 |
| USD/NOK – U.S. Dollar / Norwegian Krone | USDNOK | 10.06 | 0.9002 | -11.15 | 10.04 | 10.07 | 10.46 | 63.90 | 0.0051 |
| USD/DKK – U.S. Dollar / Danish Krone | USDDKK | 6.4552 | 1.3741 | -9.9291 | 6.3840 | 6.4130 | 6.6689 | 70.74 | 0.0128 |
| USD/MXN – U.S. Dollar / Mexican Peso | USDMXN | 18.38 | -0.1553 | -10.90 | 18.55 | 18.72 | 19.45 | 57.78 | -0.0427 |
| USD/PLN – U.S. Dollar / Polish Zloty | USDPLN | 3.6802 | 1.3717 | -10.39 | 3.6400 | 3.6573 | 3.7862 | 69.06 | 0.0069 |
| USD/HUF – U.S. Dollar / Hungarian Forint | USDHUF | 337.93 | 1.8911 | -14.45 | 336.04 | 340.95 | 358.24 | 67.91 | 0.1432 |
| USD/CZK – U.S. Dollar / Czech Koruna | USDCZK | 21.06 | 1.8028 | -12.83 | 20.86 | 21.09 | 22.16 | 66.79 | 0.0224 |
Disclaimer
The content on MarketsFN.com is provided for educational and informational purposes only. It does not constitute financial advice, investment recommendations, or trading guidance. All investments involve risks, and past performance does not guarantee future results. You are solely responsible for your investment decisions and should conduct independent research and consult a qualified financial advisor before acting. MarketsFN.com and its authors are not liable for any losses or damages arising from your use of this information.


