Weekly Market Summary: Oil and Bitcoin Surge Amid Cautious Optimism
Week of October 17 – October 24, 2025
📊 Weekly Market Overview
### Weekly Market Summary: October 17-24, 2025
Global markets navigated a week of cautious optimism amid anticipated rate cuts in North America and advancing U.S.-led trade initiatives under President Trump. Equity indices in major economies posted modest gains, buoyed by hopes for monetary easing and diplomatic breakthroughs, though lingering uncertainties around tariffs and geopolitical tensions tempered enthusiasm. The U.S. dollar weakened slightly against a basket of currencies as investors positioned for Federal Reserve action, while commodities showed mixed performance, with energy prices dipping on supply concerns. Emerging markets, particularly in Southeast Asia, outperformed amid Trump’s regional engagements, highlighting a rotation toward undervalued assets. Overall, the period underscored a bull market at a crossroads, with Big Tech earnings serving as a pivotal test of resilience. Trading volumes remained elevated, reflecting investor focus on policy signals and corporate disclosures.
Major market movements reflected a blend of relief rallies and selective profit-taking. In equities, the S&P 500 climbed 1.2% to close at 5,820, driven by pre-earnings positioning in technology and consumer sectors, though it pulled back mid-week on tariff escalation fears. The Nasdaq Composite advanced 1.8%, outperforming broader indices as AI-themed stocks rallied on headlines about educational disruptions from artificial intelligence. Europe’s Stoxx 600 edged up 0.7%, supported by ECB comments on steady rates, but French markets lagged with a 0.3% decline amid political instability delaying a wealth tax vote. In Asia, Japan’s Nikkei 225 rose 1.1% on yen weakness, while ASEAN indices surged, with Malaysia’s benchmark gaining 2.4% following Trump’s arrival and ASEAN summit in Kuala Lumpur. Emerging markets broadly added 1.5%, fueled by optimism over U.S. trade frameworks with Vietnam and Brazil.
Currencies exhibited volatility tied to trade and policy outlooks. The U.S. dollar index fell 0.8% to 102.3, pressured by North American rate cut expectations and Trump’s tariff hikes on Canada, which he announced at 10% following a Reagan-era advertisement reference. The euro strengthened 0.6% against the dollar, bolstered by ECB Governing Council member Escrivá’s affirmation that current interest rates remained appropriate amid stable inflation. The Malaysian ringgit appreciated 1.2%, reflecting spillover from Trump’s diplomatic overtures, including a peace deal between Cambodia and Thailand. In commodities, Brent crude oil declined 2.1% to $78 per barrel, weighed by Saudi banks signaling a lending pullback after years of expansion, exacerbating a liquidity squeeze. Gold held steady at $2,650 per ounce, serving as a hedge against U.S.-China trade deal uncertainties, while soybean futures jumped 3.5% after reports of substantial Chinese purchases, as noted by economic advisor Bessent.
Economic drivers were dominated by central bank signals and geopolitical developments. North American policymakers, including the Federal Reserve and Bank of Canada, prepared for rate reductions, contrasting with the G-7’s more dovish stance elsewhere, which injected liquidity expectations into risk assets. U.S. trade diplomacy advanced notably, with frameworks unveiled for Vietnam following a 20% tariff resolution and talks launched with Brazil after Trump and Lula mended ties; a sweeping U.S.-China deal was teed up for finalization by Trump and Xi, boosting soybean and broader agricultural sentiment. Geopolitically, Trump’s Southeast Asia tour, including greetings to Malaysian officials and a lighthearted dance moment, spurred hopes for the region’s emerging markets, long overlooked by investors. However, headwinds emerged from Embraer’s warnings of order delays due to tariffs and Australia’s exploration of copyright reforms to address AI challenges. In Europe, France’s teetering government delayed a wealth tax vote, adding to fiscal uncertainty, while private credit firms eyed opportunities in Saudi Arabia’s tightening liquidity.
Sector and asset highlights revealed rotations toward technology and emerging market plays. Big Tech stocks led gains, with AI innovators up an average 2.5% on reports of academia’s transformation—dubbed “20 PhDs in the time of one”—amid broader earnings anticipation. Aerospace faltered, as Embraer’s shares dropped 4.2% on tariff-related order risks. In fixed income, EquipmentShare’s bonds sank 15% following fraud allegations by an ousted board member, underscoring credit market vulnerabilities. Emerging market debt rallied 1.3%, particularly in ASEAN and Latin America, on Trump’s visit catalyzing investments in least-favored regions. Energy lagged with a 1.8% sector decline, tied to Saudi lending signals, while soybeans and related agribusiness assets surged on China purchase news. Overall, investors favored growth-oriented sectors amid rate cut tailwinds, but defensive positioning persisted in tariff-exposed industries.
Looking ahead, markets will monitor Big Tech earnings releases and ASEAN summit outcomes for directional cues, alongside U.S. trade negotiation updates with China and Canada. Federal Reserve speeches and preliminary GDP data from key economies could further shape rate expectations.
📈 Indices
S&P 500
🔍 Technical Analysis
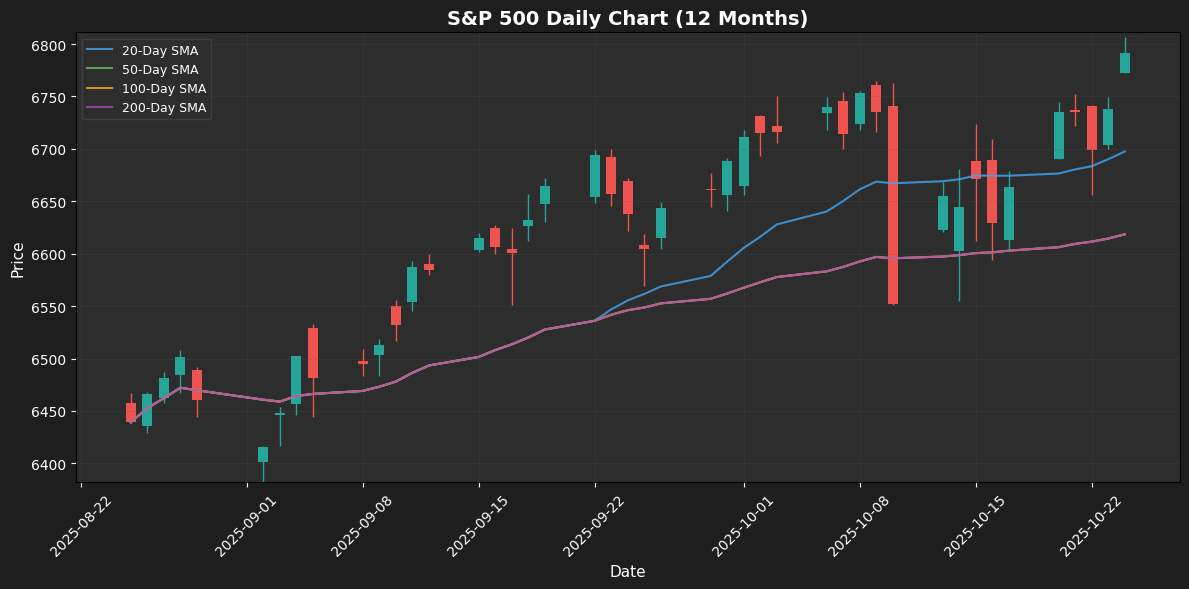
The S&P 500 experienced a solid weekly performance, gaining 1.92% to close at 6791.6899. The price is currently positioned above the key moving averages, trading 1.41% above the 20-MA at 6697.5700 and 2.62% above both the 50-MA and 200-MA, which are both at 6618.5202. This positioning indicates a bullish trend as the price remains comfortably above these critical support levels. The Bollinger Bands reveal that the index is trading near the upper band at 6801.9938, suggesting potential overbought conditions, while the lower band sits at 6593.1461, indicating a solid support zone.
The RSI at 62.51 is in the neutral zone, suggesting that the market is neither overbought nor oversold at this moment. Meanwhile, the MACD reading of 40.6062 reflects bullish momentum, reinforcing the positive sentiment. With the 52-week high at 6807.1099 just within reach, traders should monitor this level closely, as a breakout could signal further upside. Key support levels to watch include the 20-MA at 6697.5700 and the lower Bollinger Band at 6593.1461.
Nasdaq 100
🔍 Technical Analysis
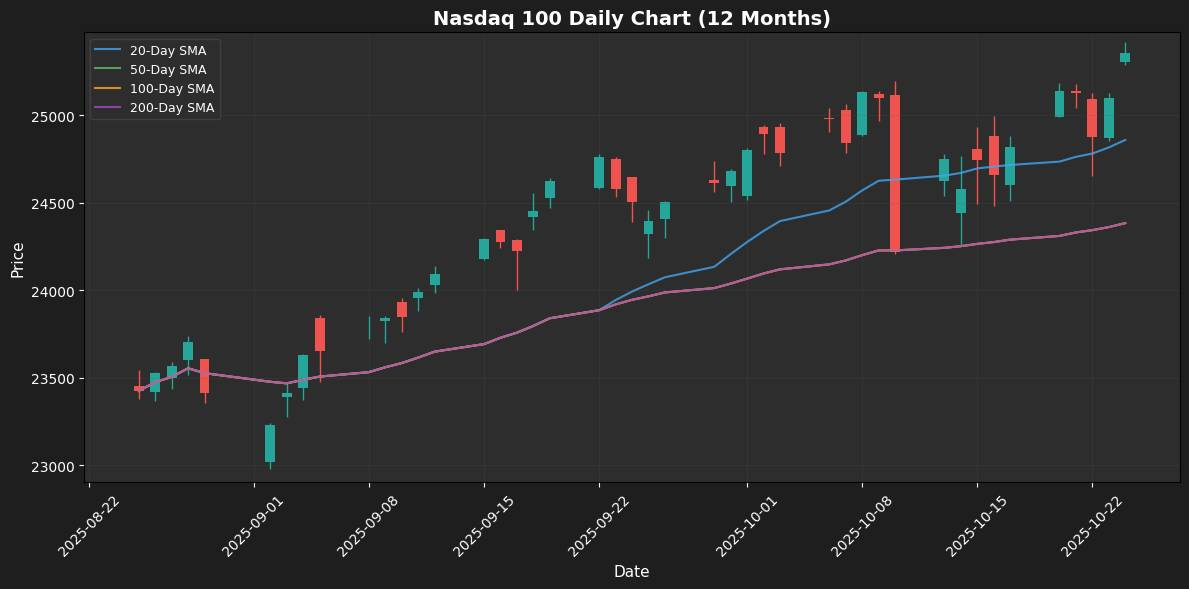
The Nasdaq 100 has shown a robust weekly performance, gaining 2.18% to reach a current price of 25,358.1602. This upward movement positions the index above critical moving averages, with the price currently 2.00% above the 20-week moving average at 24,859.9329 and approximately 3.99% above both the 50-week and 200-week moving averages, which are aligned at 24,384.5597. The index is trading near the upper Bollinger Band, currently at 25,362.2251, suggesting potential overbought conditions, while the lower band sits at 24,357.6408.
The Relative Strength Index (RSI) is at 62.78, indicating that the index is in a neutral zone, neither overbought nor oversold. However, the MACD shows a bearish momentum with a value of 251.8985, which may signal a potential reversal. With the 52-week high at 25,418.6406 and a low of 22,977.8809, traders should watch for key support around the 20-MA and resistance near the 52-week high.
Dow Jones
🔍 Technical Analysis
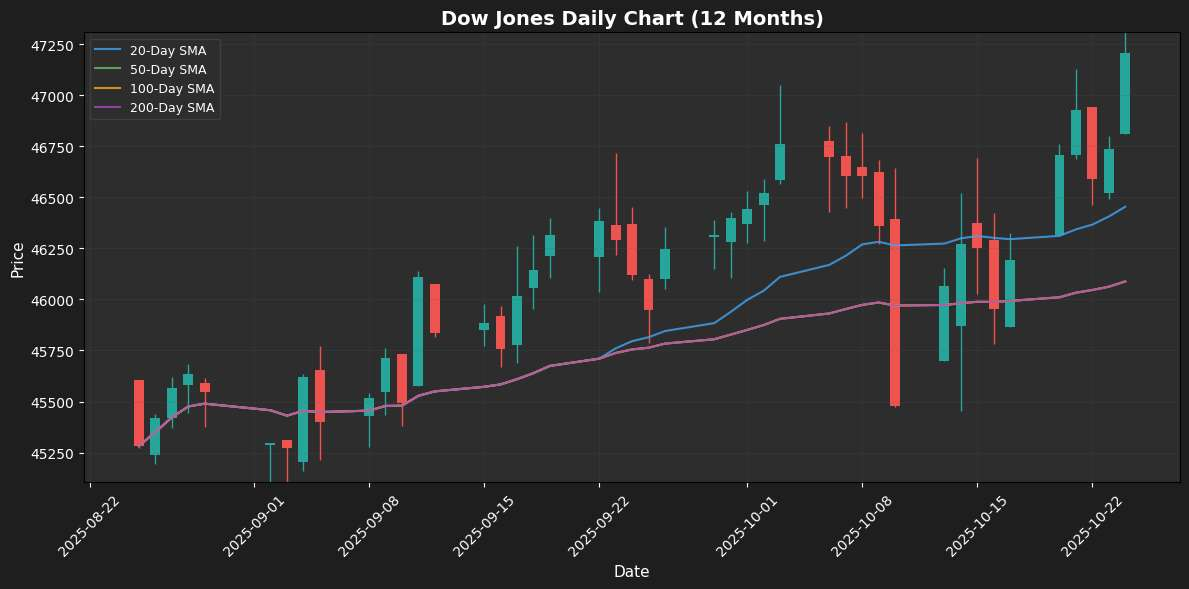
The Dow Jones Industrial Average experienced a robust weekly performance, gaining 2.20% and currently standing at 47,207.1211. The price is positioned above key moving averages, notably the 20-MA at 46,453.4234, where it is 1.62% higher, and the 50-MA and 200-MA, both at 46,088.0046, reflecting a strong bullish trend. The index is currently near the upper Bollinger Band at 47,184.7623, suggesting potential overbought conditions, yet it remains within a healthy range given the overall momentum. The Relative Strength Index (RSI) at 63.37 indicates a neutral stance, leaving room for further upward movement without signaling immediate overextension. Furthermore, the MACD at 234.8063 confirms bullish momentum, reinforcing the positive outlook. The Dow is approaching its 52-week high of 47,326.7305, making this a critical level to watch. Key support levels are positioned at the 50-MA and 200-MA, while resistance may be encountered near the upper Bollinger Band and the recent high.
Euro Stoxx 50
🔍 Technical Analysis
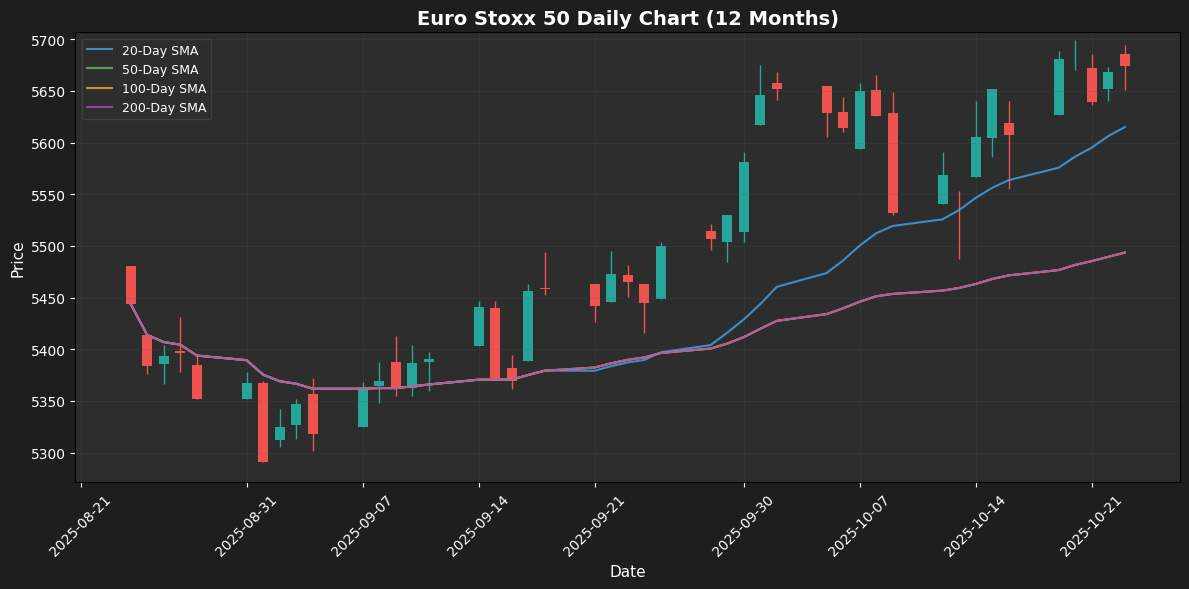
The Euro Stoxx 50 has exhibited a positive weekly performance, gaining 1.20% and currently trading at 5674.50. The index is positioned above both the 20-day moving average (MA) at 5614.95 and the 50-day MA at 5493.51, indicating a bullish trend in the short to medium term. However, the index is also approaching the upper Bollinger Band at 5719.86, suggesting it might face resistance in this area, with the lower band at 5510.03 providing support.
The Relative Strength Index (RSI) stands at 60.98, placing it in the neutral zone, which implies that while there is upward momentum, the market is not overbought. Conversely, the Moving Average Convergence Divergence (MACD) at 56.79 indicates bearish momentum, hinting at potential downward pressure ahead. The index is near its 52-week high of 5699.13, which could act as a critical resistance level. Traders should closely monitor key support at the 20-MA and resistance at the upper Bollinger Band for potential price action.
Nikkei 225
🔍 Technical Analysis
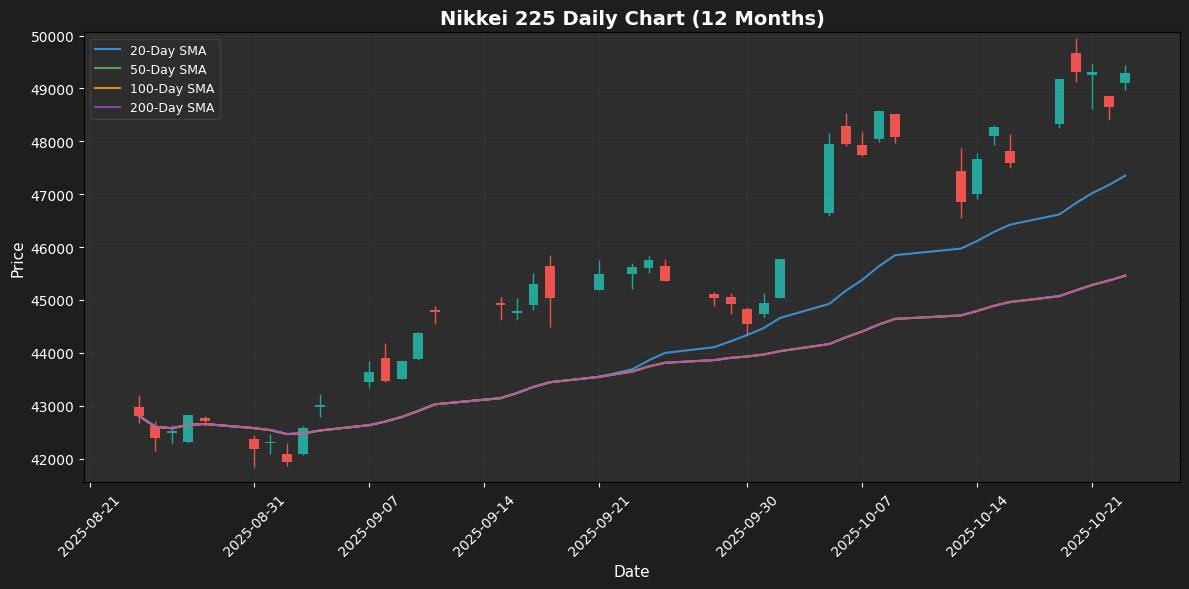
The Nikkei 225 has shown a robust weekly performance, gaining 3.61% and currently trading at 49,299.6484. The index is positioned well above its key moving averages, with the price sitting 4.12% above the 20-MA at 47,350.9402 and an impressive 8.45% above both the 50-MA and 200-MA, which are both at 45,460.1884. This positioning indicates a strong bullish trend. The index is currently near the upper Bollinger Band at 50,576.7920, suggesting that it may be approaching overbought conditions, as it also sits well above the lower band at 44,125.0885. The RSI is at 65.83, indicating momentum within the neutral zone, but nearing overbought territory. The MACD is showing bullish momentum at 1,297.2863, reinforcing the positive trend. The index is also close to its 52-week high of 49,945.9492, making this a critical resistance level to monitor. Key support levels to watch include the 20-MA and the psychological level of 49,000.
Shanghai Composite
🔍 Technical Analysis
The Shanghai Composite has demonstrated a solid weekly performance, gaining 2.88% and currently trading at 3950.3120. The index is positioned above its key moving averages, with the price sitting 1.85% above the 20-period moving average of 3878.5743 and 2.32% above both the 50- and 200-period moving averages, which are at 3860.8600. This positioning indicates a bullish trend. The index is also nearing the upper Bollinger Band at 3957.2282, suggesting potential resistance in the short term, while the lower band at 3799.9203 provides a support level. The RSI is currently at 60.63, indicating that the index is in a neutral zone, which could suggest room for further upside. Additionally, the MACD at 20.1574 shows bullish momentum, reinforcing the positive outlook. With the current price at the 52-week high of 3950.3120, traders should watch for key support at the 20-MA and resistance near the upper Bollinger Band.
📈 Forex
EUR/USD
🔍 Technical Analysis
The EUR/USD pair has experienced a weekly decline of 0.58%, currently trading at 1.1632. The price remains below the key moving averages, with the 20-MA at 1.1659, indicating a distance of -0.23%, and both the 50-MA and 200-MA at 1.1693, showing a -0.52% deviation. This positioning suggests a bearish trend, as the price struggles to regain momentum above these averages.
The Bollinger Bands indicate that the current price is mid-range, with the upper band at 1.1770 and the lower band at 1.1547, reflecting potential consolidation. The RSI at 46.00 remains in the neutral zone, signaling indecision in the market. Meanwhile, the MACD shows a bearish momentum with a value of -0.0022, reinforcing the downward pressure on the pair.
Proximity to the 52-week high of 1.1873 and low of 1.1545 highlights the potential for volatility. Traders should watch the immediate support at 1.1547 and resistance near 1.1693 for potential breakouts or reversals.
USD/JPY
🔍 Technical Analysis
The USD/JPY has shown a robust weekly performance, gaining 1.79% and currently trading at 152.8100. The price is positioned significantly above the 20-day moving average (MA) at 150.6754, reflecting bullish sentiment, as it is 1.42% higher. Furthermore, it remains well above both the 50-day and 200-day MAs, which are both at 149.0049, indicating a strong upward trend. The Bollinger Bands place the upper limit at 154.2840 and the lower at 147.0669, with the current price sitting mid-range, suggesting potential price volatility ahead.
The Relative Strength Index (RSI) at 64.34 indicates that the market is moving towards overbought territory but remains in the neutral zone. The MACD value of 0.9958 further supports bullish momentum, signaling continued upward pressure. With a 52-week high of 153.2120 and a low of 146.2170, traders should watch for resistance near the recent high and support around the 20-MA at 150.6754 for potential reversals or breakouts.
📈 Commodities
Gold
🔍 Technical Analysis
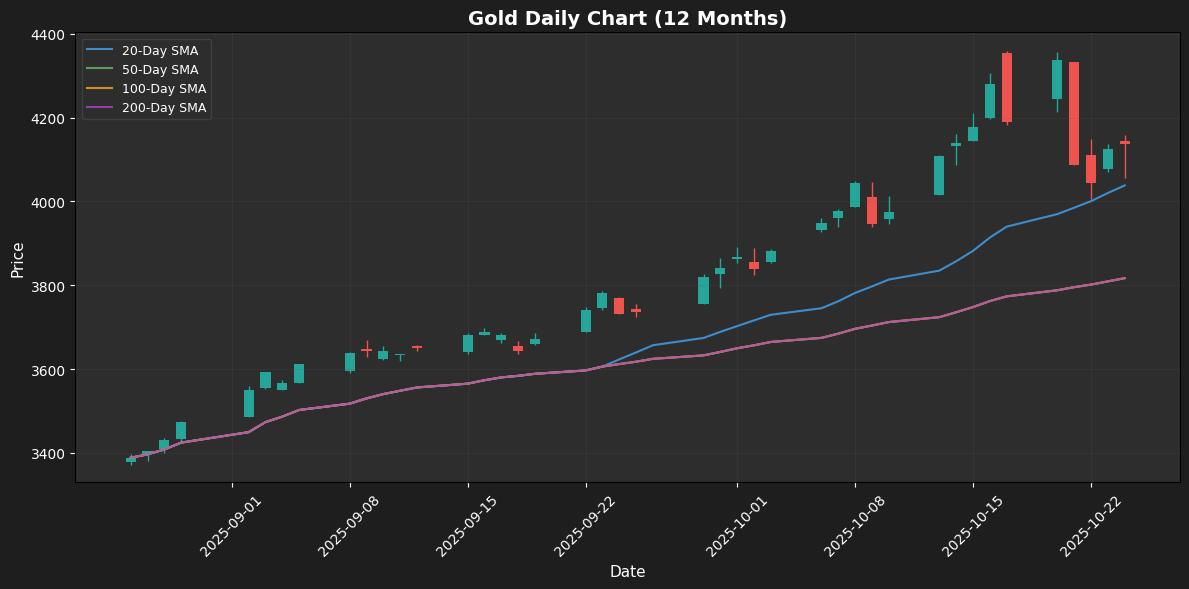
Gold has experienced a weekly decline of 1.24%, currently trading at 4137.7998. The price remains above the 20-week moving average (MA) of 4038.3200, indicating a short-term bullish trend, with a notable 2.46% gain from this level. However, it is positioned significantly above both the 50-MA and 200-MA, which are both at 3817.0163, reflecting a robust long-term bullish sentiment, with an 8.40% margin above these averages. The price is nearing the upper Bollinger Band at 4331.0722, suggesting potential overbought conditions, while the lower band at 3745.5678 provides critical support. The Relative Strength Index (RSI) is at 59.46, indicating a neutral stance, which suggests that gold may not be overbought yet. Conversely, the MACD shows a bearish momentum at 122.7823, hinting at possible downward pressure. With the 52-week high at 4358.0000 and a low of 3371.1001, traders should watch for key support at the 20-MA and resistance near the upper Bollinger Band.
Crude Oil
🔍 Technical Analysis
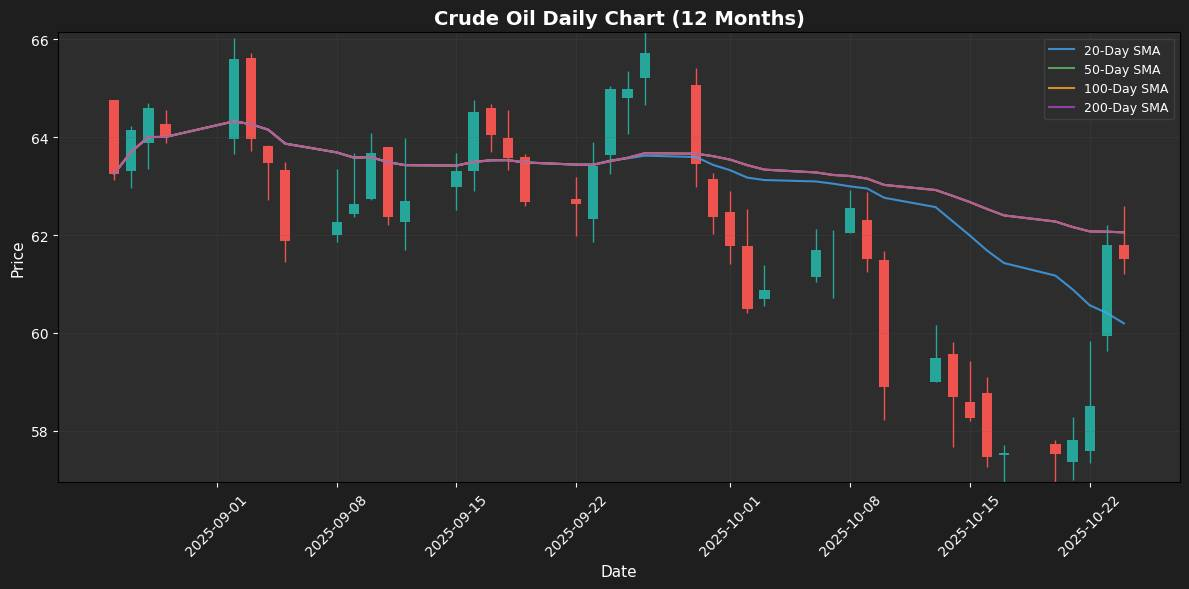
Crude oil has demonstrated a robust weekly performance, gaining 6.88% and currently trading at $61.50. The price is positioned above the 20-day moving average (MA) at $60.1965, indicating short-term bullish sentiment, while it remains slightly below both the 50-day and 200-day MAs at $62.0542, suggesting potential resistance ahead. The proximity to the upper Bollinger Band at $64.0127 indicates that the market is nearing overbought conditions, while the lower band at $56.3803 provides a solid support level.
The Relative Strength Index (RSI) is currently at 53.81, reflecting a neutral zone, which suggests that there is room for further upward movement without being overextended. The MACD, at -0.8787, is showing bullish momentum, hinting at a potential shift in trend if the price can break above the key resistance levels. With the 52-week high at $66.4200 and a low of $56.3500, traders should closely monitor the $62.0542 resistance and the $60.1965 support for future price action.
📈 Crypto
Bitcoin
🔍 Technical Analysis
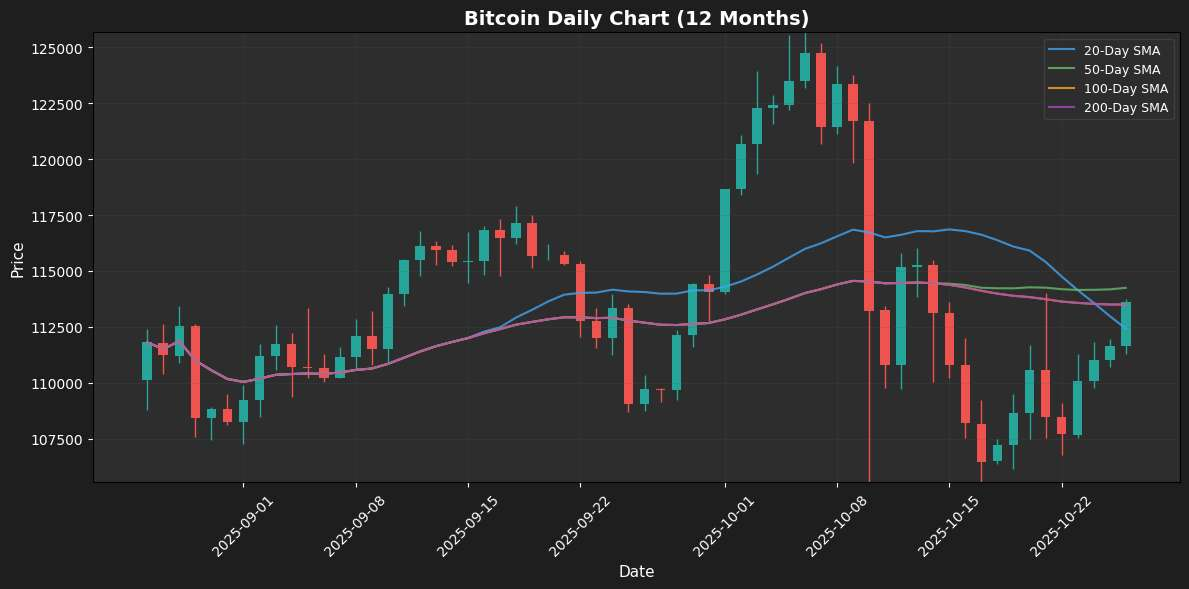
Bitcoin has experienced a solid weekly performance, gaining 4.29% and currently trading at $113,594.05. The price is positioned slightly above the 20-day moving average (MA) at $112,424.47, indicating short-term bullish sentiment, while it remains just below the 50-day MA at $114,243.91, suggesting potential resistance ahead. The price is also marginally above the 200-day MA at $113,499.90, reinforcing a generally bullish outlook.
The Bollinger Bands indicate that Bitcoin is trading in the mid-range between the upper band at $121,962.51 and the lower band at $102,886.43, which suggests a period of consolidation. The Relative Strength Index (RSI) at 52.36 indicates a neutral zone, reflecting balanced buying and selling pressure. Additionally, the MACD shows a value of -1,201.28, signaling bullish momentum, which could support further upward movement.
Currently, Bitcoin is approaching its 52-week high of $126,198.07, with the recent low at $103,598.43. Key support levels to watch include the 20-MA, while resistance is likely around the 50-MA.
Disclaimer
The content on MarketsFN.com is provided for educational and informational purposes only. It does not constitute financial advice, investment recommendations, or trading guidance. All investments involve risks, and past performance does not guarantee future results. You are solely responsible for your investment decisions and should conduct independent research and consult a qualified financial advisor before acting. MarketsFN.com and its authors are not liable for any losses or damages arising from your use of this information.


