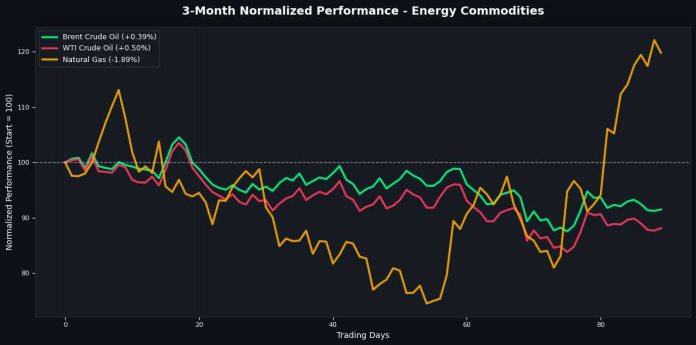
WTI and Brent Crude Oil Gain, Natural Gas Declines
Published: November 07, 2025
📊 Market Overview
| Commodity | Price | Daily % | MA50 | MA100 | MA200 | RSI | MACD |
|---|---|---|---|---|---|---|---|
| Brent Crude Oil | $63.67.00 | +0.39% | $65.33.20 | $66.71.28 | $N/A | 63.62 | -31.81 |
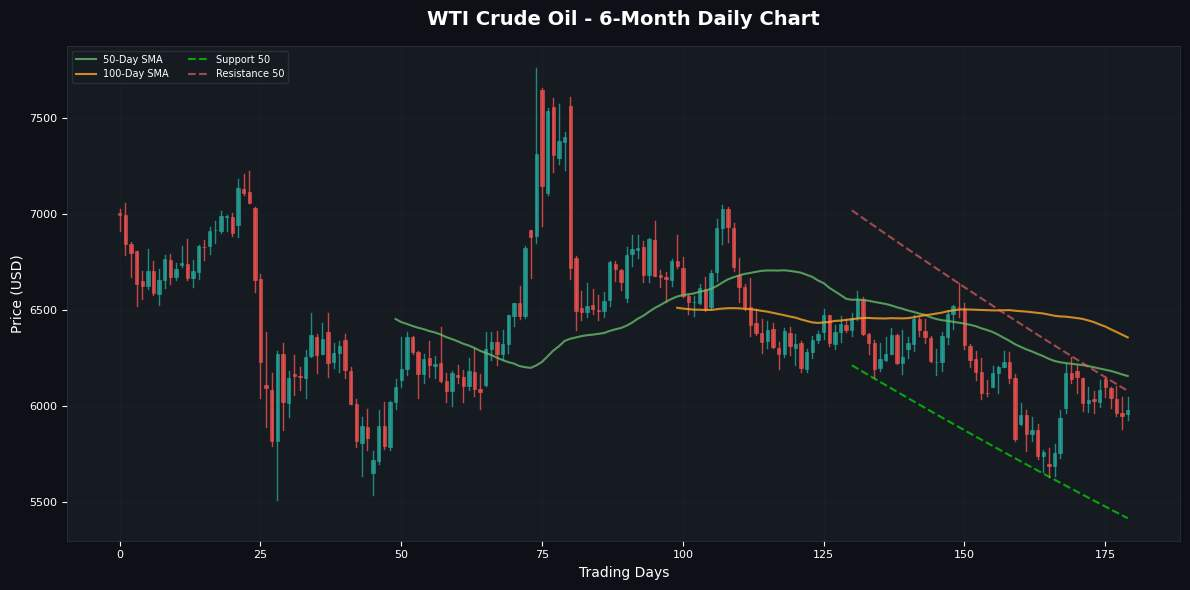
| WTI Crude Oil | $59.82.00 | +0.50% | $61.57.84 | $63.58.92 | $N/A | 65.53 | -35.58 |
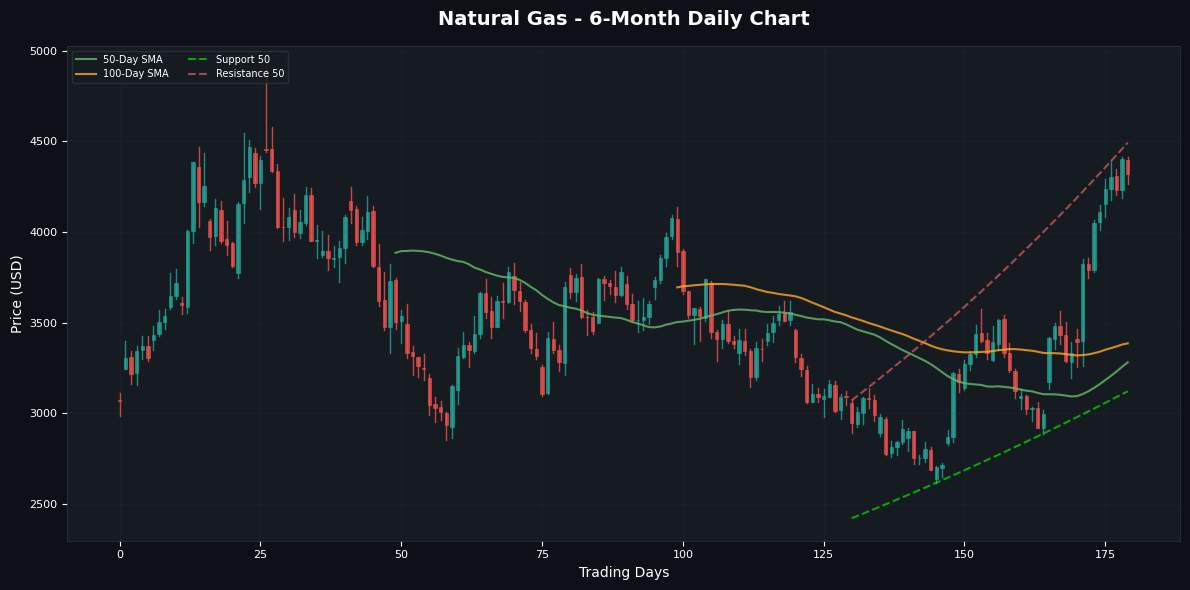
| Natural Gas | $43.18.00 | -1.89% | $32.81.06 | $33.85.76 | $N/A | 77.01 | 310.38 |
📈 Technical Analysis
⚡ Brent Crude Oil
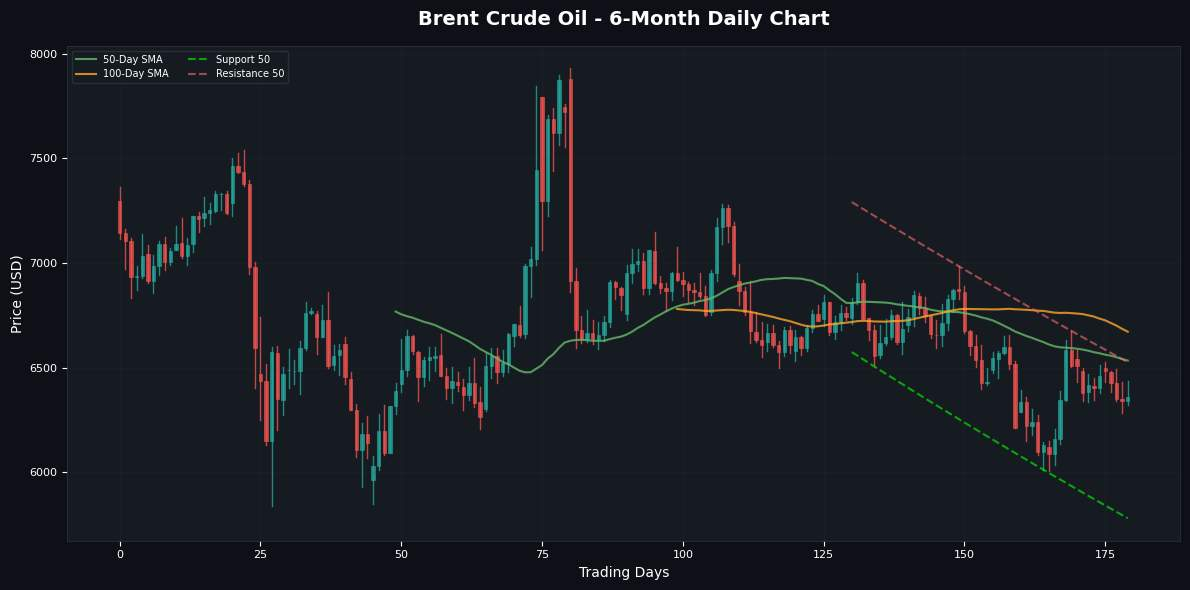
Technical Analysis: Brent Crude Oil is currently trading at $6367.00, showing +0.39% daily movement. Traders should monitor key support and resistance levels for potential trading opportunities.
⚡ WTI Crude Oil
⚡ Natural Gas
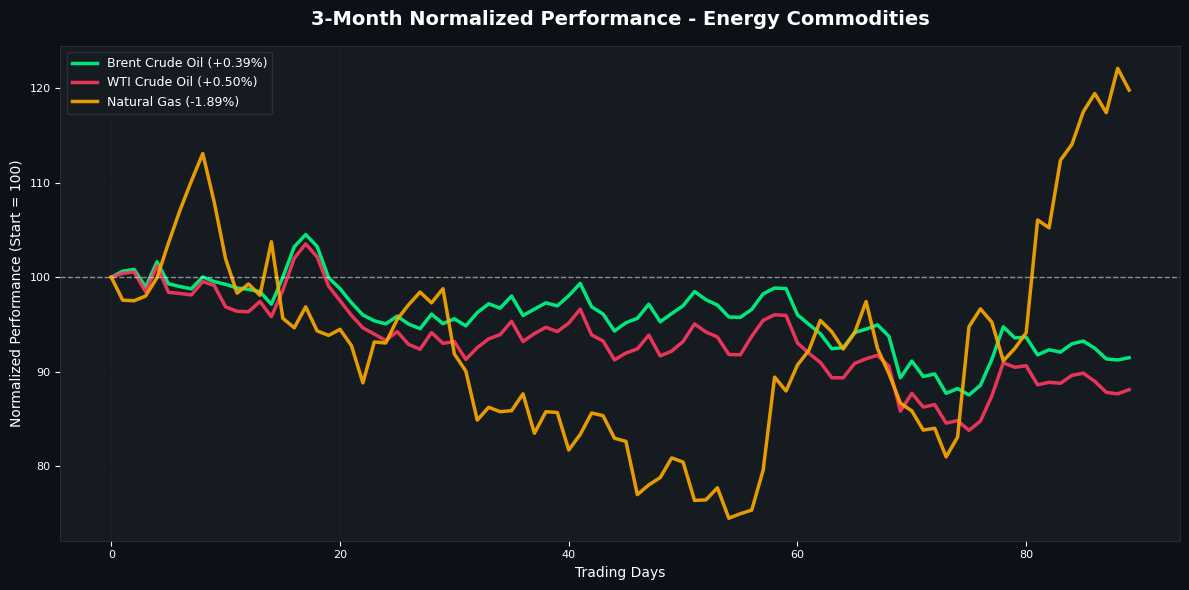
📊 Normalized Performance Comparison (3 Months)
Disclaimer
The content on MarketsFN.com is provided for educational and informational purposes only. It does not constitute financial advice, investment recommendations, or trading guidance. All investments involve risks, and past performance does not guarantee future results. You are solely responsible for your investment decisions and should conduct independent research and consult a qualified financial advisor before acting. MarketsFN.com and its authors are not liable for any losses or damages arising from your use of this information.


