Asian Markets Report: FTSE Bursa Malaysia KLCI Leads Amid Regional Tensions
· Market News · MarketsFN Team
Asian Markets Report: FTSE Bursa Malaysia KLCI Leads Amid Regional Tensions
Note: This analysis covers the Asian trading session close for June 04, 2026. All times are in US Eastern Time (ET).
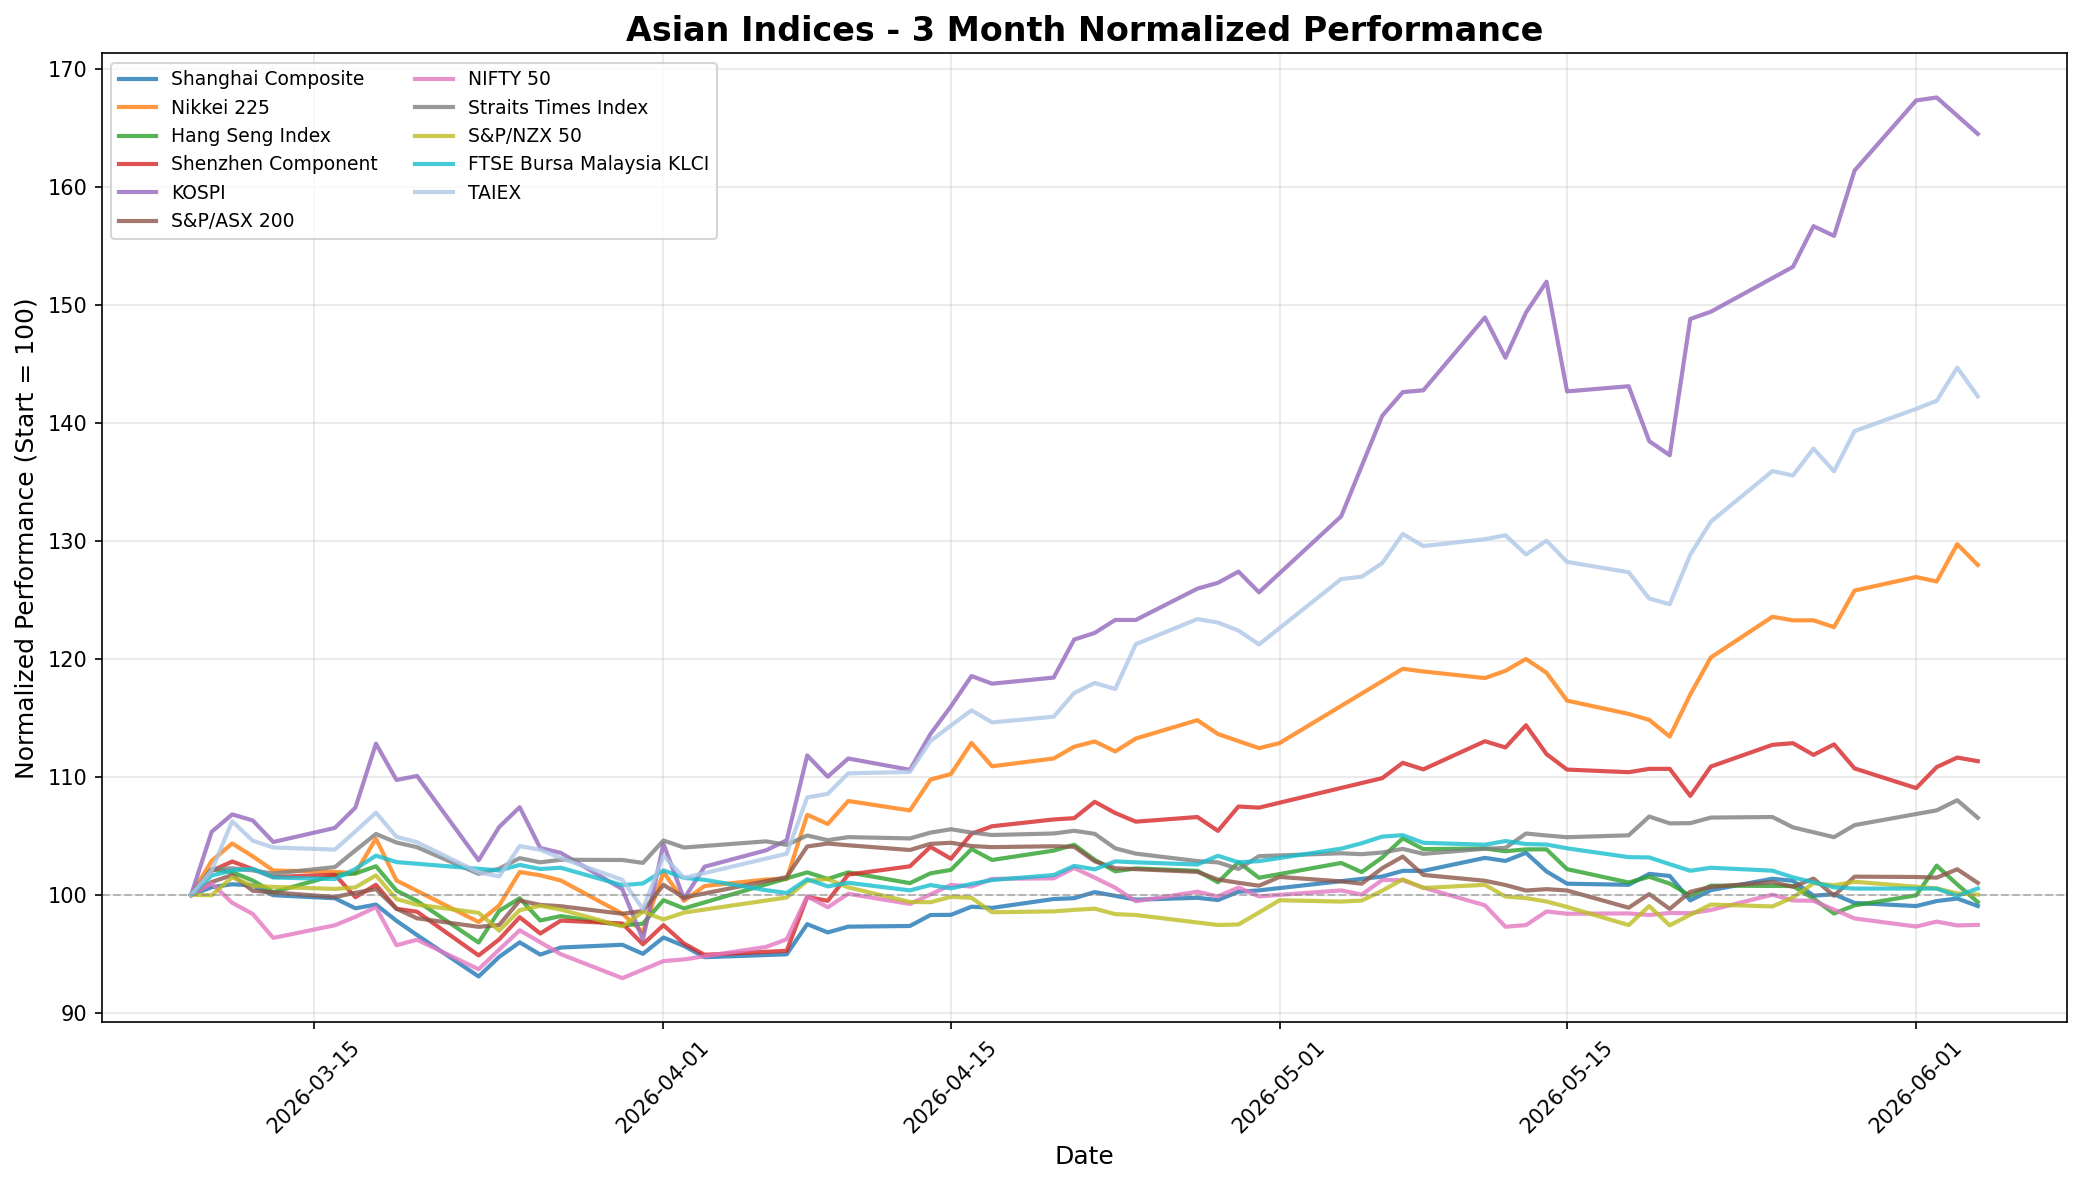
📊 Asian Indices Performance
| Index | Price | Daily Change (%) |
|---|---|---|
| Shanghai Composite | 4,057.78 | -0.64% |
| Nikkei 225 | 67,470.69 | -1.36% |
| Hang Seng Index | 25,253.40 | -1.48% |
| Shenzhen Component | 15,661.57 | -0.27% |
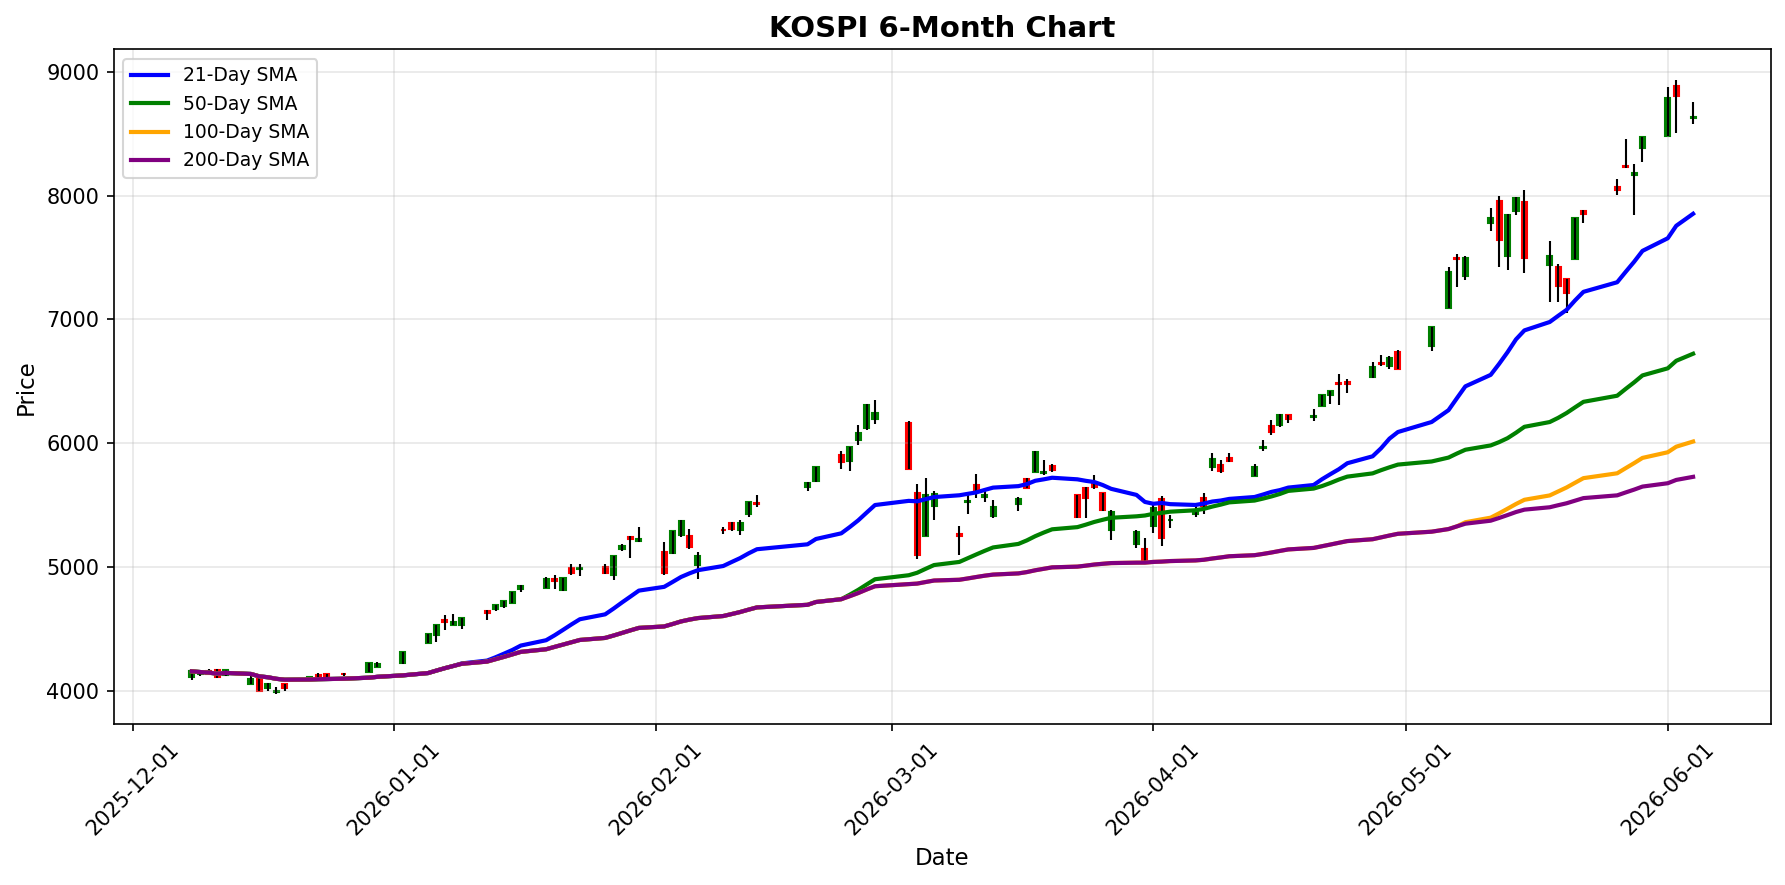
| KOSPI | 8,639.41 | -1.84% |
| S&P/ASX 200 | 8,686.10 | -1.13% |
| NIFTY 50 | 23,416.55 | +0.05% |
| Straits Times Index | 5,067.53 | -1.38% |
| S&P/NZX 50 | 13,101.61 | -0.10% |
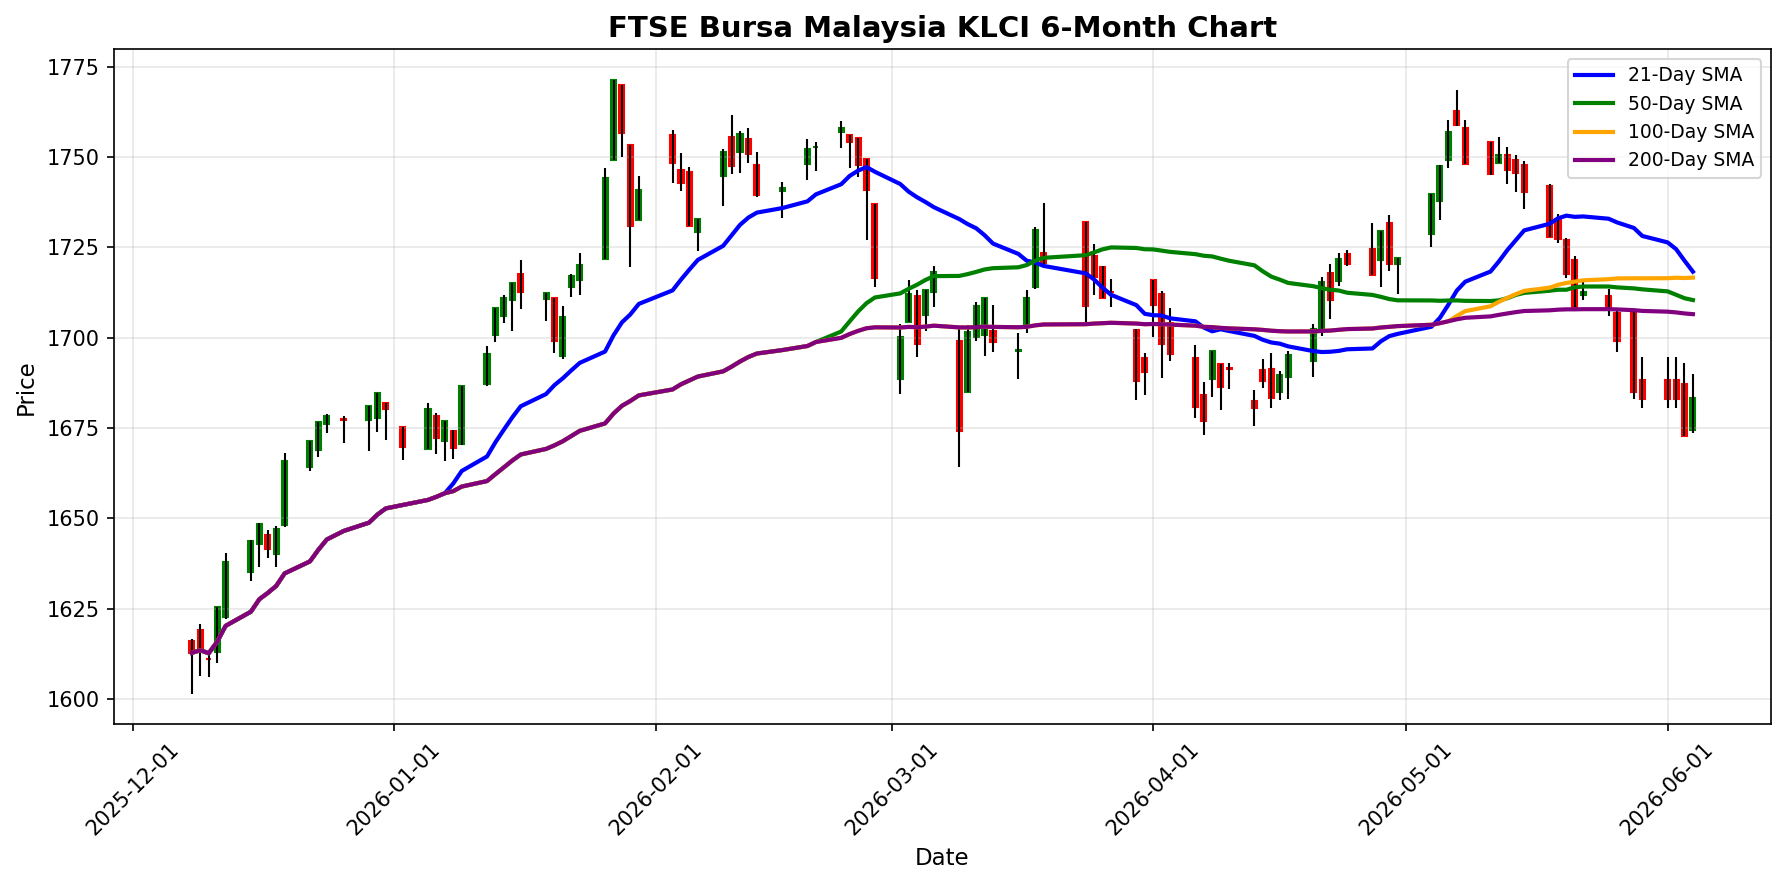
| FTSE Bursa Malaysia KLCI | 1,683.26 | +0.63% |
| TAIEX | 45,677.46 | -1.68% |
📰 Market Commentary
**Asian Market Summary - June 04, 2026** On June 04, 2026, Asian markets experienced notable declines, primarily influenced by escalating geopolitical tensions in the Middle East and rising crude oil prices. The Nikkei 225 in Tokyo fell by 1.36%, while the Hang Seng Index dropped 1.48%. Other indices also reflected a bearish sentiment, with the KOSPI down 1.84% and the Straits Times Index decreasing by 1.38%. **Key Events Impacting Asian Indices:** 1. **Middle East Tensions:** Renewed hostilities between Iran and the U.S. have raised concerns about potential military actions, which have led to increased oil prices and fears of sustained inflation. This geopolitical instability has adversely affected market confidence across the region. 2. **Trade Talks Between EU and China:** As the EU and China prepare for critical discussions aimed at easing escalating trade tensions, investors remain cautious. The outcome of these talks could significantly impact trade dynamics, particularly for countries heavily reliant on trade with China. **Market Sentiment and Price Movements:** The overall market sentiment in the Asia-Pacific region is bearish, with most indices reflecting losses. The Shanghai Composite fell by 0.64%, and the Shenzhen Component decreased by 0.27%. The NIFTY 50 in India showed a slight gain of 0.05%, contrasting with the broader trend, while the FTSE Bursa Malaysia KLCI rose by 0.63%. This divergence suggests that some markets may be reacting differently to regional economic conditions and investor sentiment. **Regional Economic Developments:** 1. **India's Currency Concerns:** The Indian rupee's decline has led to speculation about a potential surprise interest rate hike by the Reserve Bank of India, as rising inflation risks become more pronounced. 2. **Japan's AI Potential:** Analysts are highlighting Japan's potential in the AI sector, suggesting that it may offer significant investment opportunities compared to other Asian markets. This perspective could attract foreign investment, despite the current market downturn. 3. **Trade Relations:** The looming trade war between the EU and China continues to be a concern, with potential implications for Asian economies that are intertwined with these major players. In summary, the Asian markets on June 04, 2026, are under pressure due to geopolitical tensions and economic uncertainties, with a cautious outlook prevailing among investors.
📅 Economic Calendar - Asian Session
All times are in US Eastern Time (ET)
| Date | Time | Cur | Imp | Event | Actual | Forecast |
|---|---|---|---|---|---|---|
| 2026-06-04 | 19:30 | 🇯🇵 | Medium | Household Spending (YoY) (Apr) | -1.5% | |
| 2026-06-04 | 19:30 | 🇯🇵 | Medium | Household Spending (MoM) (Apr) | 0.8% |
On June 04, 2026, significant economic data was released from Japan that could impact trading strategies for Asian indices. **High-Impact Data Releases:** 1. **Household Spending (YoY) - April** - **Actual:** Not released - **Forecast:** -1.5% 2. **Household Spending (MoM) - April** - **Actual:** Not released - **Forecast:** 0.8% **Actual vs. Forecast Comparisons:** - For the YoY household spending, the forecast indicated a contraction of 1.5%, which suggests a potential decline in consumer confidence and spending power. If the actual figure aligns with or worsens from the forecast, it could signal economic weakness. - The MoM household spending forecast of 0.8% suggests a slight recovery in consumer spending month-over-month. However, without the actual data, the market's reaction remains uncertain. **Market Implications for Asian Indices:** - The lack of actual data for both releases leaves traders in a state of anticipation. If the actual figures reflect worse-than-expected outcomes, it could lead to bearish sentiment in the Japanese market, impacting indices such as the Nikkei 225. - Conversely, if the actual figures exceed forecasts, it may bolster confidence in the Japanese economy, potentially leading to a positive response in Asian indices. Traders should monitor these developments closely, as the final data releases will provide clearer insights into consumer behavior and economic health in Japan, influencing broader market trends across Asia.
📈 Index Performance Charts
Best Performer: FTSE Bursa Malaysia KLCI
Worst Performer: KOSPI
💱 FX, Commodities & Crypto
### FX Pairs Performance **Key Price Movements:** - **USD/JPY**: Currently at 159.7560, showing a slight decline of -0.15%. - **USD/CNY**: Trading at 6.7730 with a marginal increase of 0.06%. - **AUD/USD**: Increased to 0.7149, reflecting a gain of 0.22%. - **NZD/USD**: Up to 0.5887, marking a rise of 0.41%. **Market Drivers:** The FX market is influenced by various factors including interest rate differentials, economic data releases, and geopolitical events. The slight movements in the AUD and NZD against the USD may be attributed to stronger commodity prices and positive economic indicators from Australia and New Zealand. Conversely, the USD/JPY pair's minor decline may reflect market adjustments in response to U.S. monetary policy expectations. ### Commodities Performance **Key Price Movements:** - **Gold**: Priced at $4,522.90, up by 1.94%. - **Silver**: Now at $74.30, with an increase of 1.12%. - **Crude Oil (WTI)**: Currently at $93.31, showing a significant drop of -2.82%. **Market Drivers:** Gold and silver's price increases are likely driven by heightened demand for safe-haven assets amid economic uncertainties and inflation concerns. In contrast, the decline in crude oil prices may be attributed to easing supply constraints and potential demand concerns as global economic growth forecasts are adjusted. ### Cryptocurrency Performance **Key Price Movements:** - **Bitcoin**: Currently valued at $62,
Currency Pairs
| Pair | Price | Daily Change (%) |
|---|---|---|
| USD/JPY | 159.76 | -0.15% |
| USD/CNY | 6.77 | +0.06% |
| AUD/USD | 0.71 | +0.22% |
| NZD/USD | 0.59 | +0.41% |
Commodities
| Commodity | Price | Daily Change (%) |
|---|---|---|
| Gold | $4522.90 | +1.94% |
| Silver | $74.30 | +1.12% |
| Crude Oil (WTI) | $93.31 | -2.82% |
Cryptocurrencies
| Asset | Price | Daily Change (%) |
|---|---|---|
| Bitcoin | $62,453 | -2.44% |
| Ethereum | $1,748 | -3.51% |
Disclaimer
The content on MarketsFN.com is provided for educational and informational purposes only. It does not constitute financial advice, investment recommendations, or trading guidance. All investments involve risks, and past performance does not guarantee future results. You are solely responsible for your investment decisions and should conduct independent research and consult a qualified financial advisor before acting. MarketsFN.com and its authors are not liable for any losses or damages arising from your use of this information.