Asian Markets Slide as Nikkei Plummets Amid Major Tech Sell-Off
· Market News · MarketsFN Team
Asian Markets Slide as Nikkei Plummets Amid Major Tech Sell-Off
Note: This analysis covers the Asian trading session close for June 26, 2026. All times are in US Eastern Time (ET).
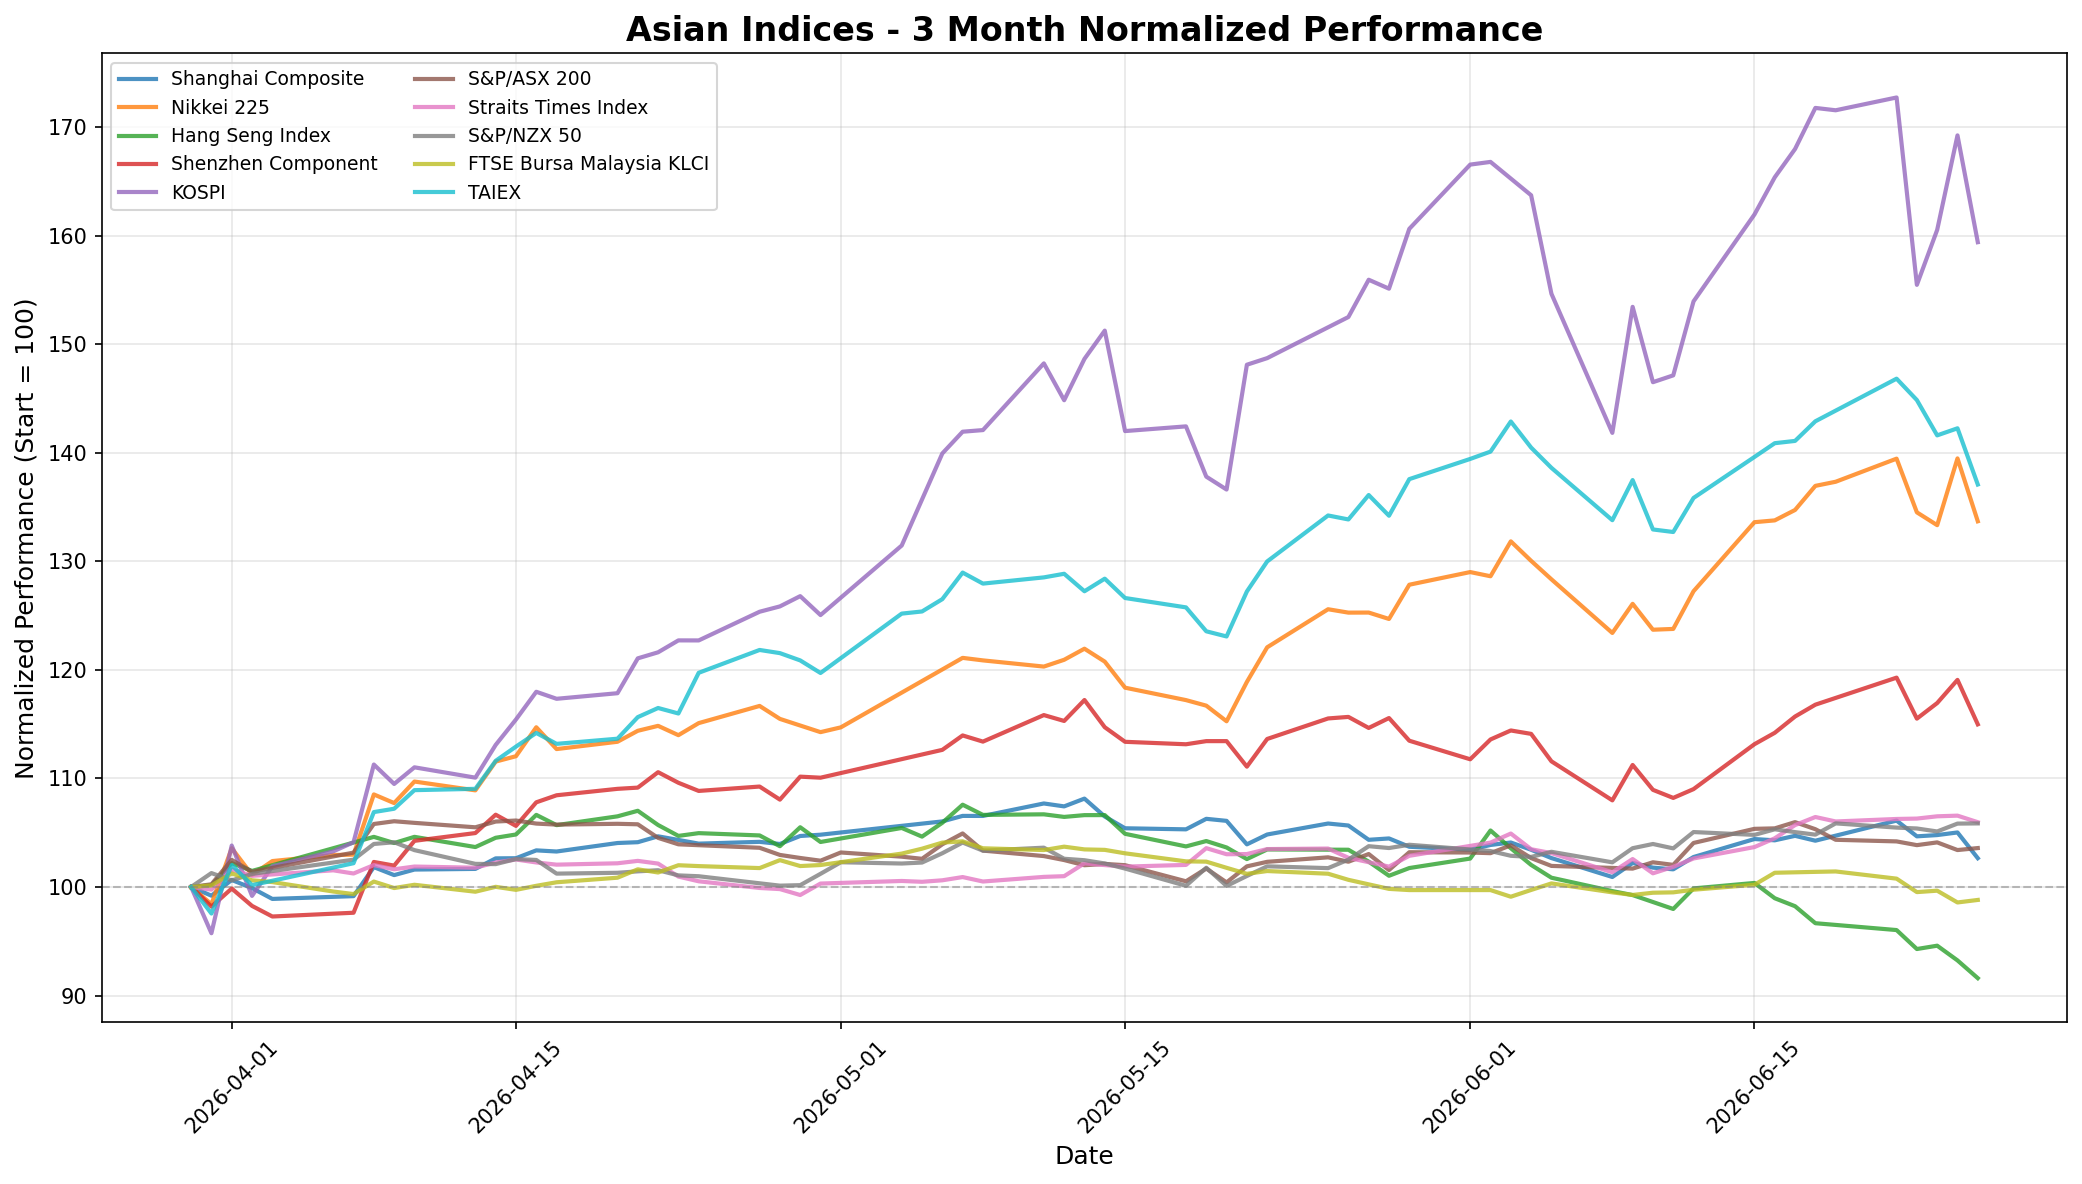
📊 Asian Indices Performance
| Index | Price | Daily Change (%) |
|---|---|---|
| Shanghai Composite | 4,027.26 | -2.26% |
| Nikkei 225 | 69,360.88 | -4.15% |
| Hang Seng Index | 22,671.86 | -1.76% |
| Shenzhen Component | 15,782.22 | -3.44% |
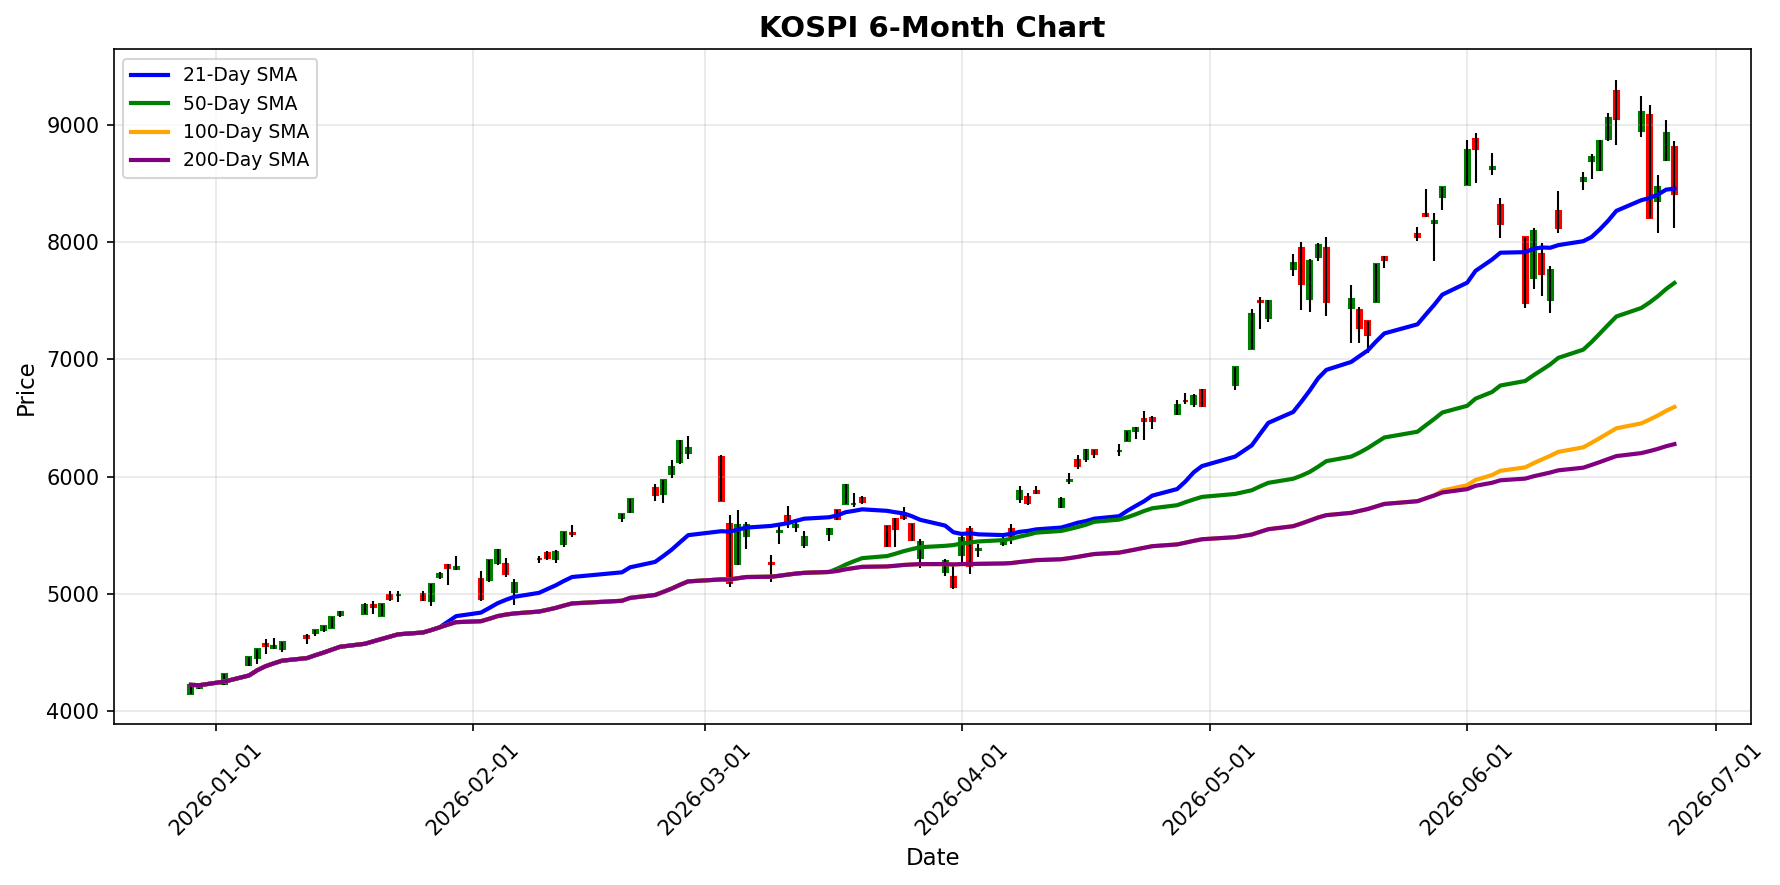
| KOSPI | 8,411.21 | -5.81% |
| S&P/ASX 200 | 8,764.20 | +0.18% |
| Straits Times Index | 5,189.45 | -0.57% |
| S&P/NZX 50 | 13,495.24 | +0.02% |
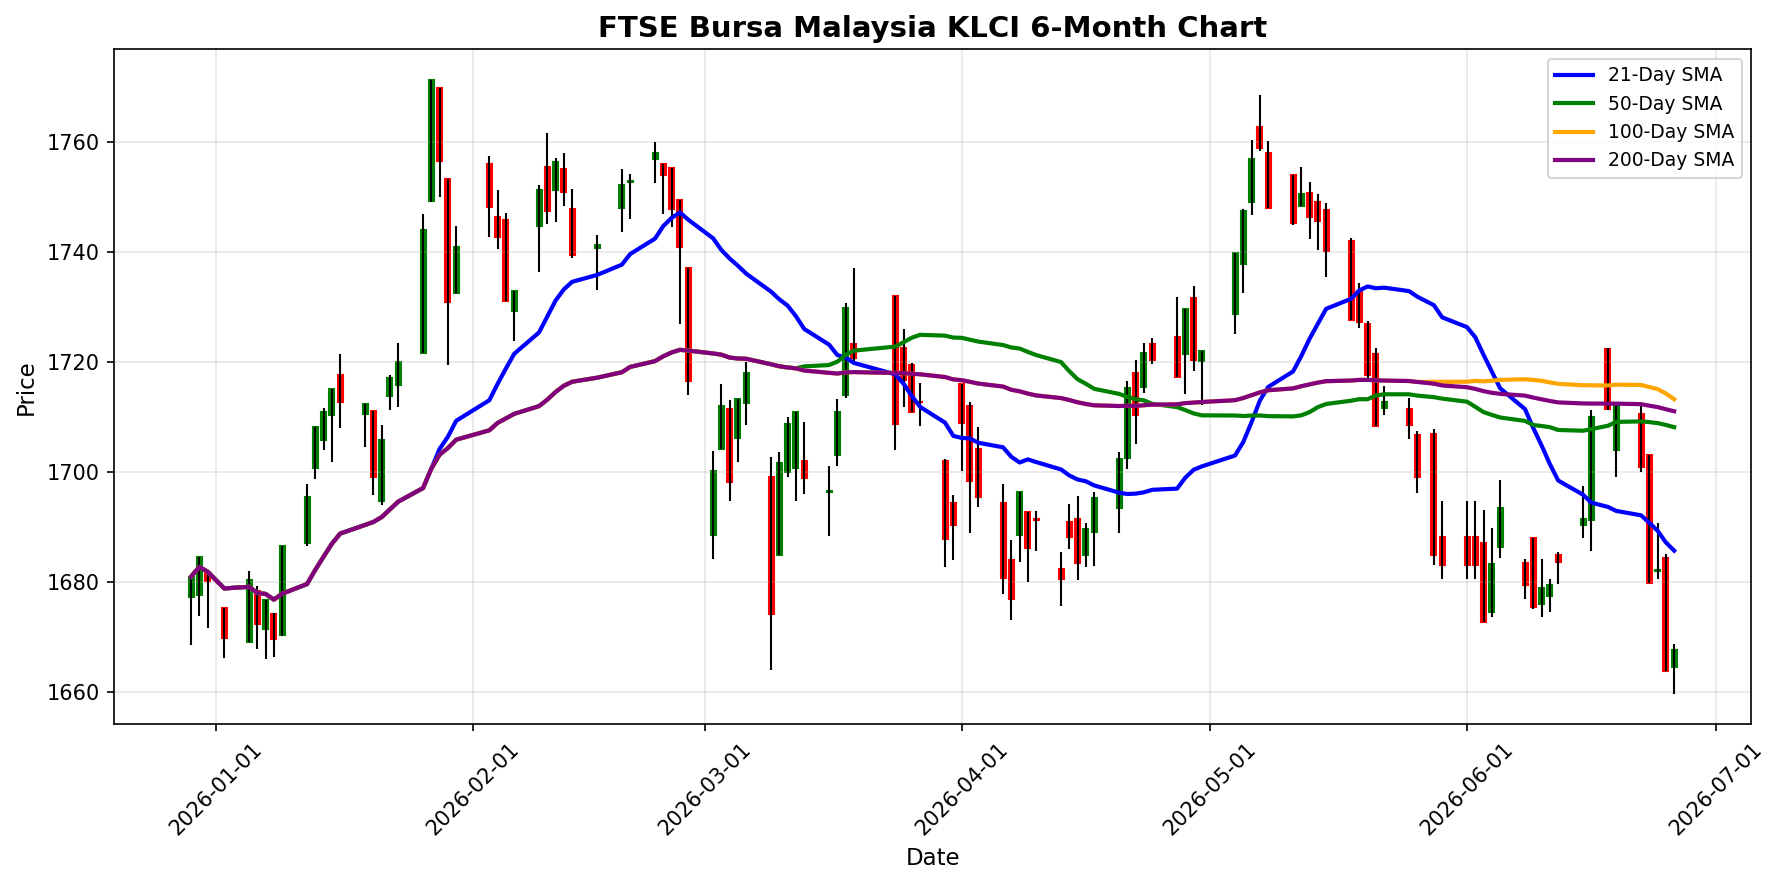
| FTSE Bursa Malaysia KLCI | 1,667.74 | +0.24% |
| TAIEX | 44,571.76 | -3.64% |
📰 Market Commentary
On June 26, 2026, Asian markets experienced significant turbulence, primarily driven by a sharp sell-off in technology stocks. The Nikkei 225 index in Japan fell by 4.15%, marking its third-largest point drop ever, as investors reacted to heightened concerns over the sustainability of the tech sector's recent performance. This sell-off was echoed across the region, with South Korea's KOSPI index plunging 5.81%, leading to multiple trading halts to prevent panic selling. Other indices also suffered losses, including the Shanghai Composite (-2.26%), Shenzhen Component (-3.44%), and the Hang Seng Index (-1.76%). Market sentiment across Asia was predominantly negative, reflecting broader apprehensions about the tech sector's volatility and the potential for an "AI super bubble," as warned by prominent Chinese hedge fund managers. The rapid fluctuations in stock prices have left investors anxious, particularly in South Korea, where the AI stock rally has shown signs of fragility. In terms of regional economic developments, Japan is advancing negotiations for an economic partnership agreement with five South American countries, aiming to bolster trade ties amidst a global backdrop of rising protectionism. Meanwhile, Hong Kong has reported a 36% increase in foreign direct investment (FDI) inflows in the first half of 2026, indicating a strong interest from US and European firms in expanding their operations in the city. Overall, the day's trading reflects a complex interplay of market dynamics, with technology stocks under scrutiny and regional economic initiatives attempting to counterbalance broader global uncertainties.
📅 Economic Calendar - Asian Session
All times are in US Eastern Time (ET)
| Date | Time | Cur | Imp | Event | Actual | Forecast |
|---|---|---|---|---|---|---|
| 2026-06-26 | 15:30 | 🇯🇵 | Medium | CFTC JPY speculative net positions |
On June 26, 2026, traders should pay close attention to the CFTC JPY speculative net positions data release, scheduled for 15:30 ET. While the actual figures and forecasts have not been provided, this report is crucial for understanding market sentiment and speculative positioning in the Japanese yen. **High-Impact Data Release:** - **CFTC JPY Speculative Net Positions:** This report reflects the net positions held by speculative traders in the futures market, indicating whether traders are predominantly long or short on the yen. **Actual vs Forecast Comparisons:** - As of now, there are no actual figures or forecasts available for comparison. However, the market will be keenly watching the results to gauge shifts in trader sentiment towards the yen. **Market Implications for Asian Indices:** - Depending on the outcome of the CFTC report, we could see significant volatility in the Japanese yen, which may influence broader Asian indices. A strong long position could indicate bullish sentiment towards the yen, potentially leading to a positive reaction in Japanese equities and related markets. Conversely, a predominant short position might suggest bearish sentiment, which could negatively impact Japanese stocks and spill over into regional indices. Traders should remain vigilant for the release and be prepared for potential market movements based on the sentiment reflected in the speculative positions.
📈 Index Performance Charts
Best Performer: FTSE Bursa Malaysia KLCI
Worst Performer: KOSPI
💱 FX, Commodities & Crypto
### FX Pairs Performance - **USD/JPY**: The pair is trading at 161.5900, reflecting a slight daily decline of -0.10%. This movement may be influenced by market sentiment surrounding U.S. interest rates and Japan's monetary policy stance. - **USD/CNY**: Currently at 6.7976, this pair has seen a modest increase of 0.12%. Factors contributing to this change include China's economic data releases and ongoing trade discussions impacting the yuan's strength. - **AUD/USD**: The Australian dollar is at 0.6901, down by -0.14%. This decline could be attributed to fluctuations in commodity prices, particularly iron ore, which is crucial for the Australian economy. - **NZD/USD**: The New Zealand dollar is trading at 0.5654, up by 0.07%. This slight increase may be driven by positive agricultural export data and a generally stable global risk environment. ### Commodities Performance - **Gold**: Priced at $4,058.50, gold has seen a daily increase of 0.69%. The rise is likely driven by safe-haven demand amid geopolitical tensions and inflation concerns. - **Silver**: Trading at $58.38, silver has experienced a minimal daily change of 0.06%. Its performance is closely tied to industrial demand and investor sentiment towards precious metals. - **Crude Oil (WTI)**: Currently at $69.40, WTI crude oil has dropped significantly by -3.50%. This decline may be linked to concerns over global economic growth, leading to reduced demand forecasts, as well as fluctuations in OPEC+ production decisions. ### Cryptocurrency Performance
Currency Pairs
| Pair | Price | Daily Change (%) |
|---|---|---|
| USD/JPY | 161.59 | -0.10% |
| USD/CNY | 6.80 | +0.12% |
| AUD/USD | 0.69 | -0.14% |
| NZD/USD | 0.57 | +0.07% |
Commodities
| Commodity | Price | Daily Change (%) |
|---|---|---|
| Gold | $4058.50 | +0.69% |
| Silver | $58.38 | +0.06% |
| Crude Oil (WTI) | $69.40 | -3.50% |
Cryptocurrencies
| Asset | Price | Daily Change (%) |
|---|---|---|
| Bitcoin | $60,028 | +0.51% |
| Ethereum | $1,560 | -0.29% |
Disclaimer
The content on MarketsFN.com is provided for educational and informational purposes only. It does not constitute financial advice, investment recommendations, or trading guidance. All investments involve risks, and past performance does not guarantee future results. You are solely responsible for your investment decisions and should conduct independent research and consult a qualified financial advisor before acting. MarketsFN.com and its authors are not liable for any losses or damages arising from your use of this information.