Asian Markets Slide as Tokyo Dips, FTSE Bursa Malaysia KLCI Shines
MarketsFN Team
Asian Markets Slide as Tokyo Dips, FTSE Bursa Malaysia KLCI Shines
Note: This analysis covers the Asian trading session close for July 13, 2026. All times are in US Eastern Time (ET).
📊 Asian Indices Performance
| Index | Price | Daily Change (%) |
|---|---|---|
| Shanghai Composite | 3,913.79 | -2.06% |
| Nikkei 225 | 67,242.73 | -1.92% |
| Hang Seng Index | 24,213.72 | +0.16% |
| Shenzhen Component | 14,522.85 | -3.48% |
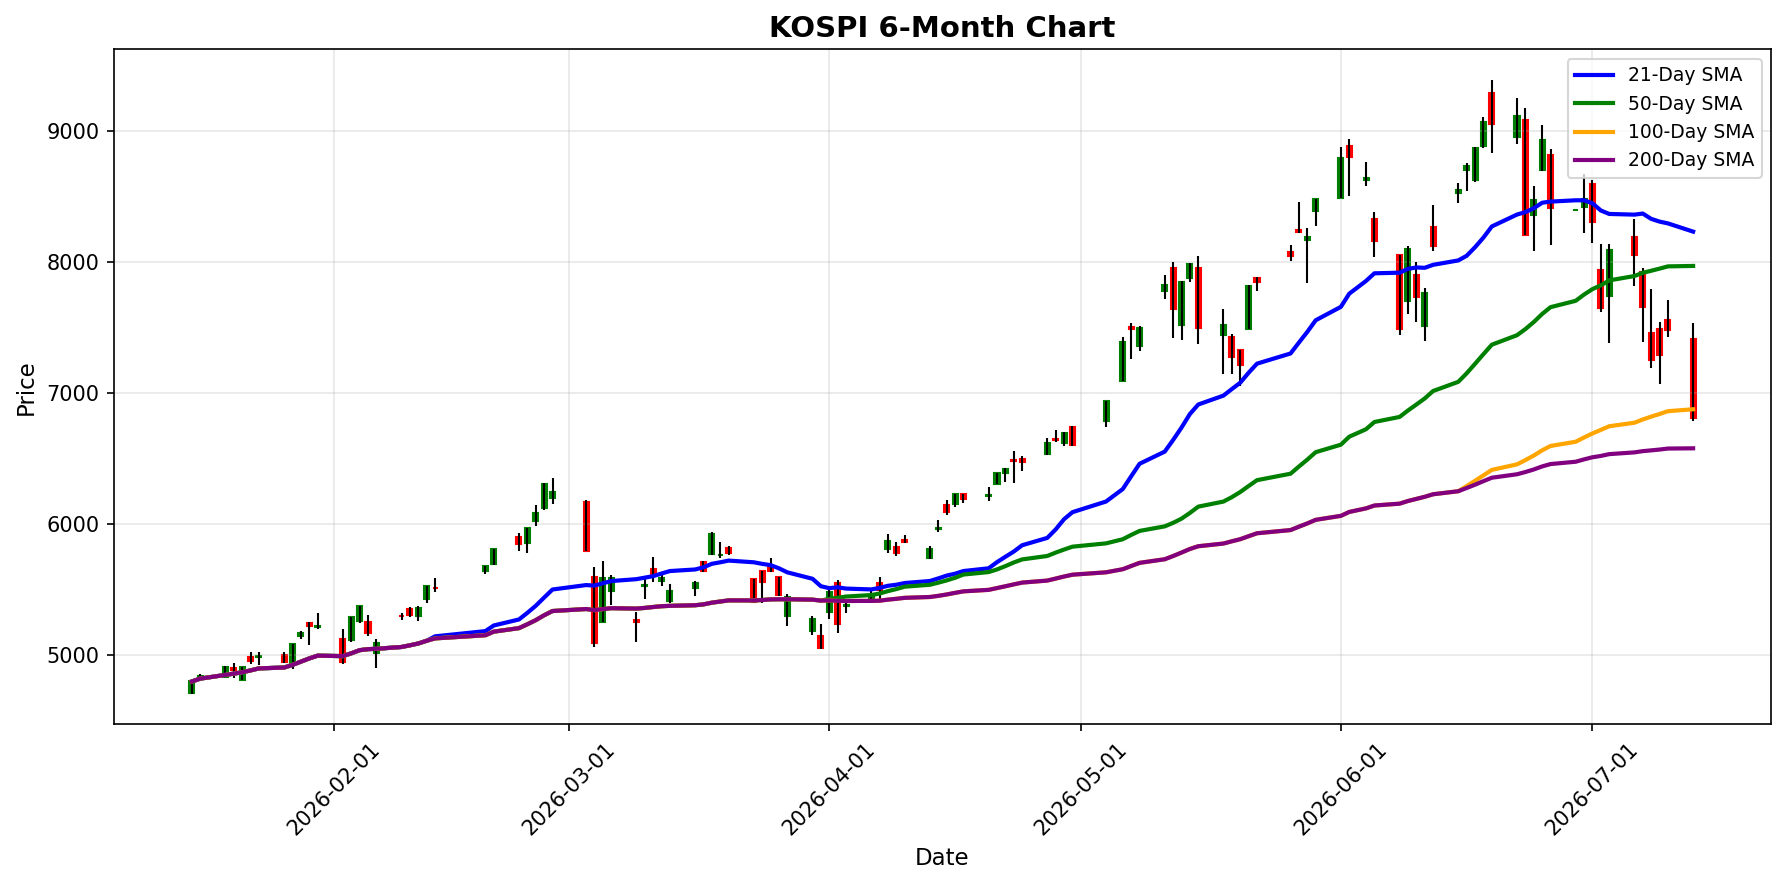
| KOSPI | 6,806.93 | -8.95% |
| S&P/ASX 200 | 8,808.50 | +0.03% |
| NIFTY 50 | 24,232.60 | +0.11% |
| Straits Times Index | 5,463.04 | -0.11% |
| S&P/NZX 50 | 13,723.20 | -0.45% |
| Thailand SET Index | 1,626.57 | +0.31% |
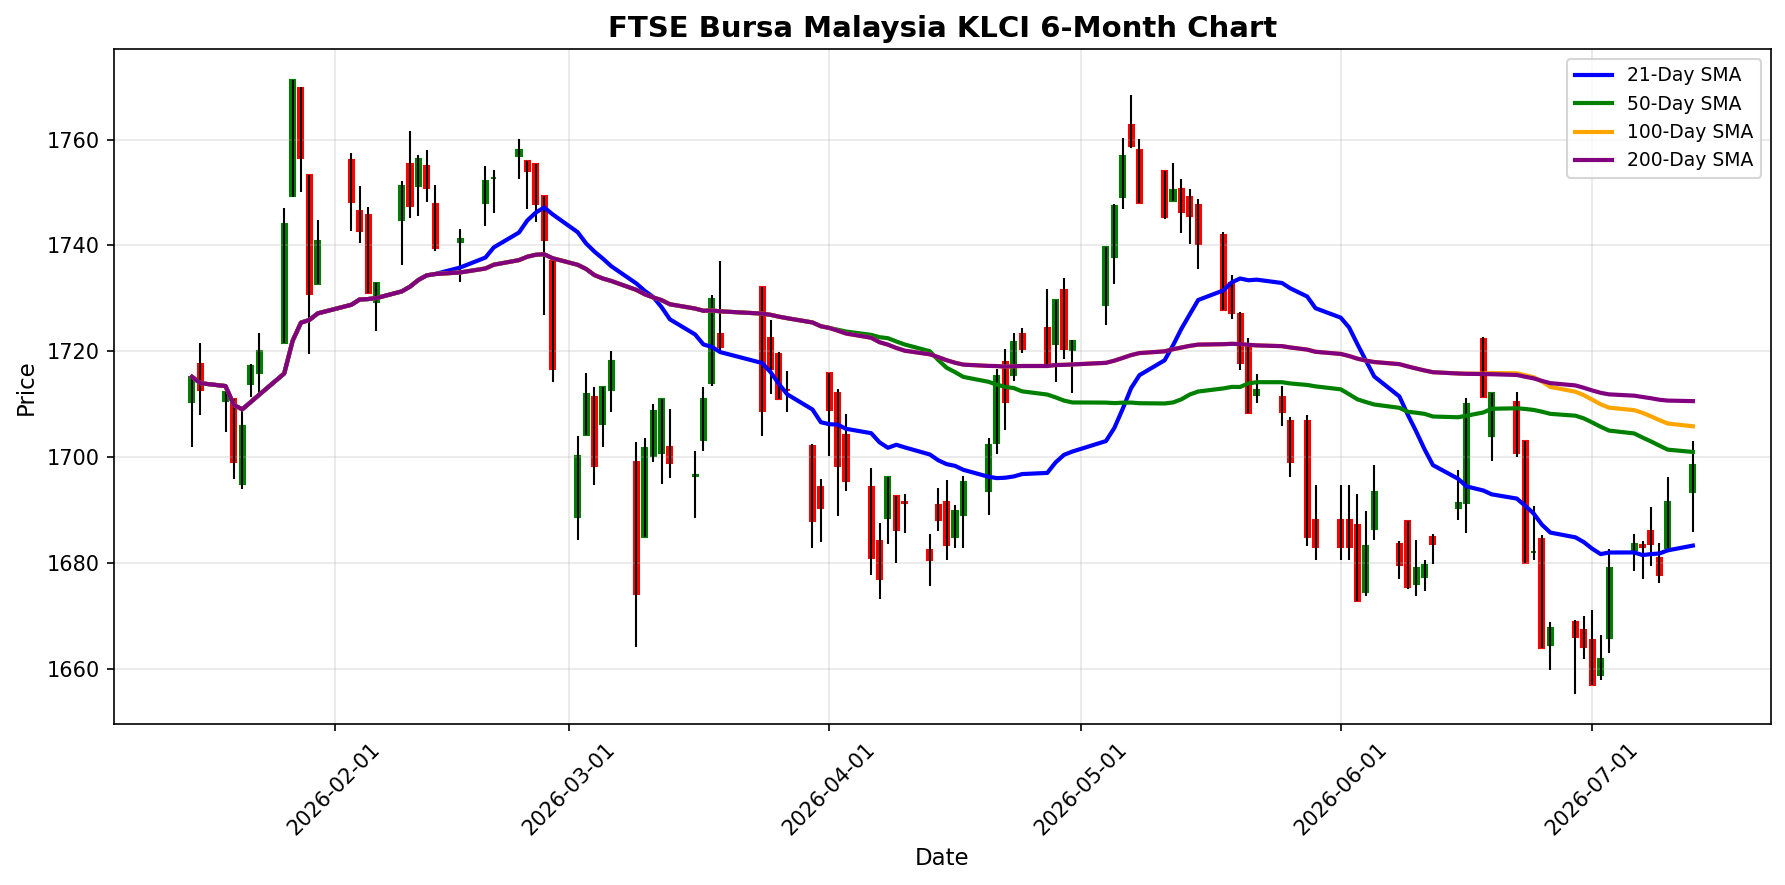
| FTSE Bursa Malaysia KLCI | 1,698.44 | +0.41% |
📰 Market Commentary
**Asian Market Summary - July 13, 2026** **Key Events Impacting Asian Indices:** Asian markets experienced a notable downturn today, primarily driven by profit-taking in technology stocks, particularly in Japan. The Nikkei 225 fell by 1.92%, while the Shanghai Composite dropped 2.06%. The decline in technology shares was exacerbated by rising geopolitical tensions related to U.S.-Iran hostilities, which led to a broader 'risk-off' sentiment among investors. Additionally, Typhoon Bavi's impact in northern China has caused significant disruptions, including school closures and flooding, contributing to a negative outlook in the region. **Market Sentiment and Price Movements:** Investor sentiment across Asian indices was predominantly bearish. The KOSPI in South Korea saw a significant decline of 8.95%, reflecting concerns over the tech sector's performance and broader economic uncertainties. The Shenzhen Component fell sharply by 3.48%. Conversely, the Hang Seng Index managed a slight gain of 0.16%, indicating some resilience in Hong Kong's market, likely supported by expectations surrounding HSBC's board-lot reform, which is anticipated to attract more retail investors. Other indices, such as the Straits Times Index and S&P/NZX 50, showed marginal declines, highlighting a cautious approach among investors amid prevailing uncertainties. **Regional Economic Developments:** In Vietnam, Techcombank is actively positioning itself to tap into the country’s $100 billion infrastructure opportunity, emphasizing the importance of digital financial infrastructure for economic growth. The recent Vietnam Financial Forum highlighted discussions on modernizing capital markets and improving access to finance, which could bolster investor confidence in the region. In Hong Kong, the upcoming board-lot reform for HSBC is expected to increase trading activity and interest in the stock, potentially revitalizing the market. Meanwhile, the impact of Typhoon Bavi in China has prompted emergency alerts and significant disruptions in the northeastern provinces, raising concerns about the economic implications of natural disasters on local markets. Overall, the Asian markets on July 13, 2026, reflected a complex interplay of profit-taking, geopolitical tensions, and regional economic initiatives, leading to a cautious market environment.
📅 Economic Calendar - Asian Session
All times are in US Eastern Time (ET)
| Date | Time | Cur | Imp | Event | Actual | Forecast |
|---|---|---|---|---|---|---|
| 2026-07-13 | 06:30 | 🇮🇳 | Medium | CPI (YoY) (Jun) | 4.30% |
On July 13, 2026, the Indian economy released its Consumer Price Index (CPI) data for June, which is a key indicator of inflation. The actual CPI (YoY) came in at 4.30%, aligning perfectly with the forecasted figure of 4.30%. **Market Implications:** - The CPI result meeting expectations suggests that inflation is stable, which may provide the Reserve Bank of India (RBI) with a rationale to maintain current monetary policy without immediate changes to interest rates. - Stability in inflation could bolster investor confidence, potentially supporting the Indian equity markets and indices such as the Nifty 50 and Sensex. - Traders might interpret this data as a signal for continued economic resilience, which could attract foreign investment and support the Indian Rupee (INR) against other currencies. Overall, the alignment of actual CPI with forecasts indicates a balanced inflationary environment, which is likely to have a positive impact on market sentiment in the region.
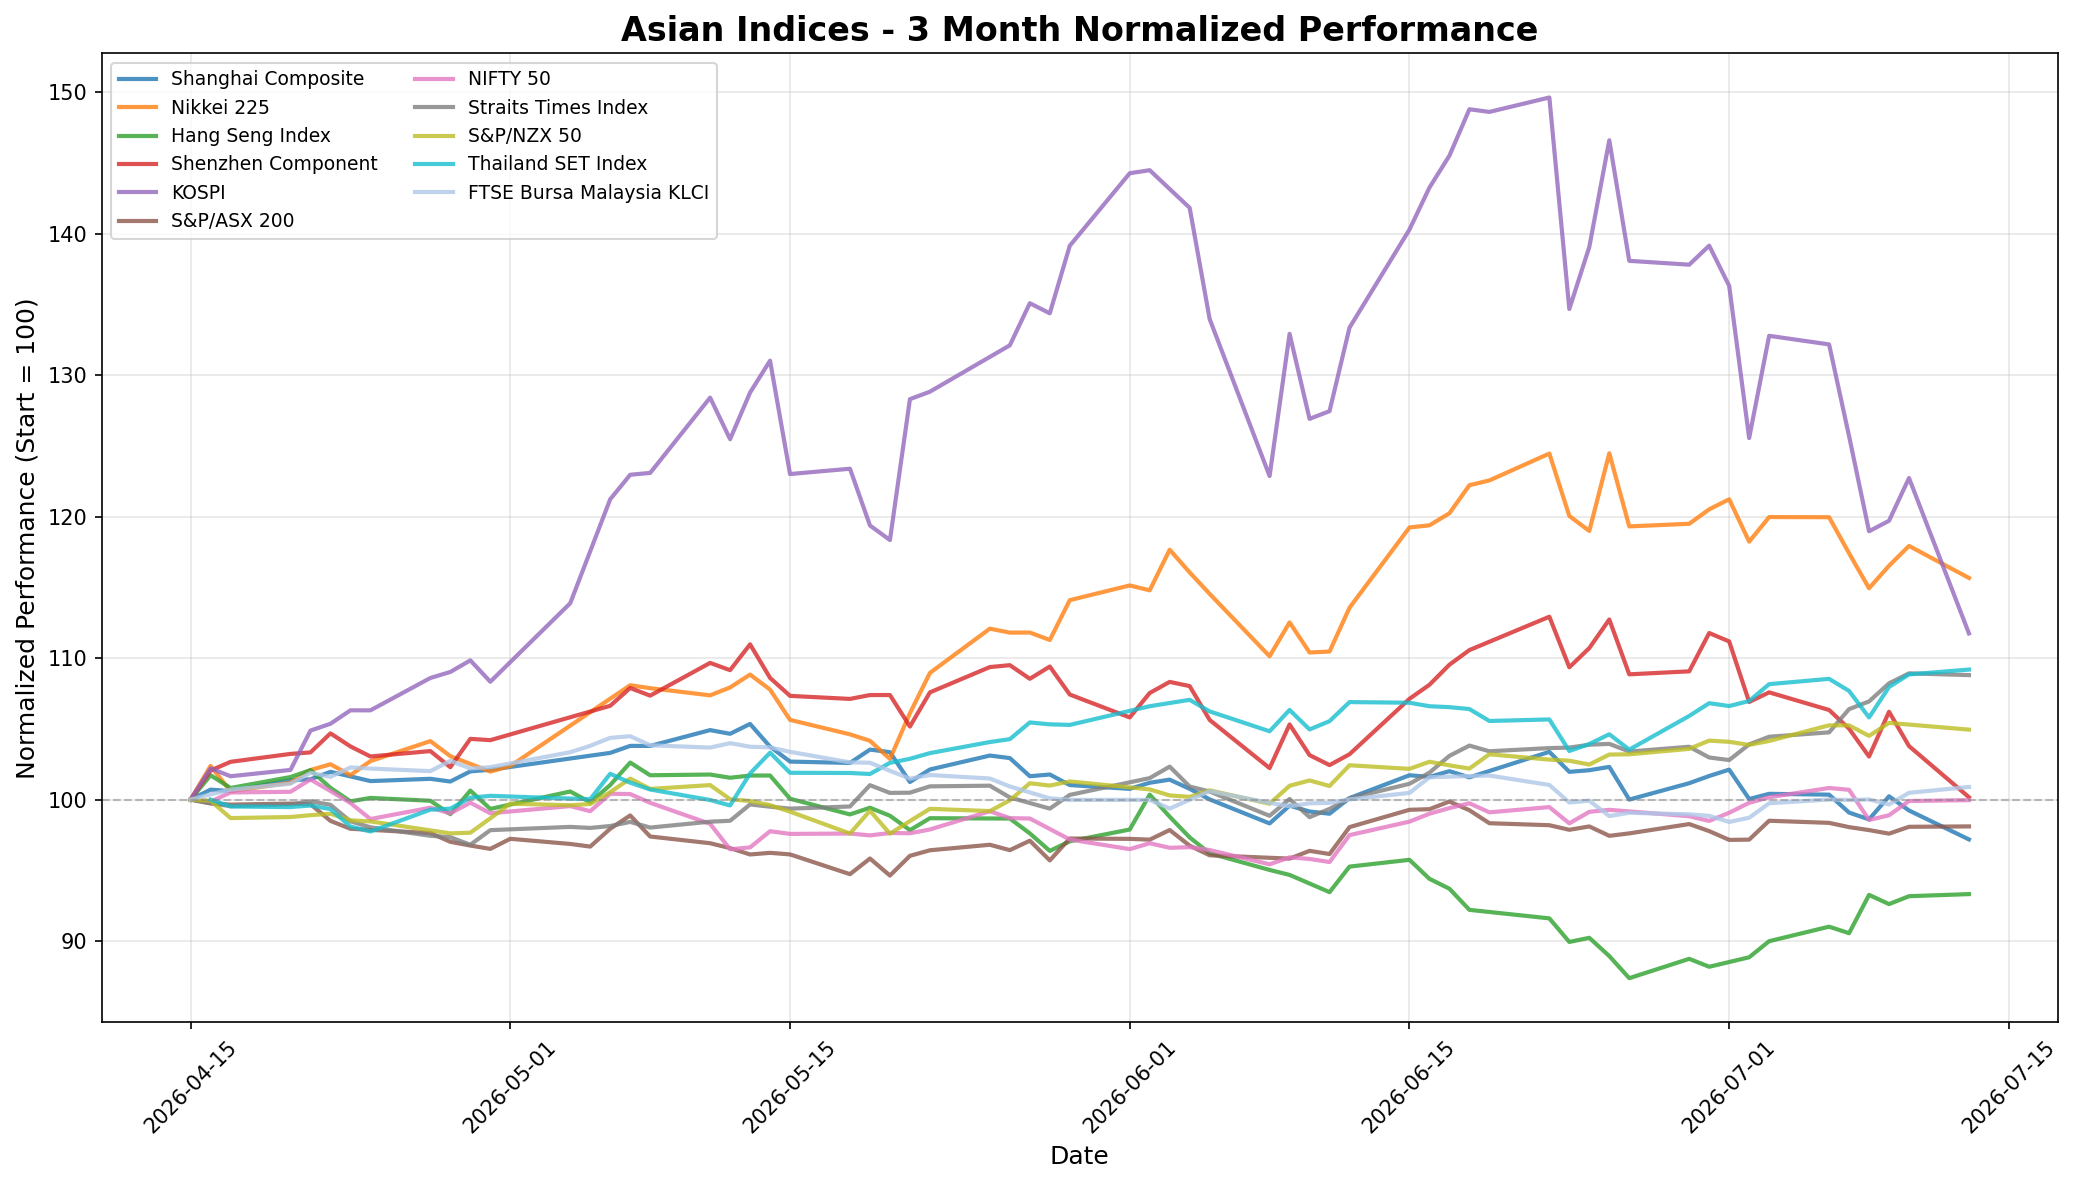
📈 Index Performance Charts
Best Performer: FTSE Bursa Malaysia KLCI
Worst Performer: KOSPI
💱 FX, Commodities & Crypto
### FX Market Summary **Key Price Movements:** - **USD/JPY** is trading at **161.9910**, reflecting a daily increase of **0.22%**. - **USD/CNY** shows a price of **6.7800**, with a daily change of **0.20%**. - **AUD/USD** has decreased to **0.6943**, marking a decline of **-0.17%**. - **NZD/USD** is up at **0.5781**, with a daily increase of **0.31%**. **Market Drivers:** The movements in the FX pairs are influenced by several factors, including: - **Interest Rate Differentials:** Expectations regarding interest rate changes by central banks, particularly the Federal Reserve and the Bank of Japan, are impacting the USD/JPY pair. - **Economic Data Releases:** Recent economic indicators from China may be affecting the USD/CNY exchange rate, contributing to its slight increase. - **Commodity Prices:** The performance of commodities, particularly those related to Australia and New Zealand, can influence the AUD/USD and NZD/USD pairs, with fluctuations in global demand impacting these currencies. - **Market Sentiment:** Overall market sentiment and risk appetite are also playing a role, with investors reacting to geopolitical developments and economic outlooks. ### Commodities and Cryptocurrencies No data available for commodities or cryptocurrencies at this time. Overall, the FX market is exhibiting mixed performance, with the US dollar showing strength against the JPY and CNY while the AUD is under pressure.
Currency Pairs
| Pair | Price | Daily Change (%) |
|---|---|---|
| USD/JPY | 161.99 | +0.22% |
| USD/CNY | 6.78 | +0.20% |
| AUD/USD | 0.69 | -0.17% |
| NZD/USD | 0.58 | +0.31% |
Disclaimer
The content on MarketsFN.com is provided for educational and informational purposes only. It does not constitute financial advice, investment recommendations, or trading guidance. All investments involve risks, and past performance does not guarantee future results. You are solely responsible for your investment decisions and should conduct independent research and consult a qualified financial advisor before acting. MarketsFN.com and its authors are not liable for any losses or damages arising from your use of this information.