**Bitcoin Plunges to $62K as RSI Hits Oversold at 12.4**
· Crypto · QuoteReporter
**Bitcoin Plunges to $62K as RSI Hits Oversold at 12.4**
Bitcoin (BTC/USD) | June 05, 2026 $62,342.0703 -2.29%
🔍 Technical Analysis
### Bitcoin (BTC) Technical Analysis
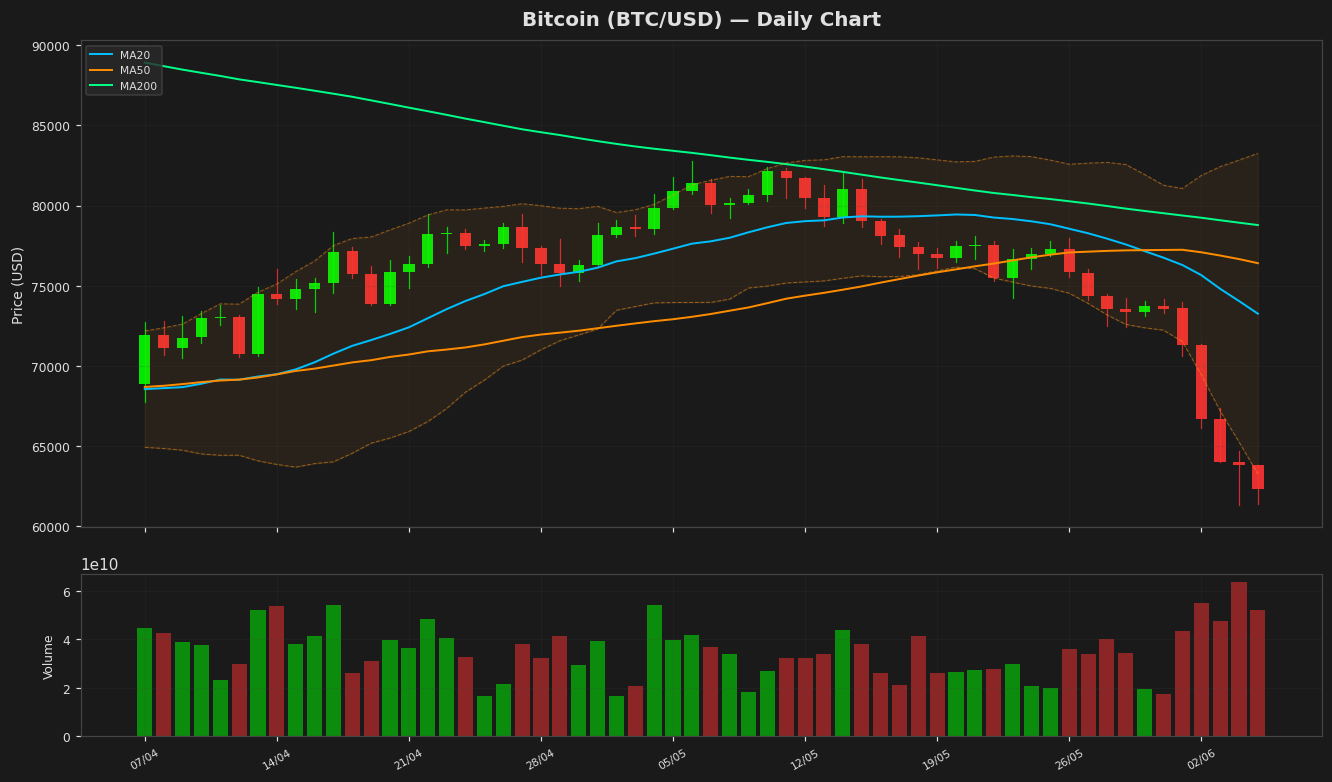
Bitcoin is currently trading at **$62,342**, down **2.29%** on the day, reflecting bearish momentum. The price remains below all key moving averages, with the **20-day MA at $73,257**, the **50-day MA at $76,407**, and the **200-day MA at $78,784**, indicating sustained downward pressure. The widening gap between price and these MAs suggests strong bearish dominance.
Bollinger Bands show **$83,256** as the upper band and **$63,259** as the lower band, with price hovering near the lower boundary, signaling potential oversold conditions. However, volatility remains elevated, as seen by the **ATR(14) at 2,348.75**, suggesting further price swings.
The **RSI(14) at 12.43** is deeply oversold, nearing historic lows, which could indicate a short-term bounce or consolidation. Meanwhile, the **MACD at -3,402.86** remains below its signal line (-1,966.07), reinforcing bearish momentum.
Key resistance levels to watch are the **20-day MA ($73,257)** and the psychological **$70,000** level. On the downside, immediate support lies at the **52-week low of $60,074**, followed by the **YTD low of $60,074**. A break below this could trigger further downside toward **$58,000**.
In summary, Bitcoin remains in a strong downtrend, but extreme oversold conditions on the RSI may lead to a temporary rebound. Traders should monitor whether the price can reclaim the **20-day MA** for any signs of trend reversal.
Technical Metrics
| Metric | Value |
|---|---|
| Current Price | $62,342.0703 |
| Daily Change | -2.29% |
| MA 20 | $73,257.4760 |
| % from MA20 | -14.90% |
| MA 50 | $76,407.3445 |
| % from MA50 | -18.41% |
| MA 200 | $78,783.9216 |
| % from MA200 | -20.87% |
| BB Upper | $83,256.0305 |
| % from BB Upper | -25.12% |
| BB Lower | $63,258.9214 |
| % from BB Lower | -1.45% |
| RSI (14) | 12.43 |
| MACD | -3402.863881 |
| MACD Signal | -1966.068702 |
| ATR (14) | 2348.750279 |
| 3-Day High | $67,402.9297 |
| 3-Day Low | $61,335.7500 |
| 52-Week High | $126,198.0703 |
| % from 52W High | -50.60% |
| 52-Week Low | $60,074.2031 |
| % from 52W Low | +3.78% |
| YTD High | $97,860.6016 |
| % from YTD High | -36.30% |
| YTD Low | $60,074.2031 |
| % from YTD Low | +3.78% |
📊 Market Commentary
Bitcoin (BTC) is currently trading at $62,342.07, down 2.29% today, as the market continues to exhibit bearish pressure. The Relative Strength Index (RSI) sits at an extremely oversold level of 12.4, signaling intense selling activity and potential exhaustion in the short term. BTC’s 52-week range of $60,074.20 to $126,198.07 highlights the significant volatility and downward trend over the past year, with the price now hovering near the lower boundary.
Market sentiment remains cautious, with traders closely monitoring the $60,000 support level. A breach below this psychological and technical threshold could trigger further downside momentum, while a hold above it may invite short-term buyers looking for oversold bounces. Liquidity remains a key focus, with derivatives markets showing elevated open interest and potential for heightened volatility.
Traders are also watching macroeconomic factors, including Federal Reserve policy signals and broader risk asset performance, which continue to influence Bitcoin’s price action. The current RSI reading suggests a possible relief rally, but without a clear catalyst, sustained recovery remains uncertain. The market is awaiting stronger signals—either a consolidation above $60,000 or a breakdown—to determine the next directional bias. For now, caution prevails as participants assess whether the oversold conditions will lead to a rebound or further declines.
Disclaimer
The content on MarketsFN.com is provided for educational and informational purposes only. It does not constitute financial advice or investment recommendations. All investments involve risk. Cryptocurrency markets are highly volatile. Past performance does not guarantee future results.