"BNB Dips to $591.90 as RSI Nears Oversold at 38.2"
· Crypto · QuoteReporter
"BNB Dips to $591.90 as RSI Nears Oversold at 38.2"
BNB (BNB/USD) | June 05, 2026 $591.9000 -1.93%
🔍 Technical Analysis
### Technical Analysis for BNB
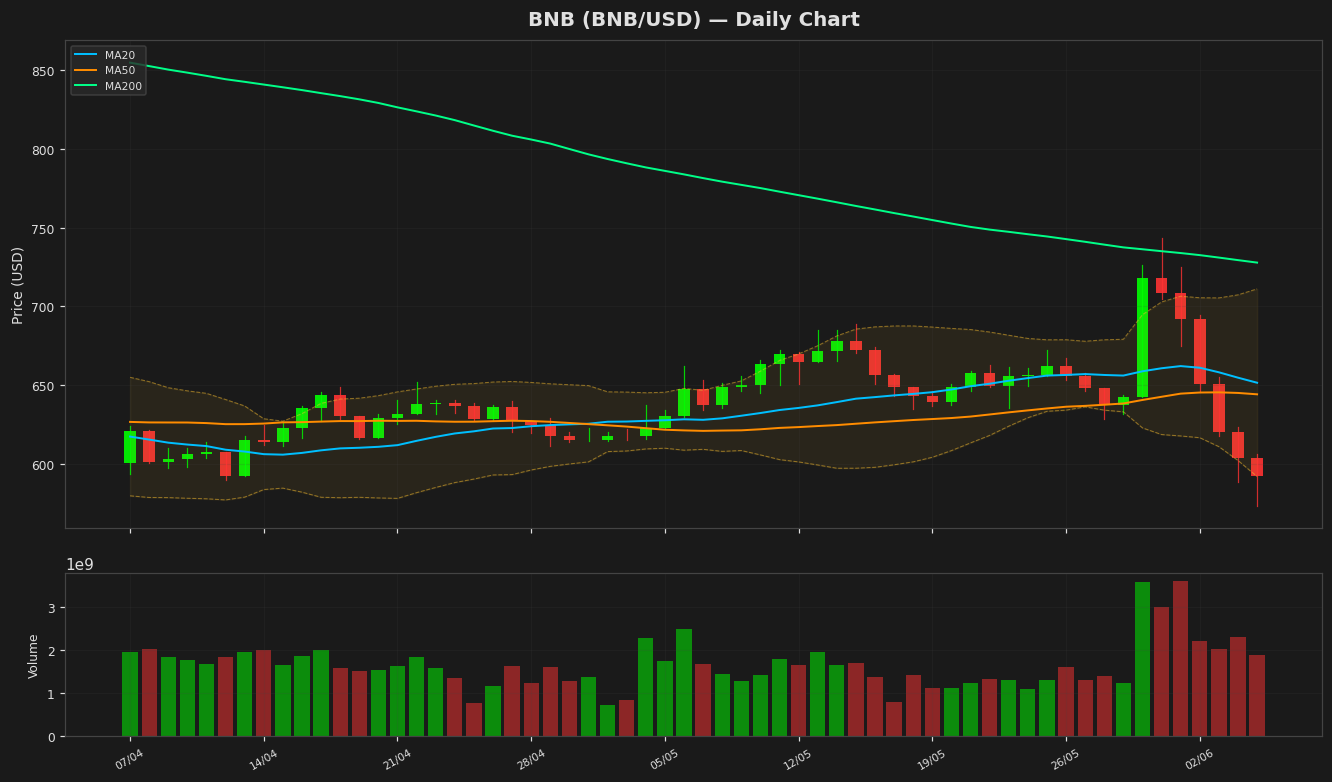
BNB is currently trading at **$591.90**, down **1.93%** on the day, reflecting bearish momentum. The price remains below all key moving averages—**MA20 ($651.46)**, **MA50 ($644.10)**, and **MA200 ($727.84)**—indicating sustained downward pressure. The widening gap between price and these averages reinforces a bearish trend.
Bollinger Bands show **upper band at $711.10** and **lower band at $591.82**, with price testing the lower band, suggesting potential oversold conditions. However, a sustained break below the lower band could signal further downside.
The **RSI (14) at 38.21** is nearing oversold territory but lacks strong bullish divergence, indicating weak buying interest. The **MACD (-5.08) remains below its signal line (3.42)**, confirming bearish momentum.
Key resistance levels are **$644.10 (MA50)** and **$711.10 (upper Bollinger Band)**, while immediate support lies at **$591.82 (lower Bollinger Band)**. A breakdown below this level may target **$570.68 (52-week low)**.
Given the **ATR (14) at 31.33**, volatility remains elevated, increasing the risk of sharp moves. Until BNB reclaims the MA20, the bias remains bearish. A close above **$651.46 (MA20)** could signal a short-term reversal.
Technical Metrics
| Metric | Value |
|---|---|
| Current Price | $591.9000 |
| Daily Change | -1.93% |
| MA 20 | $651.4600 |
| % from MA20 | -9.14% |
| MA 50 | $644.0982 |
| % from MA50 | -8.10% |
| MA 200 | $727.8419 |
| % from MA200 | -18.68% |
| BB Upper | $711.1024 |
| % from BB Upper | -16.76% |
| BB Lower | $591.8176 |
| % from BB Lower | +0.01% |
| RSI (14) | 38.21 |
| MACD | -5.084983 |
| MACD Signal | 3.424585 |
| ATR (14) | 31.334150 |
| 3-Day High | $655.1470 |
| 3-Day Low | $572.9453 |
| 52-Week High | $1,370.5460 |
| % from 52W High | -56.81% |
| 52-Week Low | $570.6840 |
| % from 52W Low | +3.72% |
| YTD High | $954.8583 |
| % from YTD High | -38.01% |
| YTD Low | $570.6840 |
| % from YTD Low | +3.72% |
📊 Market Commentary
BNB is currently trading at $591.90, down 1.93% today, as the broader crypto market shows mixed sentiment. The Relative Strength Index (RSI) at 38.2 indicates BNB is approaching oversold territory but has not yet entered it, suggesting room for further downside if bearish momentum persists. Over the past 52 weeks, BNB has fluctuated between $570.68 and $1,370.55, with the current price near the lower end of this range, reflecting a challenging year for the token.
Market sentiment around BNB remains cautious, influenced by regulatory uncertainties and broader macroeconomic conditions affecting crypto assets. Traders are closely watching the $570 support level, a critical psychological and technical zone. A sustained break below this level could trigger further selling pressure, while a rebound may signal short-term accumulation. On the upside, resistance is seen near $620, a level that has previously acted as both support and resistance in recent weeks.
Volume trends and institutional interest in BNB will be key factors to monitor, as low liquidity could exacerbate price swings. Additionally, developments related to Binance’s ecosystem, including new product launches or regulatory updates, may impact trader sentiment. For now, the market appears to be in a consolidation phase, with traders awaiting clearer signals before committing to stronger directional bets.
Disclaimer
The content on MarketsFN.com is provided for educational and informational purposes only. It does not constitute financial advice or investment recommendations. All investments involve risk. Cryptocurrency markets are highly volatile. Past performance does not guarantee future results.