Brent Oil: Down 1.0% to $72.20 — Oversold at RSI 28 — Watching for Bounce
· Commodities · QuoteReporter
Brent Oil: Down 1.0% to $72.20 — Oversold at RSI 28 — Watching for Bounce
Analysis Date: July 01, 2026
📊 Current Market Data
CURRENT PRICE
$72.20
DAILY CHANGE
-0.99%
WEEKLY CHANGE
-2.09%
52W HIGH
$126.10
52W LOW
$58.72
💡 Key Market Factors
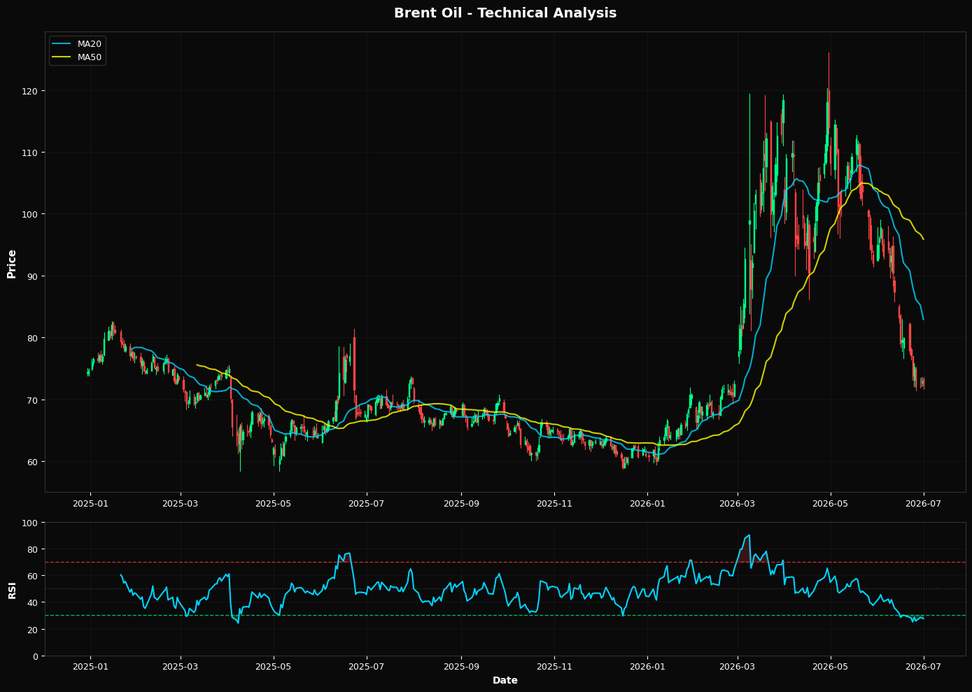
Brent Oil is teetering on the edge of a significant technical breakdown, with its price at $72.20, well below critical moving averages and support levels. The most pressing macro driver impacting Brent Oil today is the strength of the U.S. dollar. As the Federal Reserve maintains a hawkish stance on interest rates, the dollar remains robust, exerting downward pressure on oil prices. A strong dollar makes oil more expensive for holders of other currencies, dampening demand. This dynamic is crucial as it directly influences Brent's ability to recover from its current slump. From a technical perspective, Brent Oil is in a precarious position. The Relative Strength Index (RSI) at 27.5 indicates that the commodity is deeply oversold, suggesting potential for a rebound. However, the price is significantly below the 20-day moving average of $82.91, the 50-day moving average of $95.87, and the 200-day moving average of $78.70. This bearish alignment of moving averages underscores a strong downward trend. Furthermore, the nearest Fibonacci support at 61.8% is at $84.46, far above the current price, indicating that Brent is struggling to find a foothold. The technical setup suggests a bearish bias unless a catalyst emerges to reverse the trend. A key risk that could alter Brent Oil's trajectory is a shift in OPEC+ production policy. If the cartel decides to cut production more aggressively than anticipated, it could tighten supply and provide a much-needed boost to prices. The market may be underpricing the potential for such a move, given the current focus on demand-side concerns driven by economic slowdown fears. An unexpected announcement from OPEC+ could catch the market off guard, leading to a sharp price reversal. Looking ahead, the upcoming U.S. inflation data release will be pivotal. If inflation shows signs of cooling, it could prompt the Federal Reserve to reconsider its rate hike trajectory, potentially weakening the dollar and providing relief to Brent Oil prices. Conversely, persistently high inflation would likely reinforce the Fed's current policy path, maintaining pressure on oil. This data point will be critical in confirming or invalidating the current bearish outlook for Brent Oil.📈 Technical Indicators Summary
RSI (14)
27.5
50-Day MA
$95.87
200-Day MA
$78.70
Fib Level
61.8%
📊 Technical Analysis Chart (18-Month View)
📐 Fibonacci Retracement Analysis
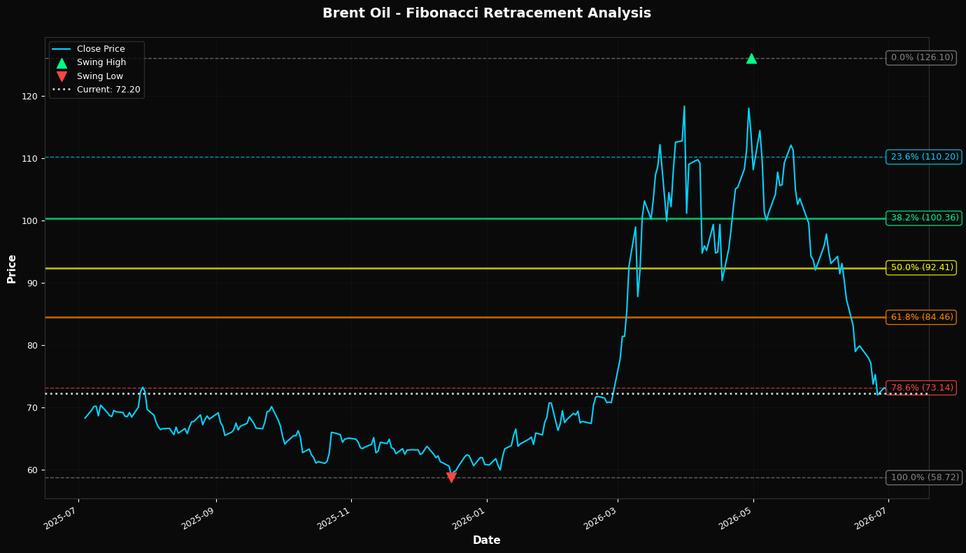
🎯 Key Trading Levels
Key Fibonacci Levels:
- 38.2%: $100.36
- 50.0%: $92.41
- 61.8%: $84.46
Support: $58.72 (Swing Low), $95.87 (50-Day MA)
Resistance: $126.10 (Swing High)
Disclaimer
The content on MarketsFN.com is provided for educational and informational purposes only. It does not constitute financial advice, investment recommendations, or trading guidance. All investments involve risks, and past performance does not guarantee future results. You are solely responsible for your investment decisions and should conduct independent research and consult a qualified financial advisor before acting. MarketsFN.com and its authors are not liable for any losses or damages arising from your use of this information.