Corn: Down 0.7% to $443.50 — Testing 38.2% Fibonacci Support
· Commodities · QuoteReporter
Corn: Down 0.7% to $443.50 — Testing 38.2% Fibonacci Support
Analysis Date: June 01, 2026
📊 Current Market Data
CURRENT PRICE
$443.50
DAILY CHANGE
-0.73%
WEEKLY CHANGE
-4.26%
52W HIGH
$481.75
52W LOW
$368.75
💡 Key Market Factors
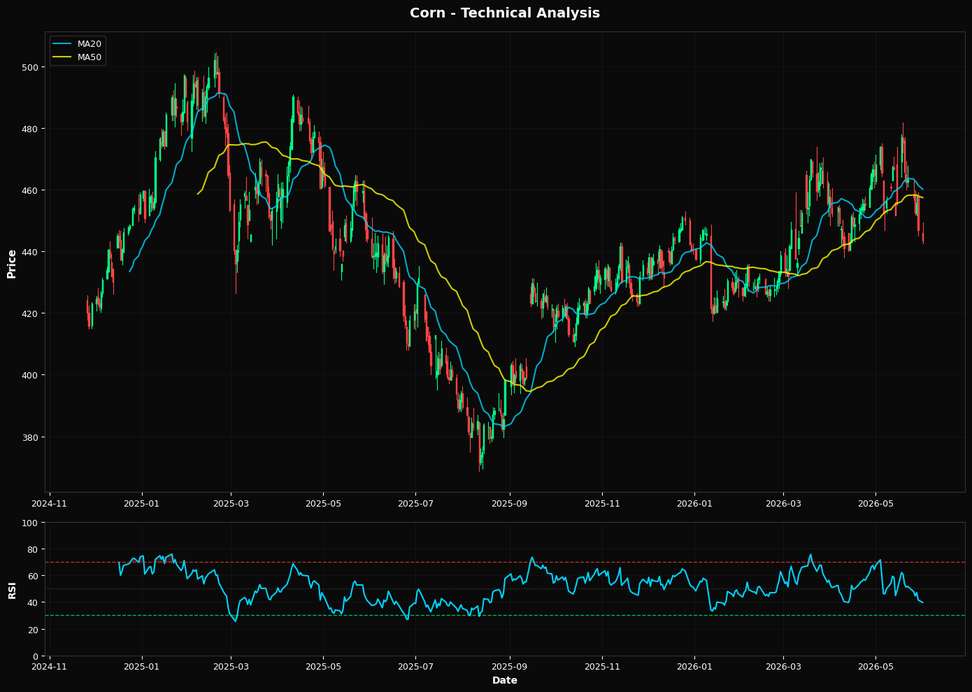
Corn prices are under pressure, with the most critical factor being the strength of the U.S. dollar. As corn is priced in dollars, a stronger USD makes it more expensive for foreign buyers, reducing demand. Currently, the dollar's strength is largely driven by the Federal Reserve's hawkish stance on interest rates, which is aimed at curbing inflation. This policy environment is likely to continue weighing on corn prices, as the Fed shows no signs of easing its rate hikes in the near term. The market may be underestimating the persistence of a strong dollar, which could further suppress corn demand globally. From a technical perspective, corn is showing bearish signals. The Relative Strength Index (RSI) at 39.6 suggests that corn is approaching oversold territory, but not quite there yet. The price of $443.50 is below both the 20-day moving average of $460.11 and the 50-day moving average of $457.38, indicating a short-term downtrend. However, it remains above the 200-day moving average of $433.90, suggesting that the long-term trend is still intact. The nearest Fibonacci support level at $438.58 is crucial; a breach below this could accelerate the downward momentum. Given these technical indicators, the directional bias for corn remains bearish in the short term. A key risk that could alter this bearish outlook is a sudden change in U.S. monetary policy. If the Federal Reserve signals a pause or reversal in its rate hikes, the dollar could weaken, making U.S. corn more attractive to international buyers. This would likely provide a boost to corn prices. Additionally, any unexpected geopolitical events that disrupt supply chains or affect global grain markets could also serve as a catalyst for price changes. Looking ahead, the upcoming Federal Open Market Committee (FOMC) meeting will be pivotal. Any dovish signals from the Fed could weaken the dollar and provide relief to corn prices. Conversely, if the Fed maintains its current trajectory, the bearish pressure on corn is likely to persist. Investors should closely monitor the Fed's language and any economic data releases that could influence its policy decisions.📈 Technical Indicators Summary
RSI (14)
39.6
50-Day MA
$457.38
200-Day MA
$433.90
Fib Level
38.2%
📊 Technical Analysis Chart (18-Month View)
📐 Fibonacci Retracement Analysis
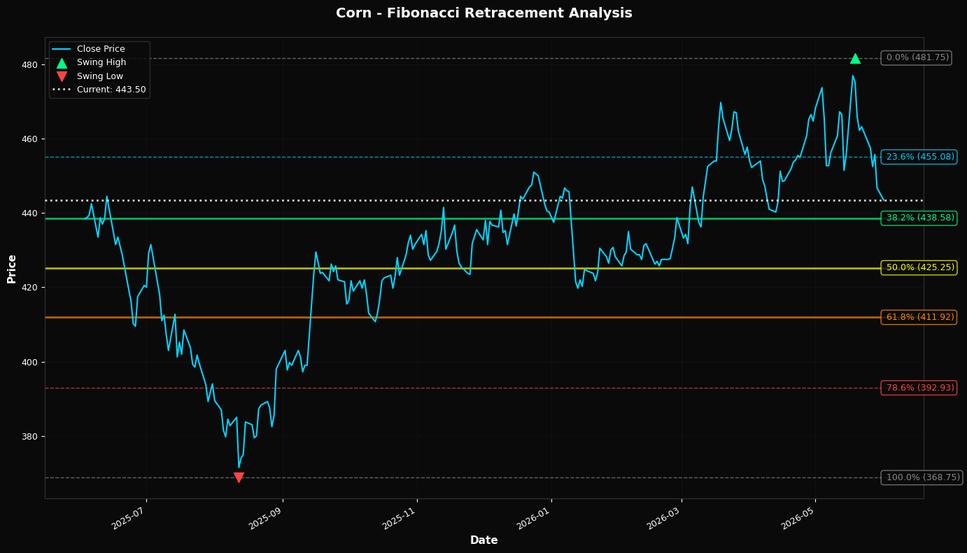
🎯 Key Trading Levels
Key Fibonacci Levels:
- 38.2%: $438.58
- 50.0%: $425.25
- 61.8%: $411.92
Support: $368.75 (Swing Low), $457.38 (50-Day MA)
Resistance: $481.75 (Swing High)
Disclaimer
The content on MarketsFN.com is provided for educational and informational purposes only. It does not constitute financial advice, investment recommendations, or trading guidance. All investments involve risks, and past performance does not guarantee future results. You are solely responsible for your investment decisions and should conduct independent research and consult a qualified financial advisor before acting. MarketsFN.com and its authors are not liable for any losses or damages arising from your use of this information.