Corn: Up 5.3% to $443.50 — Testing 38.2% Fibonacci Support
· Commodities · QuoteReporter
Corn: Up 5.3% to $443.50 — Testing 38.2% Fibonacci Support
Analysis Date: July 02, 2026
📊 Current Market Data
CURRENT PRICE
$443.50
DAILY CHANGE
+5.34%
WEEKLY CHANGE
+6.93%
52W HIGH
$481.75
52W LOW
$368.75
💡 Key Market Factors
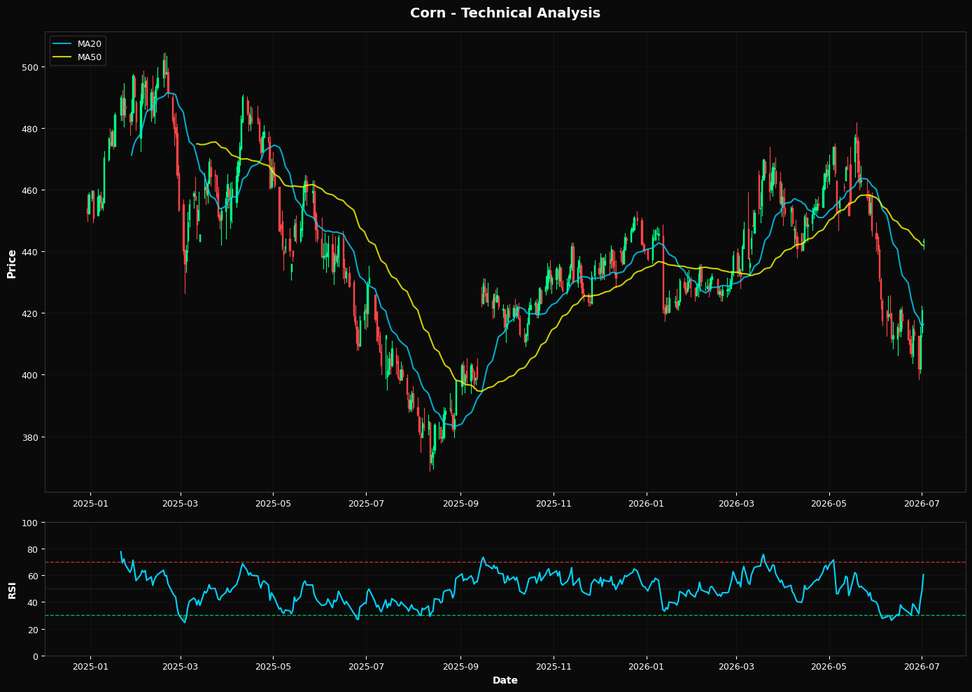
Corn prices are poised for further gains, driven by a combination of technical momentum and macroeconomic tailwinds. The most critical factor currently influencing corn is the weakening U.S. dollar, which enhances the competitiveness of U.S. agricultural exports. As the Federal Reserve signals a potential pause in rate hikes, the dollar's depreciation could continue, making U.S. corn more attractive on the global market. This dynamic is crucial as it directly impacts the purchasing power of foreign buyers, potentially boosting demand for U.S. corn exports. From a technical perspective, corn is exhibiting bullish signals. The current price of $443.50 is above both the 50-day moving average of $441.83 and the 200-day moving average of $436.69, indicating a positive trend. The Relative Strength Index (RSI) at 60.6 suggests that corn is not yet overbought, leaving room for further upward movement. Additionally, the price has recently surpassed the nearest Fibonacci support level at $438.58, reinforcing the bullish outlook. These technical indicators suggest that corn could continue to rally, potentially testing the 52-week high of $481.75 if momentum persists. A key risk to this bullish scenario is the upcoming U.S. Department of Agriculture (USDA) report on crop yields. Should the report indicate higher-than-expected yields, it could alleviate supply concerns and exert downward pressure on prices. Conversely, any indication of reduced yields could further tighten supply and propel prices higher. The market may currently be underestimating the potential impact of this report, given the recent focus on macroeconomic factors. Looking ahead, the next major catalyst will be the release of the USDA report. Confirmation of lower yields would validate the current bullish trend and could lead to a significant price rally. Conversely, higher yields could invalidate the current upward trajectory, prompting a reassessment of the supply-demand balance. Investors should closely monitor this report, as it will provide critical insights into the future direction of corn prices.📈 Technical Indicators Summary
RSI (14)
60.6
50-Day MA
$441.83
200-Day MA
$436.69
Fib Level
38.2%
📊 Technical Analysis Chart (18-Month View)
📐 Fibonacci Retracement Analysis
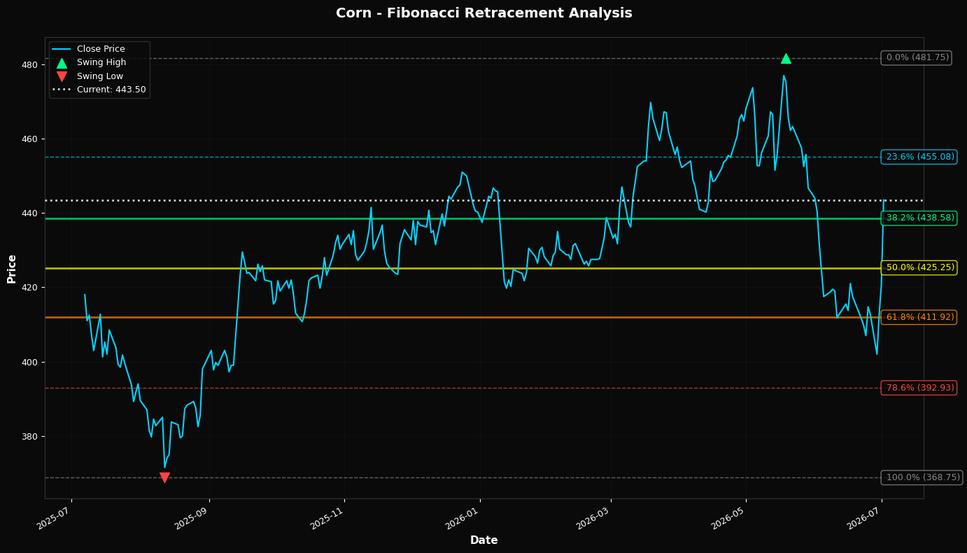
🎯 Key Trading Levels
Key Fibonacci Levels:
- 38.2%: $438.58
- 50.0%: $425.25
- 61.8%: $411.92
Support: $368.75 (Swing Low), $441.83 (50-Day MA)
Resistance: $481.75 (Swing High)
Disclaimer
The content on MarketsFN.com is provided for educational and informational purposes only. It does not constitute financial advice, investment recommendations, or trading guidance. All investments involve risks, and past performance does not guarantee future results. You are solely responsible for your investment decisions and should conduct independent research and consult a qualified financial advisor before acting. MarketsFN.com and its authors are not liable for any losses or damages arising from your use of this information.