Wheat: Up 1.6% to $601.50 — Testing 38.2% Fibonacci Support
· Commodities · QuoteReporter
Wheat: Up 1.6% to $601.50 — Testing 38.2% Fibonacci Support
Analysis Date: July 02, 2026
📊 Current Market Data
CURRENT PRICE
$601.50
DAILY CHANGE
+1.60%
WEEKLY CHANGE
+1.78%
52W HIGH
$679.50
52W LOW
$492.25
💡 Key Market Factors
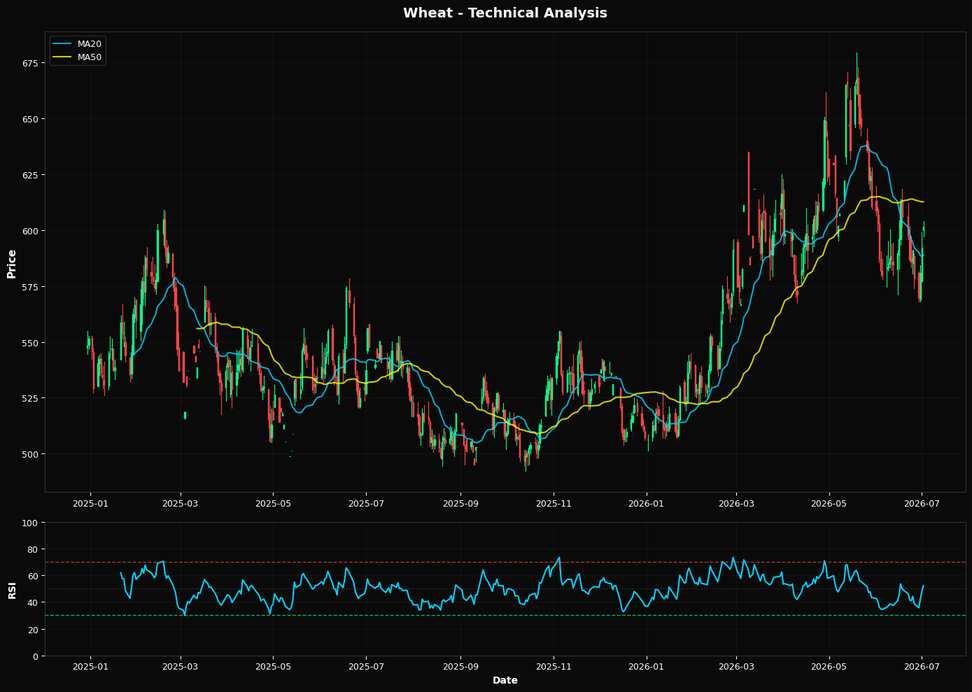
Wheat prices are poised for a potential breakout, driven by a confluence of technical indicators and macroeconomic factors. The most critical macro driver currently impacting wheat is the strength of the U.S. dollar. As the Federal Reserve maintains a hawkish stance on interest rates, the dollar has remained robust, exerting downward pressure on commodity prices, including wheat. However, with wheat's price at $601.50, showing a daily increase of +1.60% and a weekly gain of +1.78%, there are signs that the market may be underestimating the resilience of wheat demand in the face of a strong dollar. If the dollar weakens or stabilizes, wheat prices could see further upward momentum. From a technical perspective, wheat is in a precarious yet promising position. The Relative Strength Index (RSI) at 52.2 suggests a neutral stance, indicating that the market is neither overbought nor oversold. However, the price is currently above the 20-day moving average (MA20) of $588.81 but below the 50-day moving average (MA50) of $612.59, suggesting a potential bullish crossover if the price continues to rise. The 200-day moving average (MA200) at $559.84 provides a solid support level, reinforcing the upward trend. The nearest Fibonacci support at 38.2% is $607.97, which, if breached, could signal a continuation towards the 52-week high of $679.50. The technical setup indicates a bullish bias, with the potential for a breakout if the price surpasses the MA50. A key risk that could alter the current trajectory of wheat prices is geopolitical developments affecting global supply chains. Any disruption in major wheat-producing regions, such as adverse weather conditions or political instability, could significantly impact supply and drive prices higher. Conversely, a resolution to ongoing geopolitical tensions could stabilize supply and temper price increases. The market may be underpricing the potential for such disruptions, given the current focus on macroeconomic factors like the dollar and interest rates. Looking ahead, the upcoming U.S. inflation data release will be a critical catalyst. If inflation figures come in higher than expected, it could prompt further dollar strength, potentially capping wheat's upward momentum. Conversely, lower-than-expected inflation could weaken the dollar, providing a tailwind for wheat prices. This data point will be pivotal in confirming or invalidating the current bullish technical setup and determining the next directional move for wheat.📈 Technical Indicators Summary
RSI (14)
52.2
50-Day MA
$612.59
200-Day MA
$559.84
Fib Level
38.2%
📊 Technical Analysis Chart (18-Month View)
📐 Fibonacci Retracement Analysis
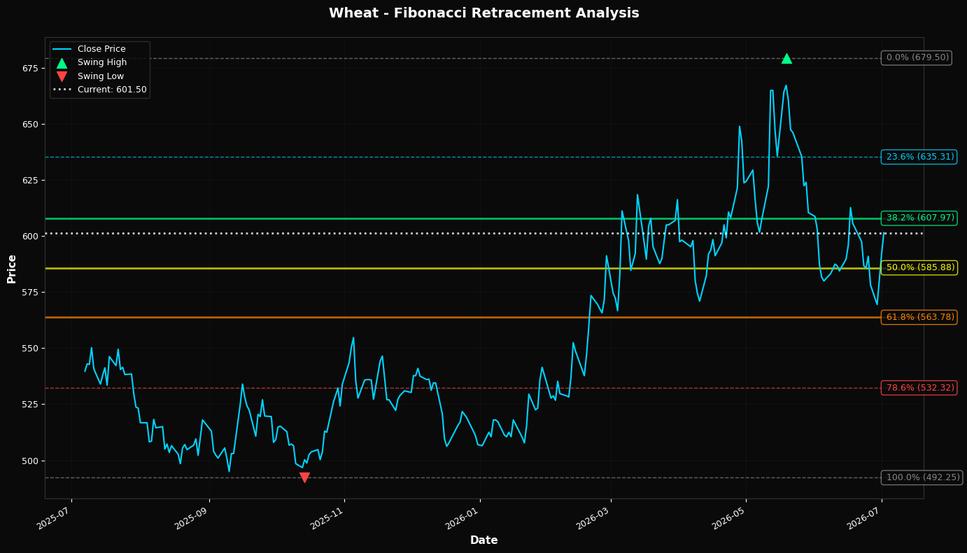
🎯 Key Trading Levels
Key Fibonacci Levels:
- 38.2%: $607.97
- 50.0%: $585.88
- 61.8%: $563.78
Support: $492.25 (Swing Low), $612.59 (50-Day MA)
Resistance: $679.50 (Swing High)
Disclaimer
The content on MarketsFN.com is provided for educational and informational purposes only. It does not constitute financial advice, investment recommendations, or trading guidance. All investments involve risks, and past performance does not guarantee future results. You are solely responsible for your investment decisions and should conduct independent research and consult a qualified financial advisor before acting. MarketsFN.com and its authors are not liable for any losses or damages arising from your use of this information.