Crypto Market Plummets: Ethereum, Dogecoin, and Solana Lead Losses Today
· Crypto · QuoteReporter
Crypto Market Plummets: Ethereum, Dogecoin, and Solana Lead Losses Today
Crypto Market Report | June 05, 2026
📊 Crypto Market Overview
The cryptocurrency market is currently experiencing a downturn, with major assets such as Bitcoin and Ethereum witnessing significant declines. Bitcoin's price has dropped to $62,543.8594, representing a 1.97% decrease over the past 24 hours, while Ethereum has fallen by 5.33% to $1,675.3500. Other notable cryptocurrencies, including Solana and Dogecoin, have also seen substantial losses, with Solana decreasing by 3.48% to $66.3300 and Dogecoin dropping by 4.24% to $0.0846.
From a technical analysis perspective, several key indicators suggest that the market is in a state of oversold conditions. Bitcoin's Relative Strength Index (RSI) has fallen to 12.6, while Ethereum's RSI is at 14.1, and Solana's RSI is at 9.0. These low RSI values indicate that the market may be due for a potential rebound. Additionally, the Moving Average Convergence Divergence (MACD) indicators for these assets are also signaling bearish trends, with Bitcoin's MACD at -3386.7667 and Ethereum's MACD at -115.4312.
The current market sentiment is largely influenced by the macroeconomic context and recent news headlines. The recent outflows from US Bitcoin and Ether ETFs have ended their record multibillion outflow streak, which may be seen as a positive sign. However, the overall market is still under pressure, with several major banks, including JPMorgan and Bank of America, announcing plans to start a blockchain offensive with a shared tokenized network. The regulatory environment is also being closely watched, with Senate Republicans pushing finance watchdogs to clarify crypto capital rules. Overall, the cryptocurrency market is currently experiencing a period of heightened volatility, with several key assets testing critical price levels.
📰 Crypto News
- Crypto billionaires bankroll Nigel Farage's pro-crypto party
- Strategy’s leveraged Bitcoin model has faced its first stress test: Grayscale
- Anthropic says self-improving AI may be closer than expected
- ZEC drops 30% as Shielded Labs reveals more about infinite counterfeit bug
- Senate Republicans push finance watchdogs to clarify crypto capital rules
- Crypto's worst week since July 2024 deepens as bitcoin, ether near critical price levels
- JPMorgan, Bank of America, Citi to start blockchain offensive with shared tokenized network
- U.S. bitcoin, ether ETFs end record multibillion outflow streak
- Here's what could happen if bitcoin breaks below $60,000
- Bitcoin in danger of dropping to $60,000, with Zcash bulls turning their backs on ZEC
- Bitcoin plunges to near $62,000 as the AI trade unwinds, HYPE falls 14%
- Zcash plummets 38% as Shielded Labs reveals a major bug that went undetected for four years
- ZEC Crashes 38% as Zcash Discloses ‘Critical Counterfeiting Vulnerability’
🔍 Technical Analysis
Bitcoin (BTC) — -1.97%
$62,543.86 52W: $60,074.20 — $126,198.07
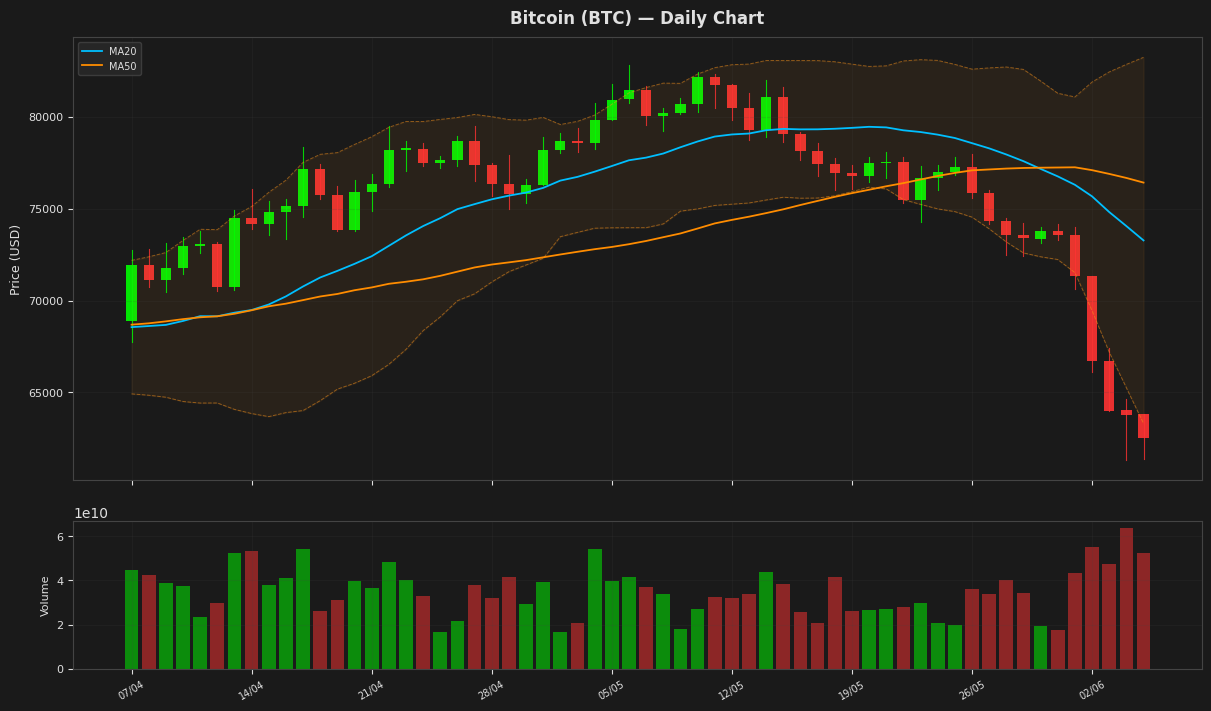
Bitcoin's price is currently at $62,543, showing a daily decline of 1.97% and sitting near the lower Bollinger Band at $63,315, indicating potential oversold conditions as the RSI(14) has dropped to 12.572, suggesting a possible reversal. The MACD is below its signal line, reinforcing the bearish sentiment. The ATR(14) indicates high volatility, and the price is closer to the 52-week low than the high.
Ethereum (ETH) — -5.33%
$1,675.35 52W: $1,636.86 — $4,755.22
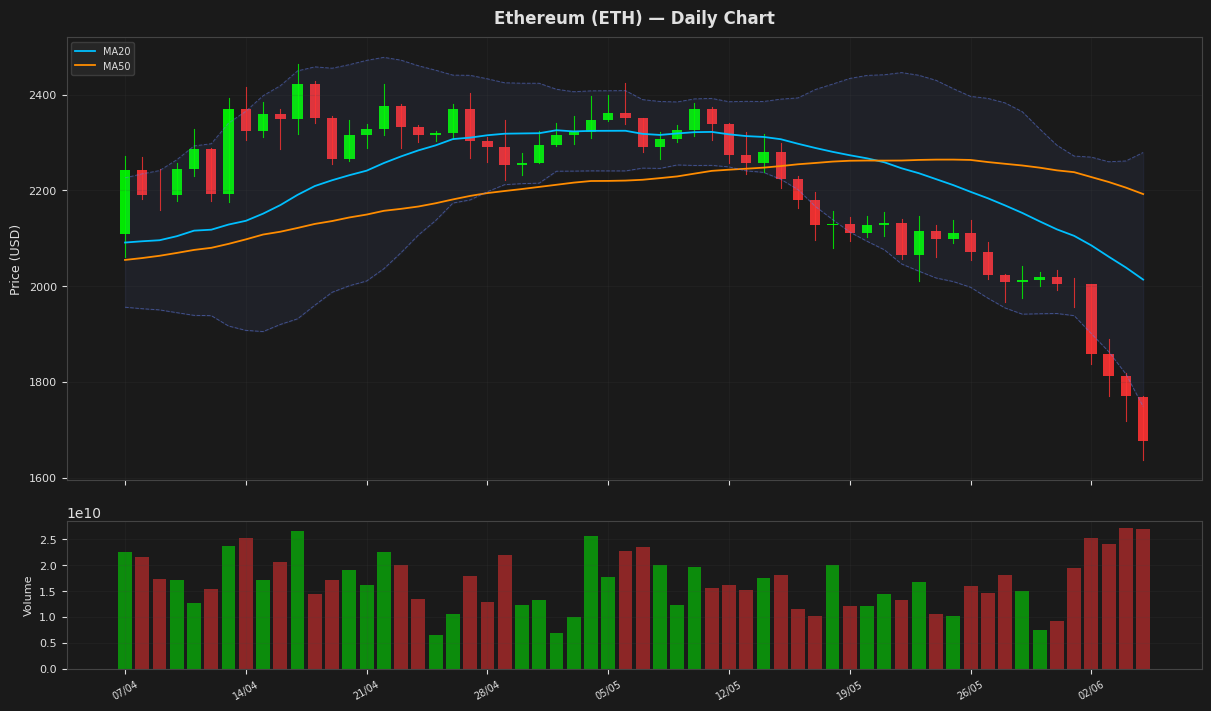
Ethereum's price is currently at $1,675.35, showing a daily decline of 5.33% and hovering near the lower Bollinger Band at $1,748.00, indicating oversold conditions as also reflected by the RSI(14) value of 14.12. The MACD is below its signal line, suggesting a bearish trend. The price is also close to its 52-week low of $1,636.86.
Ripple (XRP) — -2.65%
$1.1357 52W: $1.0978 — $3.0993
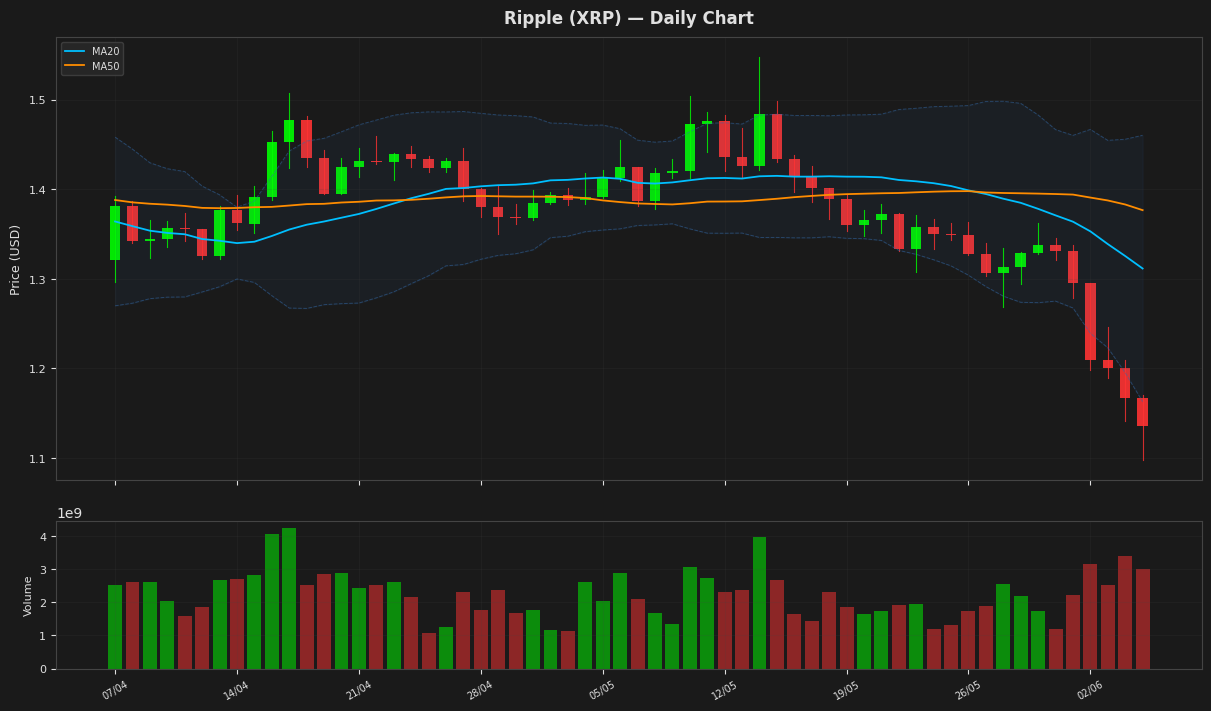
Ripple's price is currently at $1.135700, showing a daily decline of 2.65% and trading near the lower Bollinger Band at 1.162824, indicating potential oversold conditions as supported by the RSI(14) value of 18.05954. The MACD is below its signal line, suggesting a bearish trend. The price is also close to its 52-week low of $1.09785.
Solana (SOL) — -3.48%
$66.3300 52W: $64.0750 — $237.3225
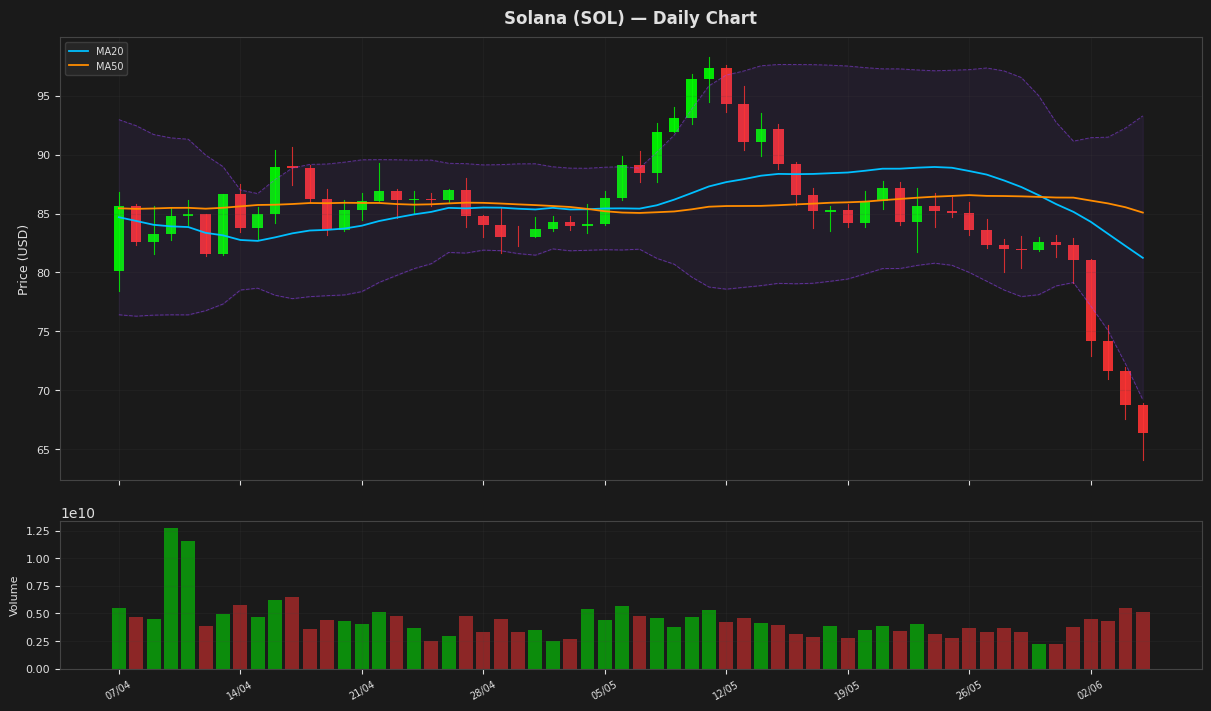
Solana's price is currently at $66.33, showing a daily decline of 3.48%, and is nearing its 52-week low of $64.07. The RSI(14) reading of 8.9742 indicates oversold conditions, potentially setting up for a bounce. The MACD is below its signal line, suggesting bearish momentum, while the price is close to the lower Bollinger Band at $69.18. The ATR(14) suggests moderate volatility.
BNB (BNB) — -1.81%
$592.6000 52W: $570.6840 — $1,370.55
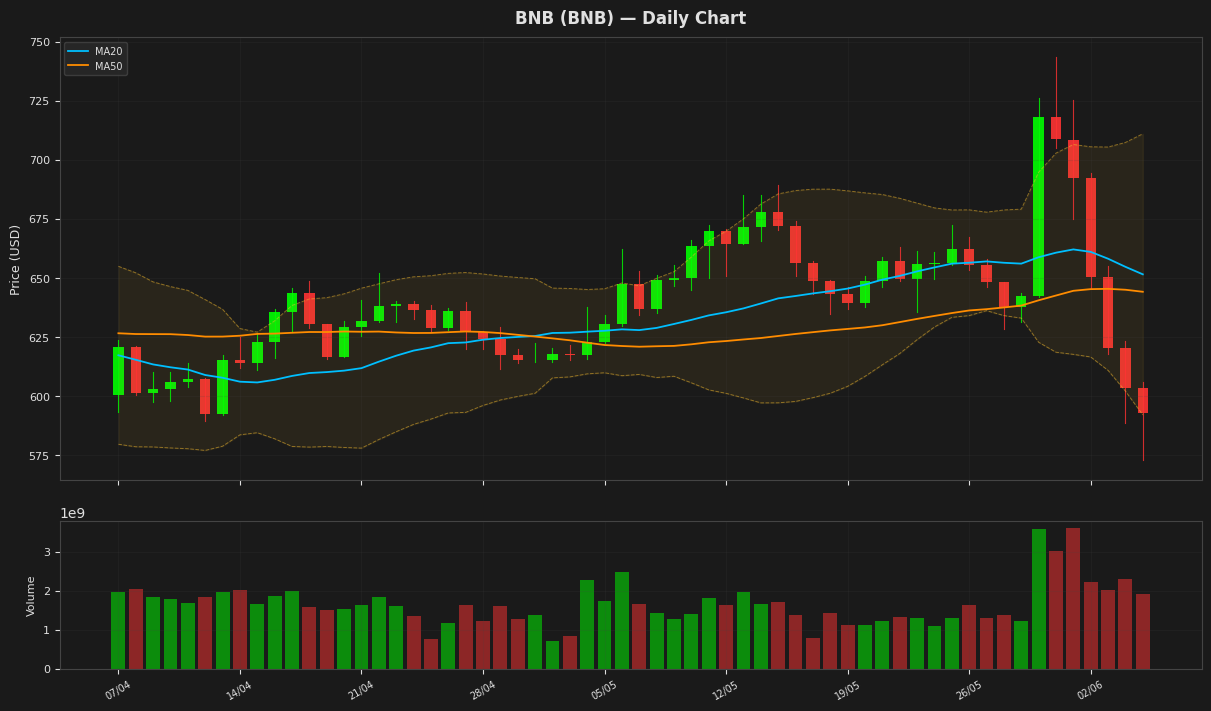
BNB is currently trading at $592.60, near its 52-week low of $570.68, with its price hovering around the lower Bollinger Band at $591.99, indicating potential support. The RSI is at 38.32, suggesting the asset is approaching oversold territory. The MACD is negative and below its signal line, indicating a bearish trend. The ATR indicates moderate volatility.
Tron (TRX) — -1.87%
$0.325815 52W: $0.268138 — $0.376332
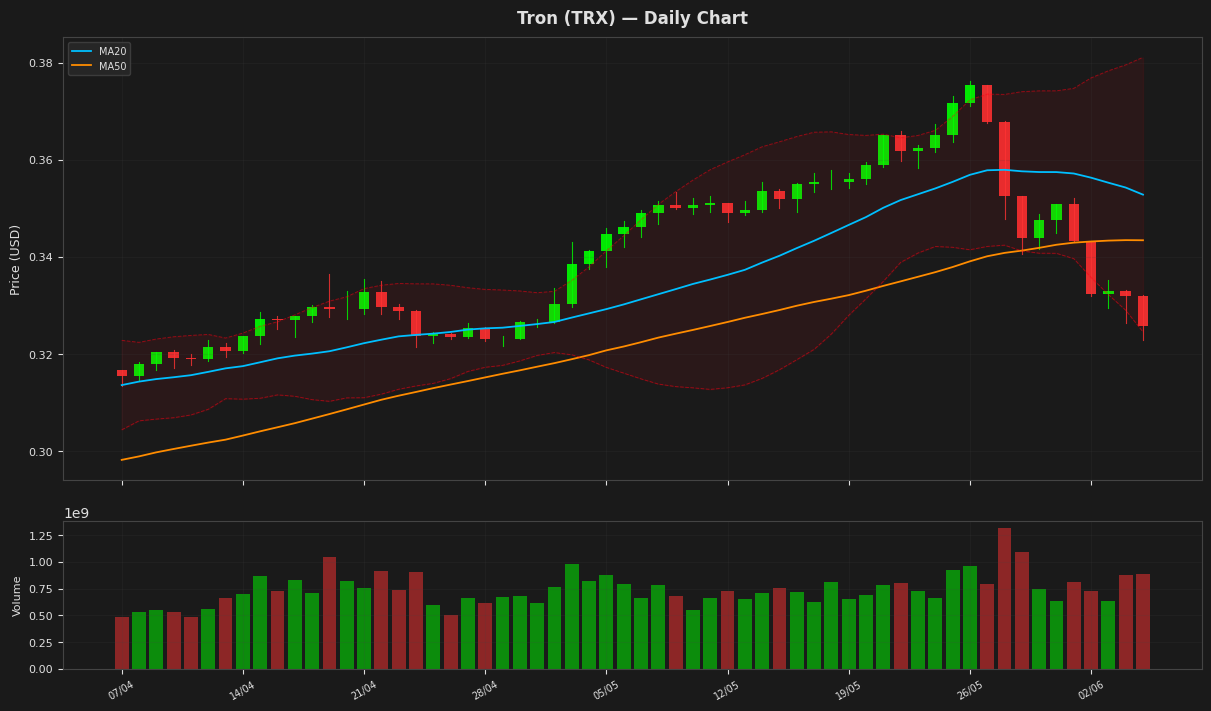
Tron's price is currently at $0.325815, near the lower Bollinger Band at $0.324524, indicating a potential oversold condition supported by the RSI(14) value of 26.886607. The MACD is below its signal line, suggesting a bearish trend. The Average True Range indicates moderate volatility, and the price is below both the MA20 and MA50, reinforcing the downtrend.
Dogecoin (DOGE) — -4.24%
$0.084630 52W: $0.081573 — $0.270047
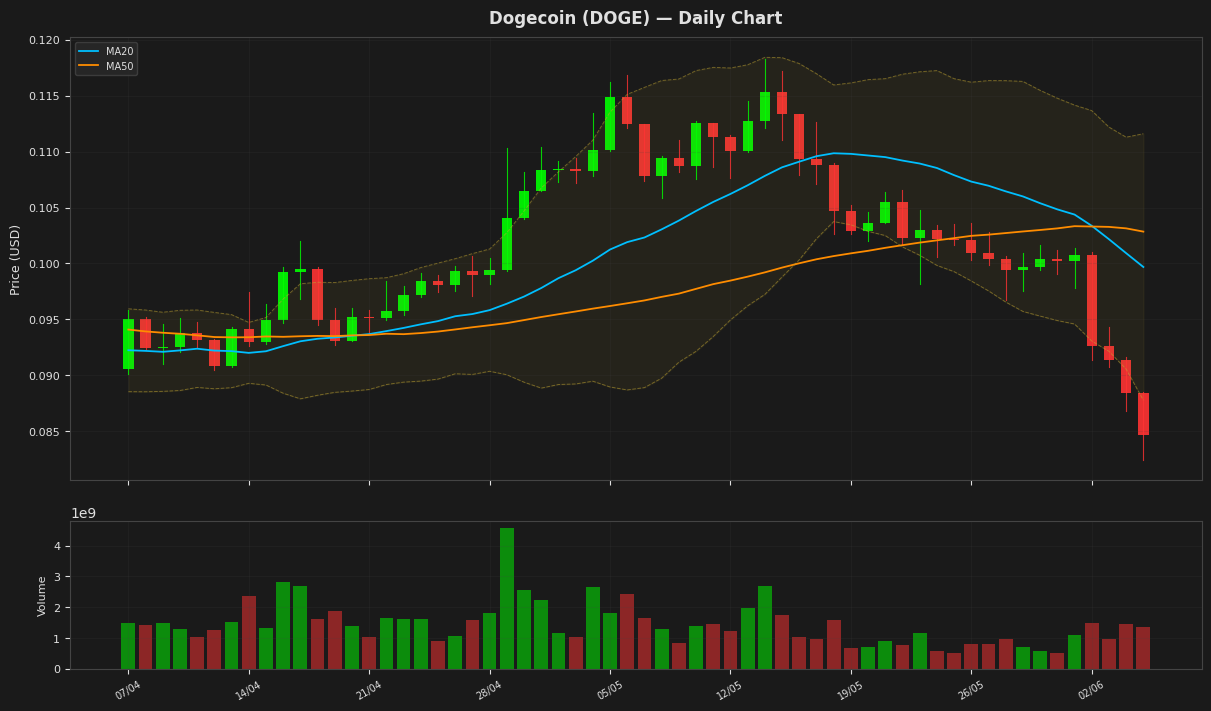
Dogecoin's price is currently at $0.084630, showing a daily decline of 4.24% and trading near the lower Bollinger Band at $0.087765, indicating oversold conditions. The RSI(14) value of 9.912191 further supports this, suggesting a potential for a bounce. The MACD is negative and below its signal line, indicating a bearish trend, but the extreme RSI value may signal a reversal.
Disclaimer
The content on MarketsFN.com is provided for educational and informational purposes only. It does not constitute financial advice or investment recommendations. All investments involve risk. Past performance does not guarantee future results.