Crypto Market Plummets: Ripple, Bitcoin, and BNB Lead Losses Today
· Crypto · QuoteReporter
Crypto Market Plummets: Ripple, Bitcoin, and BNB Lead Losses Today
Crypto Market Report | June 02, 2026
📊 Crypto Market Overview
The cryptocurrency market is experiencing a downturn, with most major assets trading in the red. Bitcoin, the largest cryptocurrency by market capitalization, has seen its price decline by 4.02% to $70,619.99, with its Relative Strength Index (RSI) at 24.2, indicating oversold conditions. The MACD indicator is also in negative territory at -1398.0975, suggesting bearish momentum. Other major cryptocurrencies, such as Ripple and BNB, have also seen significant declines, with XRP down 4.44% and BNB down 3.17%.
Ethereum, the second-largest cryptocurrency, has been relatively more stable, with a decline of just 0.45% to $1,995.25. Its RSI is at 29.8, also indicating oversold conditions, while the MACD is negative at -67.6347. Solana and Tron have also seen declines, with SOL down 2.48% and TRX down 2.50%. Dogecoin, which has been gaining attention recently due to its potential for broader institutional adoption, has been relatively stable, with a decline of just 0.28%.
The current market sentiment is bearish, with many assets experiencing significant declines. However, some analysts still expect a potential price move of up to 20% despite the current low volatility. The macro context is also worth noting, with the US Senate set to continue debating the CLARITY Act this week, which could have implications for the cryptocurrency market. Additionally, Japan's ruling party is pushing for crypto ETFs and yen-denominated stablecoins, which could be a positive development for the industry. Overall, the cryptocurrency market is experiencing a period of consolidation and volatility, with various factors influencing market sentiment.
📰 Crypto News
- TON jumps 15% as The Open Network plans rebrand to Gram
- Bitmine buys $52M ETH as Tom Lee says price not yet showing Ethereum’s strength
- Strategy’s Bitcoin sale causes clash for $80M in Polymarket bets
- DeFi protocol Radiant to wind down after failing to recover from 2024 hack
- Bitcoin bulls eye fresh positions after BTC price drops under $71K
- Dogecoin gains Paxos support in push for broader institutional adoption
- Debate on CLARITY Act continues this week as US Senate returns
- Bitcoin volatility is down 56% but analysts still expect up to 20% BTC price move
- Japan’s ruling party pushes crypto ETFs, yen-denominated stablecoins
- Strategy's BTC sale turns Bitcoin treasury into market stress test
- Bitcoin slide to $70,000 as stocks pause and Strategy's BTC sale weighs on crypto
- Strategy sold bitcoin in late May, and told the market in June. Here's how Polymarket bettors are fighting over when it counts.
- Crypto investment firm Keyrock is acquiring bankrupt lender Blockfills
- Crypto funds suffer second-largest outflows of 2026 while XRP and HYPE attract inflows
- Saylor's Strategy sold bitcoin for the first time since 2022. These firms are still buying
🔍 Technical Analysis
Bitcoin (BTC) — -4.02%
$70,619.99 52W: $60,074.20 — $126,198.07
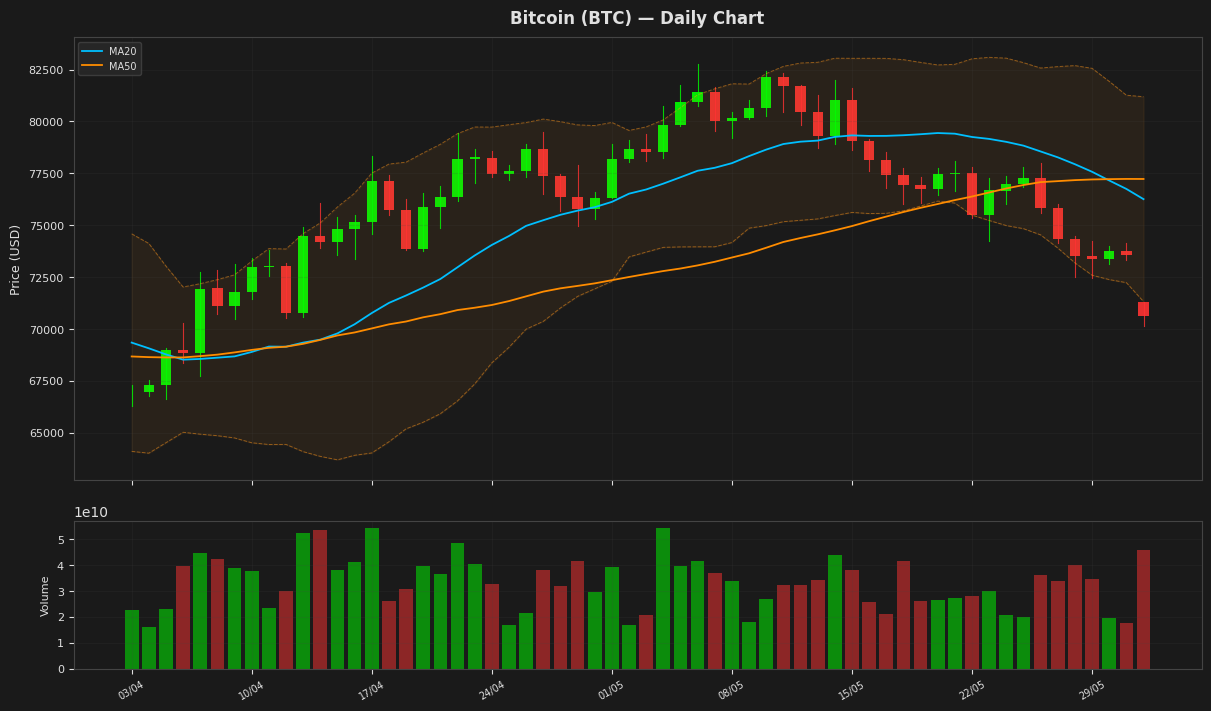
Bitcoin's price has dropped to $70,619.99, a 4.02% daily decline, with the RSI(14) at 24.16 indicating oversold conditions. The current price is near the lower Bollinger Band at $71,318.13, suggesting potential support. The MACD is below its signal line, indicating a bearish trend, while the ATR(14) of $1,791.28 shows high volatility. The price is still above the 52-week low of $60,074.20.
Ethereum (ETH) — -0.45%
$1,995.25 52W: $1,748.63 — $4,755.22
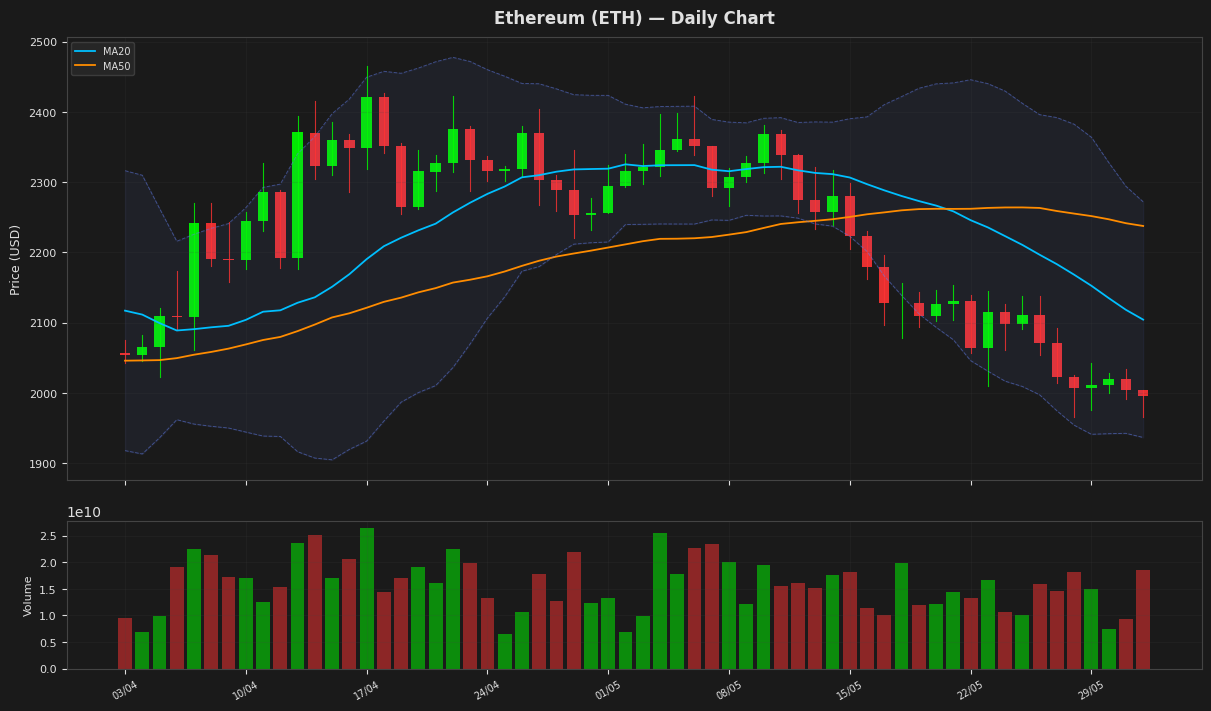
Ethereum's price is currently at $1,995.25, showing a slight decline, and is nearing the lower Bollinger Band at $1,936.68, indicating potential oversold conditions as the RSI(14) stands at 29.77. The MACD is below its signal line, suggesting a bearish trend. The Average True Range indicates moderate volatility.
Ripple (XRP) — -4.44%
$1.2722 52W: $1.1335 — $3.0993
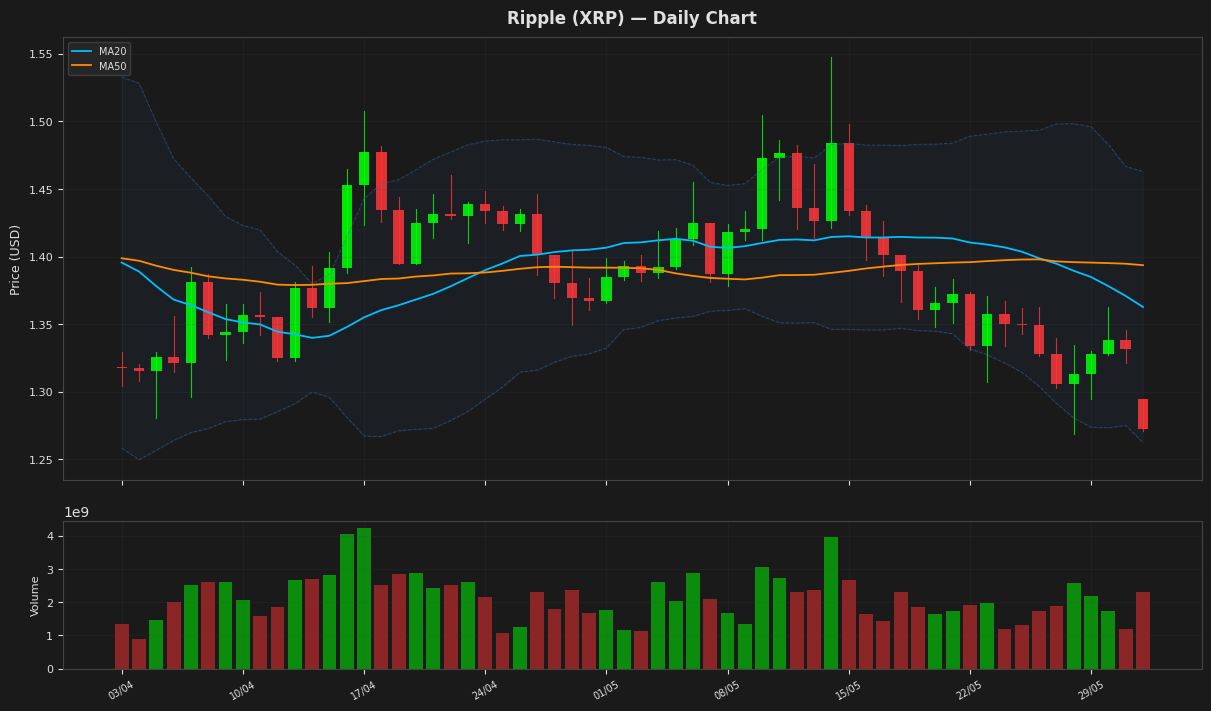
Ripple's price is currently at $1.272200, showing a daily decline of 4.44% and trading near the lower Bollinger Band at 1.26248, indicating potential oversold conditions as supported by the RSI(14) value of 26.781577. The MACD is below its signal line, suggesting a bearish trend. The price is also below both MA20 and MA50, further indicating a downward trend.
Solana (SOL) — -2.48%
$80.2600 52W: $68.6918 — $237.3225
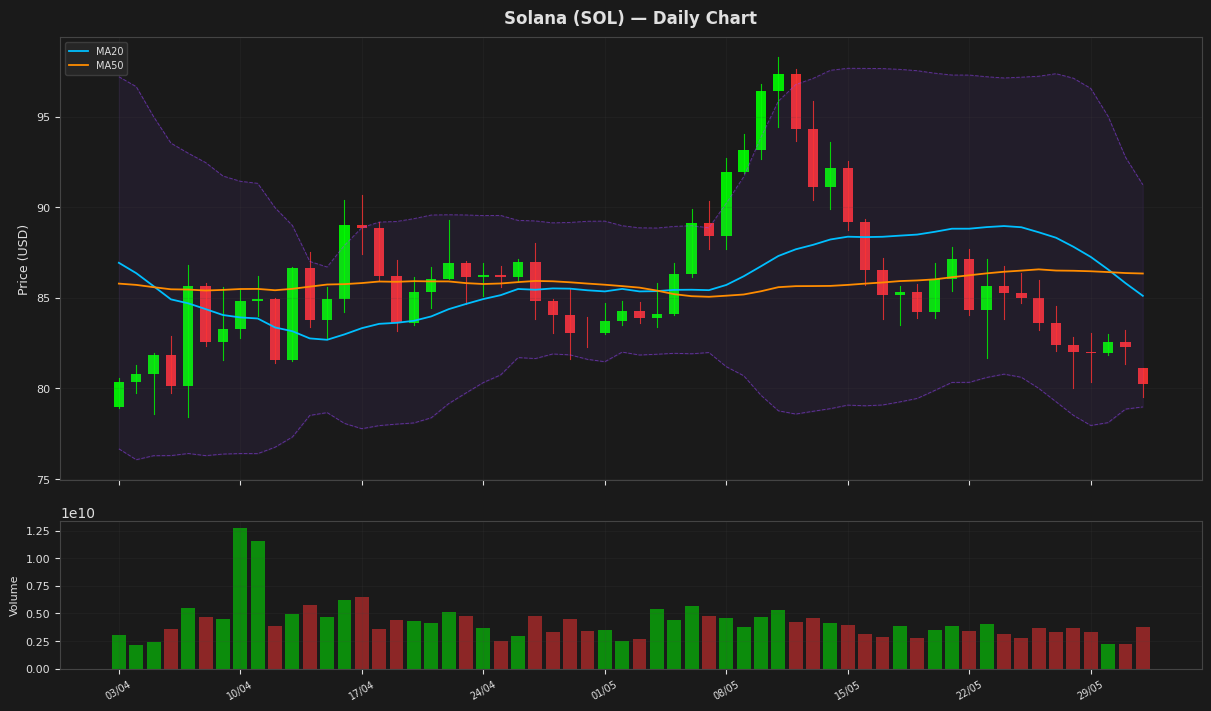
Solana's price is currently at $80.26, showing a decline of 2.48% for the day, and is positioned below both its 20-day and 50-day moving averages, indicating a bearish trend. The RSI is at 33.06, suggesting the asset is nearing oversold territory. The MACD is below its signal line, further indicating a bearish momentum. The price is also near the lower Bollinger Band at $78.97.
BNB (BNB) — -3.17%
$686.1200 52W: $570.6840 — $1,370.55
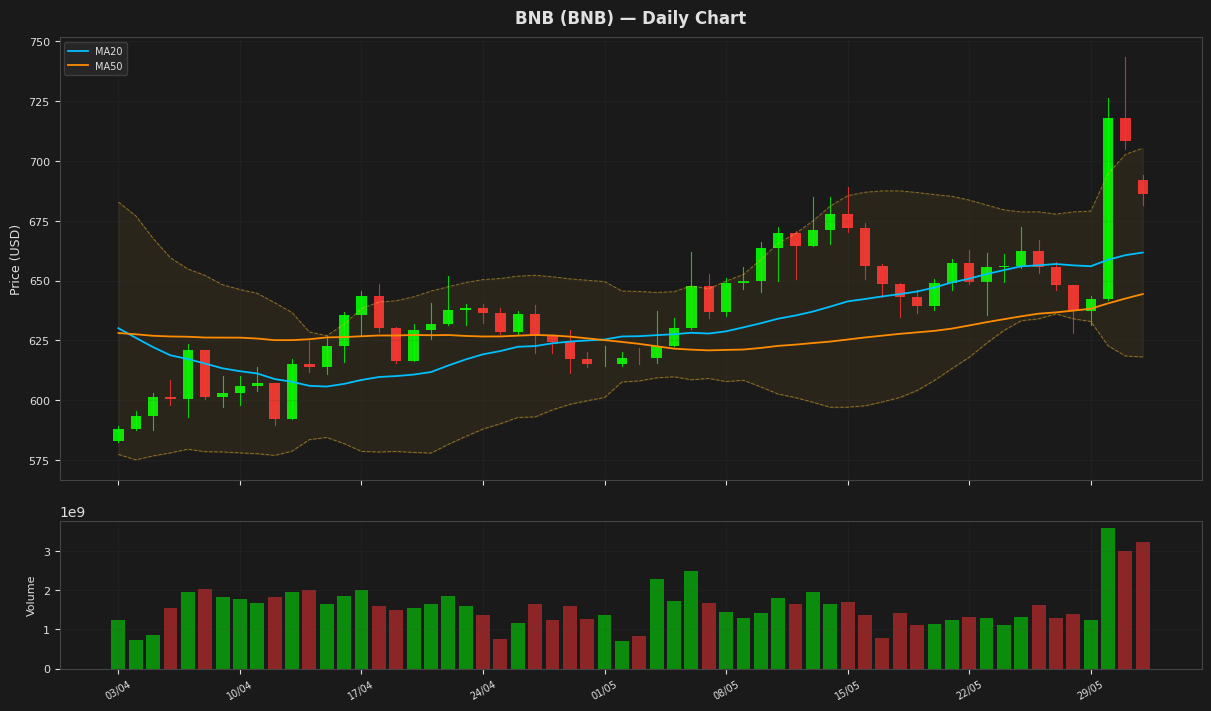
BNB is currently trading at $686.12, with a daily decline of 3.17%, and is positioned near the upper Bollinger Band at $705.39, indicating potential resistance. The RSI is at 62.01, suggesting a relatively strong uptrend, while the MACD is above its signal line, indicating a bullish signal. The price is also above both the MA20 and MA50, further supporting the uptrend.
Tron (TRX) — -2.50%
$0.342075 52W: $0.268138 — $0.376332
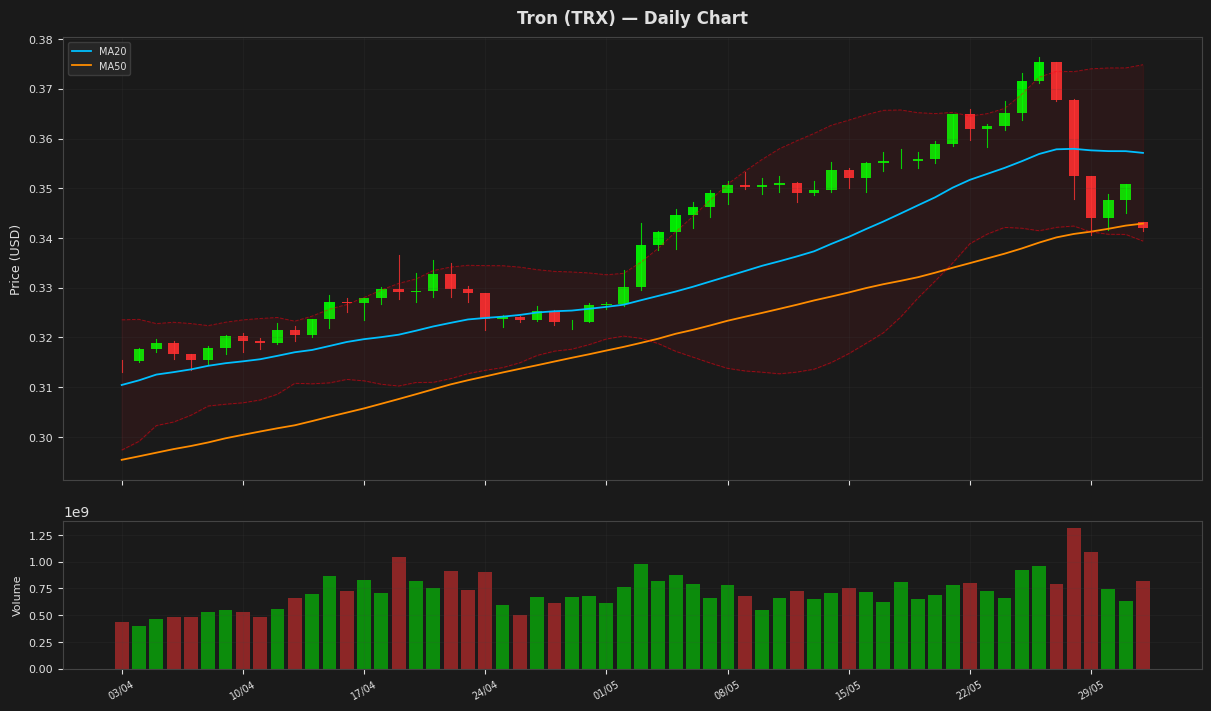
Tron's price is currently at $0.342075, showing a decline of 2.50% for the day, and is positioned near the lower Bollinger Band at $0.33938, indicating potential support. The RSI is at 40.89, suggesting the asset is approaching oversold territory. The MACD is below its signal line, indicating a bearish trend, and the ATR suggests relatively low volatility. The price is also near its 52-week high, indicating a potential reversal or consolidation.
Dogecoin (DOGE) — -0.28%
$0.099980 52W: $0.081573 — $0.270047
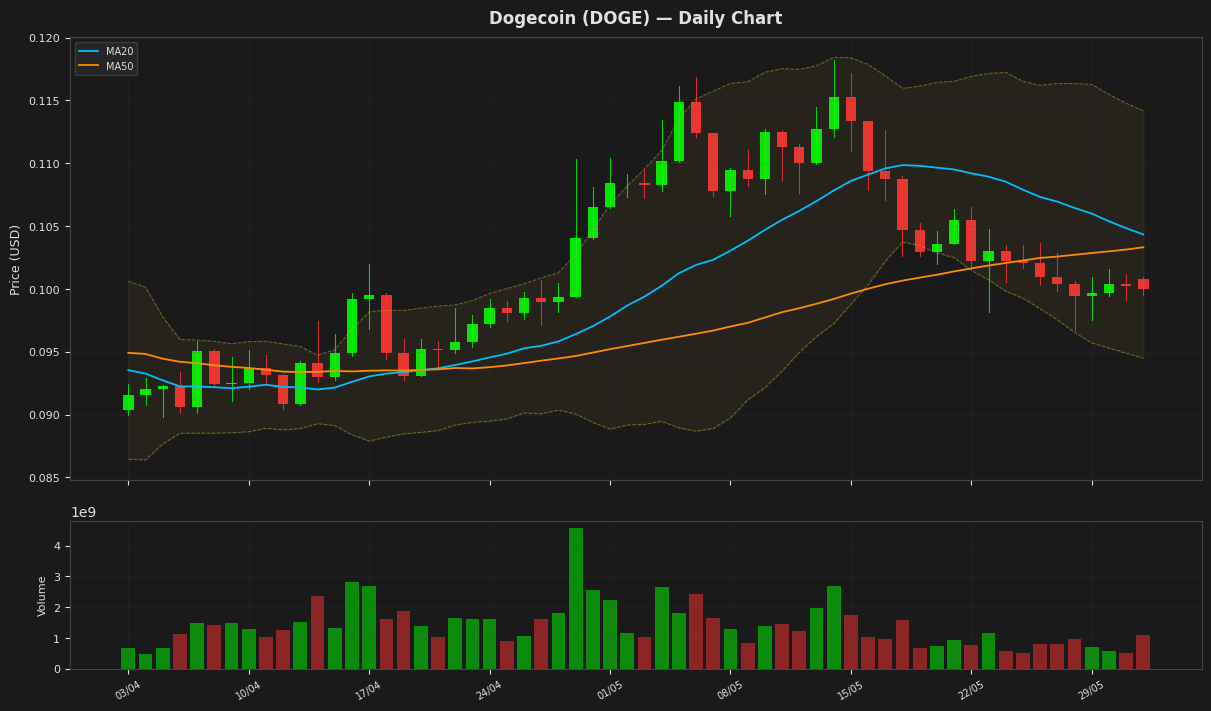
Dogecoin's price is currently at $0.099980, showing a minor decline of 0.28% for the day. The RSI(14) value of 32.321556 indicates that the cryptocurrency is approaching oversold territory, while the MACD line is below the signal line, suggesting a bearish trend. The price is near the lower Bollinger Band at 0.09448, indicating potential support at this level. The ATR(14) suggests relatively low volatility.
Disclaimer
The content on MarketsFN.com is provided for educational and informational purposes only. It does not constitute financial advice or investment recommendations. All investments involve risk. Past performance does not guarantee future results.