Crypto Market Plunges: Solana, BNB, and Dogecoin Lead the Decline
· Crypto · QuoteReporter
Crypto Market Plunges: Solana, BNB, and Dogecoin Lead the Decline
Crypto Market Report | June 03, 2026
📊 Crypto Market Overview
The cryptocurrency market is currently experiencing a downturn, with major assets such as Bitcoin and Ethereum witnessing significant declines. Bitcoin's price has dropped by 5.72% to $67,243.0078, while Ethereum has fallen by 6.56% to $1,871.7400. Other notable cryptocurrencies, including Solana and Dogecoin, have also seen substantial losses, with Solana decreasing by 7.58% to $74.9400 and Dogecoin by 6.73% to $0.0940.
The overall market sentiment is bearish, with the Relative Strength Index (RSI) for many top cryptocurrencies indicating oversold conditions. Bitcoin's RSI stands at 19.2, while Ethereum's is at 22.6, suggesting that both assets may be due for a potential rebound. The Moving Average Convergence Divergence (MACD) indicator is also in negative territory for most major cryptocurrencies, further emphasizing the prevailing bearish sentiment.
The recent correction has resulted in a significant loss of investor funds, with approximately $176 billion vaporized. This downturn is occurring against a backdrop of increased regulatory scrutiny, with the US SEC designating digital assets as a strategic priority through 2030. Additionally, US lawmakers are pushing back against plans to include cryptocurrency in 401(k) plans, highlighting the ongoing debate surrounding the role of crypto in traditional financial systems.
Notable technical signals include the oversold RSI readings for many major cryptocurrencies, which could potentially signal a buying opportunity. However, the MACD indicators suggest that the bearish momentum remains strong. The market is currently reacting to a combination of macroeconomic factors and regulatory developments, with investor attention also being drawn to emerging trends such as AI stocks. As the market continues to navigate this complex landscape, the focus remains on the potential implications of regulatory actions and macroeconomic trends on the cryptocurrency market.
📰 Crypto News
- Modern robots impress, but are years away from replacing humans
- Crypto turns ‘contrarian bet’ as AI stocks draw investor attention: Bitwise
- Cardano’s TapTools to wind down after 5 execs exit
- UK Lords warn BoE could regulate pound stablecoins into irrelevance
- US lawmakers push back on Labor Department plans to include crypto in 401(k)s
- SEC makes digital assets strategic priority through 2030
- Crypto correction vaporized $176B in investor funds: Are bears back in control?
- Crypto PACs pour $3M into Maryland races as California voters head to polls
- Coinbase invests in ProShares ETF tailored for stablecoin reserve assets
- Bitcoin’s $224K ‘fair value’ may emerge if sovereign debt fears deepen: Bitwise
- Prediction market traders bet bitcoin's selloff has further to run
- Bitcoin's 'fear gauge' surges nearly 20%, its biggest jump since Feb. 5 crash
- Bullish XRP signals are piling up. The price keeps falling.
- Bullish crypto bets lose $1.6 billion as ETH, SOL, DOGE drop 9%
- Bitcoin plunges below $66,000 as global stocks, AI trades hit fresh records
🔍 Technical Analysis
Bitcoin (BTC) — -5.72%
$67,243.01 52W: $60,074.20 — $126,198.07
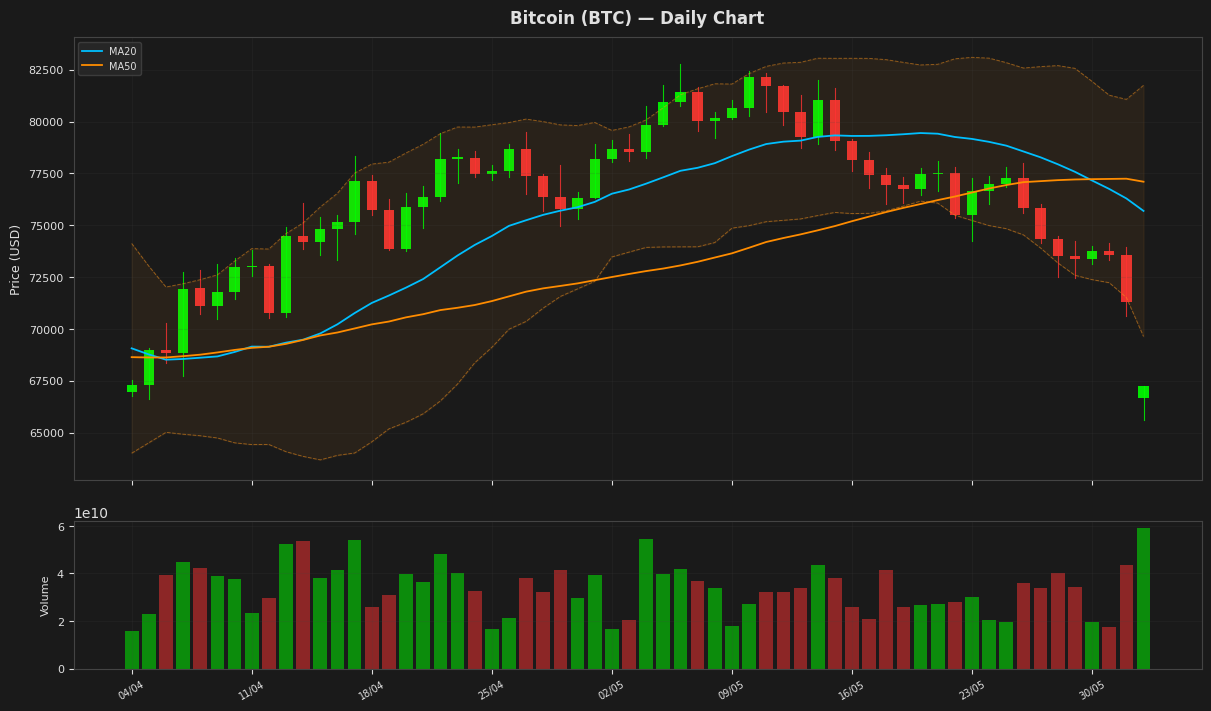
Bitcoin's price has dropped to $67,243, showing a daily decline of 5.72%, and is currently near the lower Bollinger Band at $69,635, indicating potential oversold conditions as the RSI(14) has fallen to 19.19507. The MACD is below its signal line, suggesting a bearish trend. The Average True Range indicates high volatility, and the price is significantly below both the MA20 and MA50.
Ethereum (ETH) — -6.56%
$1,871.74 52W: $1,748.63 — $4,755.22
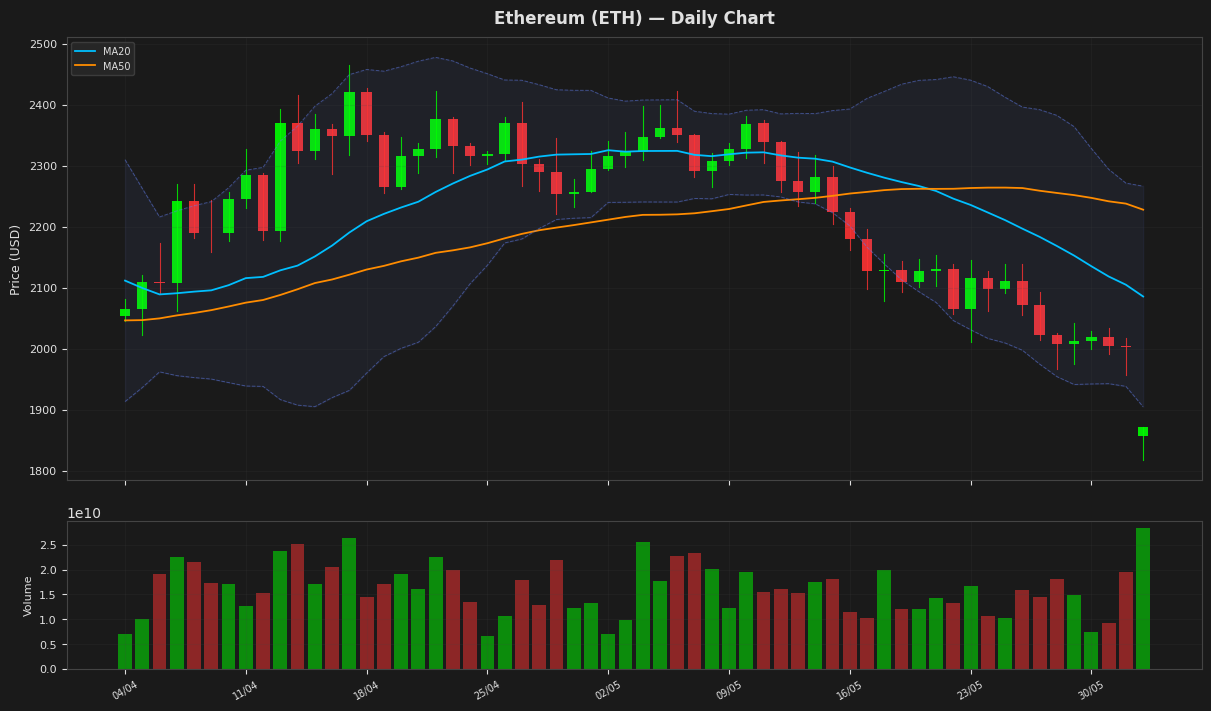
Ethereum's price has dropped to $1,871.74, a 6.56% daily decline, and is now nearing the lower Bollinger Band at $1,904.60, indicating potential oversold conditions as the RSI(14) has fallen to 22.57. The MACD is below its signal line, suggesting bearish momentum. The current price is also close to the 52-week low of $1,748.63.
Ripple (XRP) — -4.34%
$1.2387 52W: $1.1335 — $3.0993
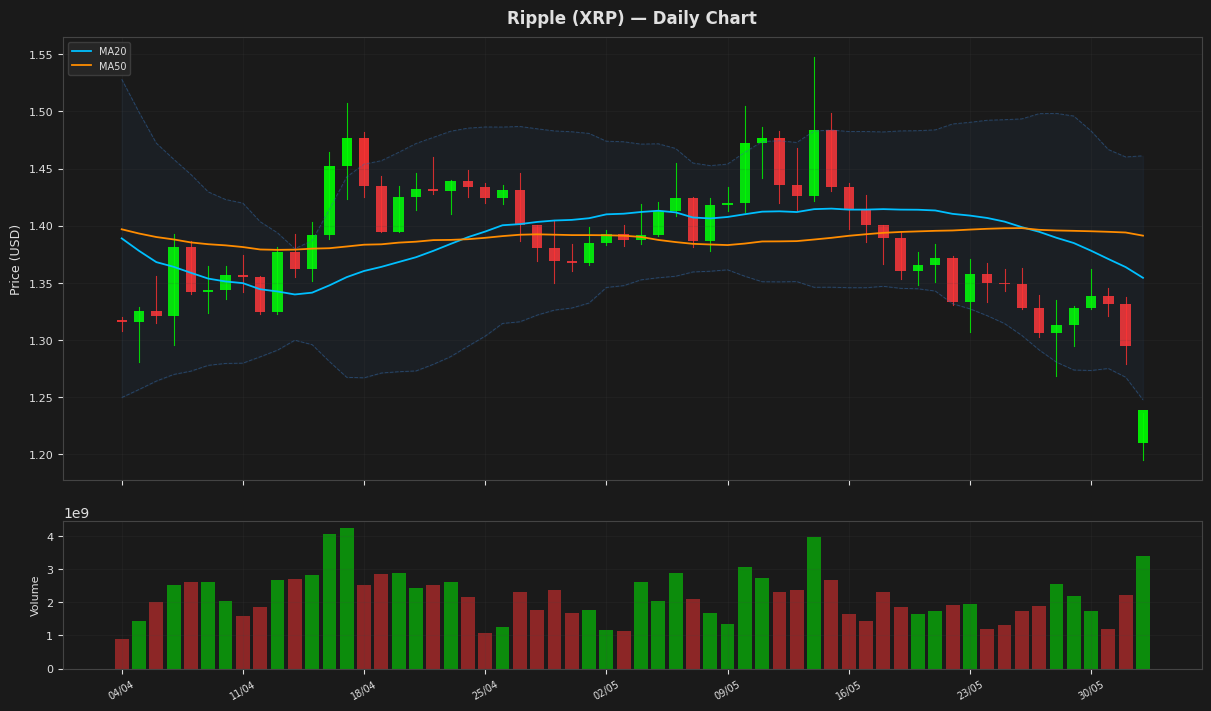
Ripple's price is currently at $1.238700, near the lower Bollinger Band of 1.247739, indicating a potential oversold condition, supported by the RSI(14) value of 26.271897. The MACD is below its signal line, suggesting a bearish trend. The price is also below both MA20 and MA50, further indicating a downtrend. The ATR(14) suggests moderate volatility.
Solana (SOL) — -7.58%
$74.9400 52W: $68.6918 — $237.3225
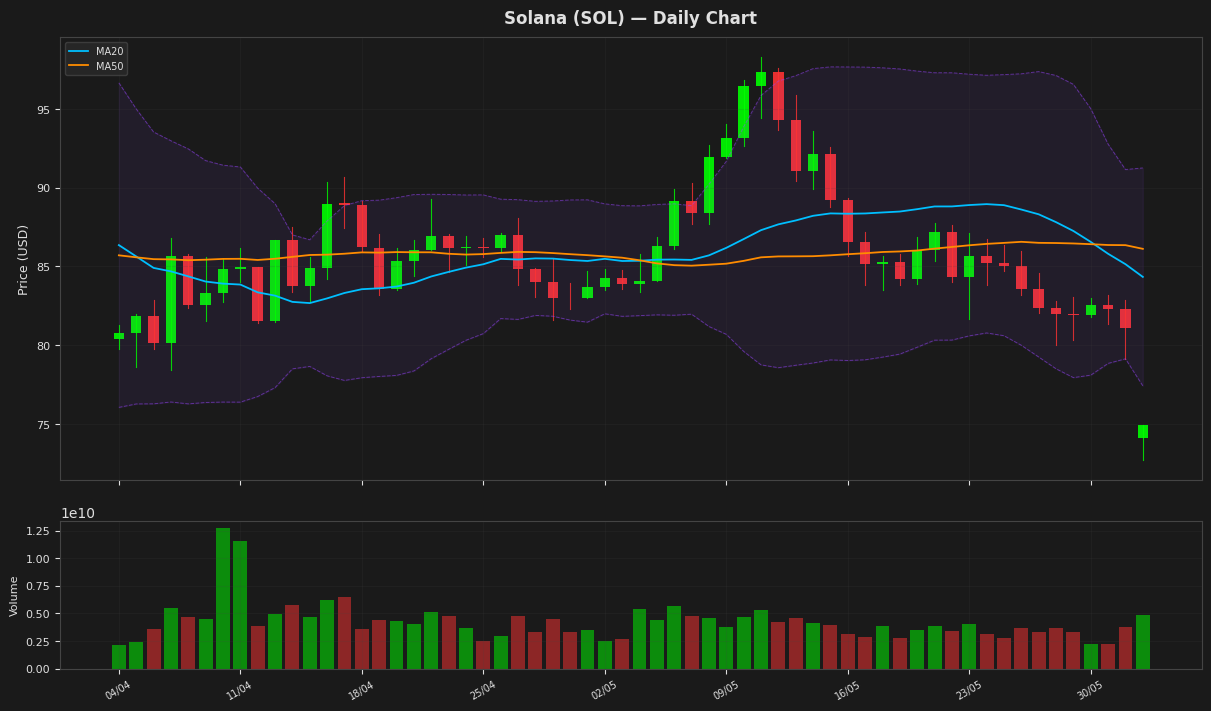
Solana's price is currently at $74.94, showing a decline of 7.58% for the day, and is positioned near the lower Bollinger Band at $77.42, indicating potential oversold conditions. The RSI(14) value of 25.73 suggests the asset is oversold, while the MACD is below its signal line, indicating a bearish trend. The price is also below both the MA20 and MA50, further reinforcing the bearish sentiment.
BNB (BNB) — -6.84%
$644.7800 52W: $570.6840 — $1,370.55
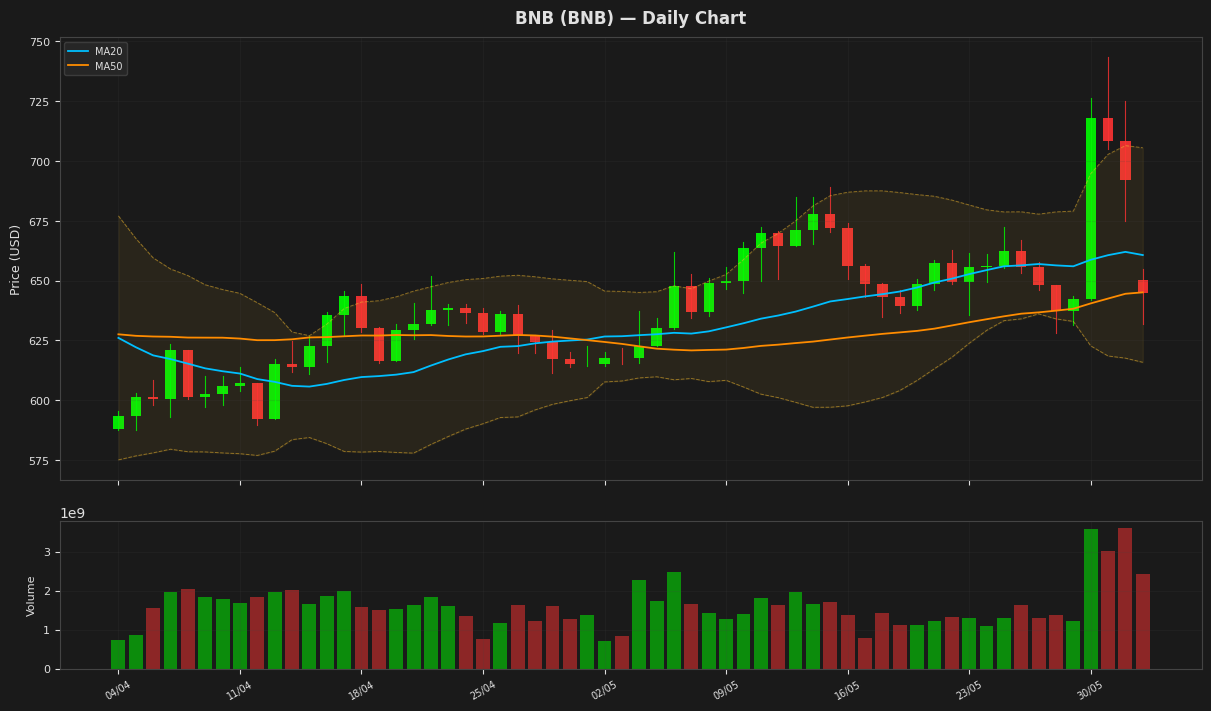
BNB is currently trading at $644.78, showing a decline of 6.84% for the day, and is positioned near its 50-day moving average of $645.12, indicating a potential support level. The Relative Strength Index (RSI) stands at 51.23, suggesting a neutral market sentiment. The MACD is above its signal line, indicating a potential bullish crossover. The price is also within the Bollinger Bands, with the upper and lower bands at $705.55 and $615.87 respectively.
Tron (TRX) — -3.01%
$0.332840 52W: $0.268138 — $0.376332
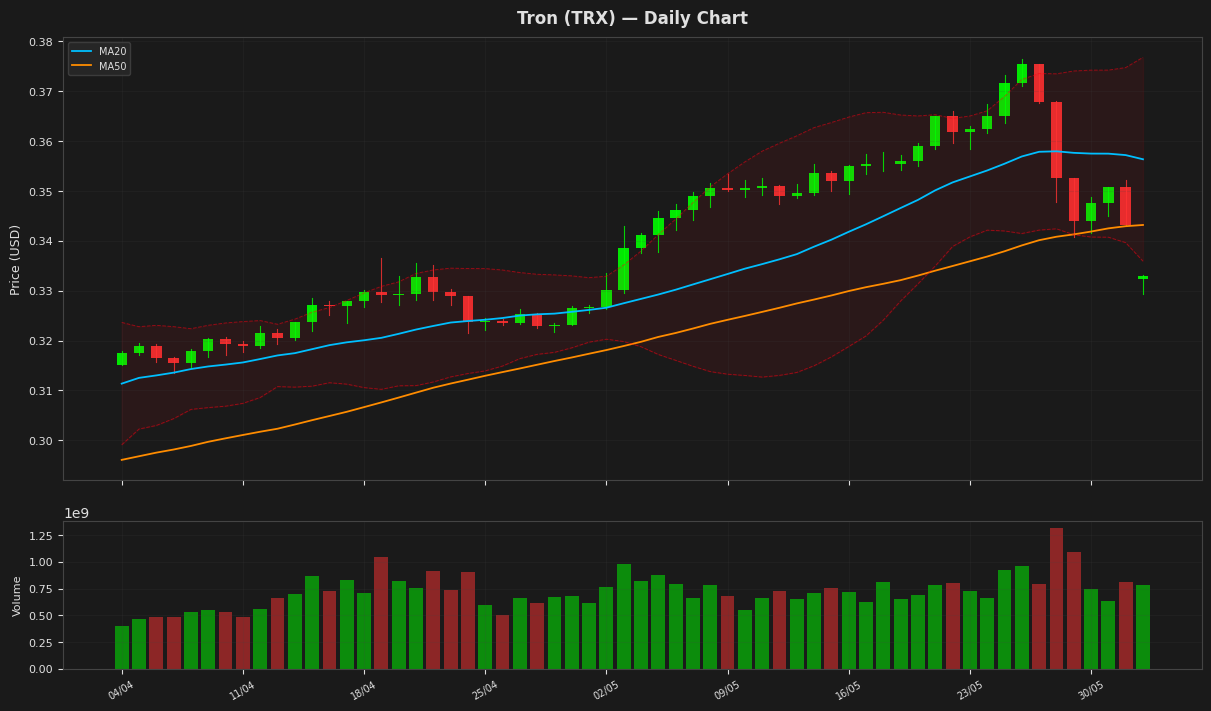
Tron's price is currently at $0.332840, showing a decline of 3.01% for the day, and is positioned near the lower Bollinger Band at $0.335907, indicating potential support. The RSI is at 35.91, suggesting the asset is approaching oversold territory. The MACD is below its signal line, indicating a bearish trend. The price is also below both the MA20 and MA50, further reinforcing the bearish sentiment.
Dogecoin (DOGE) — -6.73%
$0.093960 52W: $0.081573 — $0.270047
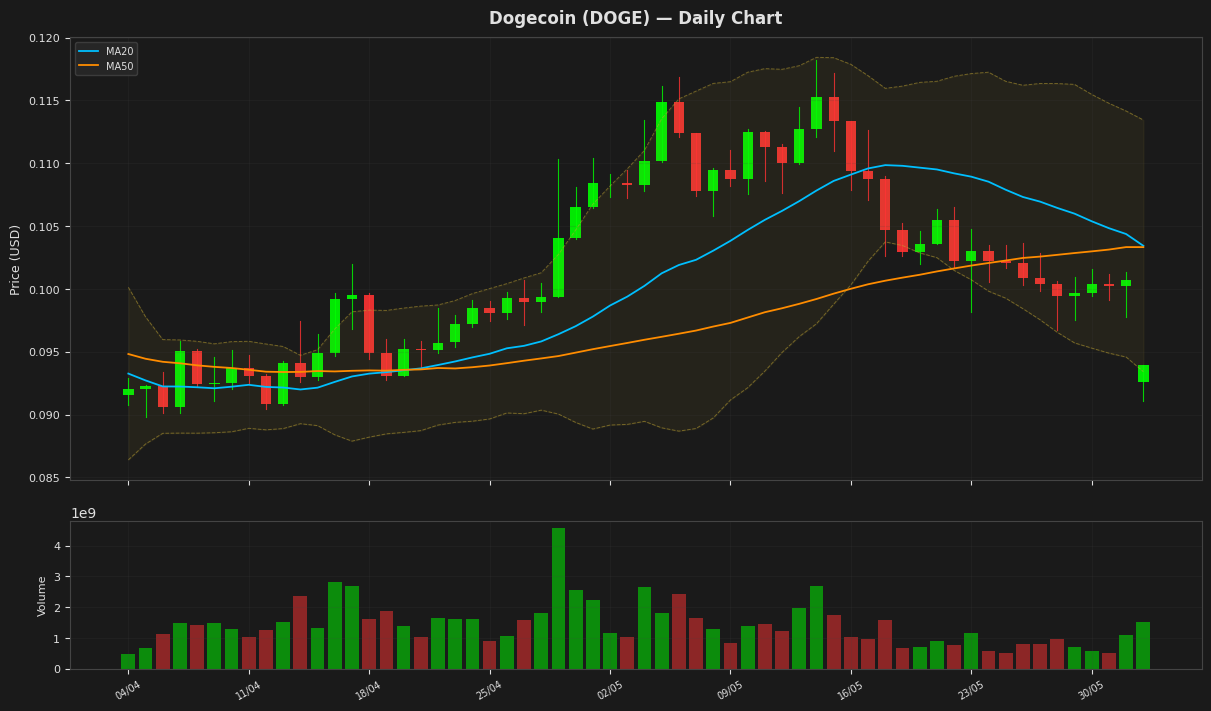
Dogecoin's price is currently at $0.093960, showing a daily decline of 6.73% and hovering near the lower Bollinger Band at 0.093419, indicating potential oversold conditions. The RSI(14) value of 25.727131 further supports this, suggesting the cryptocurrency may be due for a rebound. The MACD is negative and below its signal line, indicating a bearish trend. The price is also near its 52-week low of $0.081573.
Disclaimer
The content on MarketsFN.com is provided for educational and informational purposes only. It does not constitute financial advice or investment recommendations. All investments involve risk. Past performance does not guarantee future results.