Crypto Market Slumps: Bitcoin, Dogecoin, and Solana Lead Losses Today
· Crypto · QuoteReporter
Crypto Market Slumps: Bitcoin, Dogecoin, and Solana Lead Losses Today
Crypto Market Report | July 23, 2026
📊 Crypto Market Overview
The cryptocurrency market is currently experiencing a relatively stable trading session, with most major assets exhibiting minor losses. Bitcoin is trading at $65,554, down 0.83% on the day, while Ethereum is at $1,921, a decrease of 0.64%. Other notable cryptocurrencies, such as Ripple, Solana, and Dogecoin, are also seeing slight declines, with losses ranging from 0.59% to 0.80%.
From a technical perspective, the Relative Strength Index (RSI) for Ethereum is at 70.4, indicating that it is approaching overbought territory. Bitcoin's RSI is at 61.2, still within a neutral range. The MACD indicators for most assets are showing mixed signals, with some, like Bitcoin and Ethereum, displaying positive momentum, while others, such as BNB, are showing negative divergence.
The macro context is seeing significant developments, with news of institutional investment and regulatory advancements. Bitcoin ETFs have recorded a 7-session inflow run approaching $1 billion, indicating continued interest from traditional investors. Additionally, the acquisition of Korbit by Mirae Asset and the launch of regulated crypto trading by Swiss bank BancaStato with Sygnum highlight the growing involvement of traditional financial institutions in the cryptocurrency space.
Meanwhile, security concerns persist, with hackers stealing $31.6 million in two crypto bridge attacks within a seven-hour period. The SEC has also been active, settling a suit with Coinbase over missing text messages. Overall, the market sentiment remains cautious, with investors monitoring both the positive developments in institutional investment and the ongoing security risks. The technical signals are mixed, with some assets showing signs of strength and others indicating potential weakness.
From a technical perspective, the Relative Strength Index (RSI) for Ethereum is at 70.4, indicating that it is approaching overbought territory. Bitcoin's RSI is at 61.2, still within a neutral range. The MACD indicators for most assets are showing mixed signals, with some, like Bitcoin and Ethereum, displaying positive momentum, while others, such as BNB, are showing negative divergence.
The macro context is seeing significant developments, with news of institutional investment and regulatory advancements. Bitcoin ETFs have recorded a 7-session inflow run approaching $1 billion, indicating continued interest from traditional investors. Additionally, the acquisition of Korbit by Mirae Asset and the launch of regulated crypto trading by Swiss bank BancaStato with Sygnum highlight the growing involvement of traditional financial institutions in the cryptocurrency space.
Meanwhile, security concerns persist, with hackers stealing $31.6 million in two crypto bridge attacks within a seven-hour period. The SEC has also been active, settling a suit with Coinbase over missing text messages. Overall, the market sentiment remains cautious, with investors monitoring both the positive developments in institutional investment and the ongoing security risks. The technical signals are mixed, with some assets showing signs of strength and others indicating potential weakness.
📰 Crypto News
- BitMEX to shut down after 11 years in crypto derivatives
- Mirae Asset completes Korbit acquisition, becomes largest shareholder
- Bitcoin ETFs approach $1B in 7-session inflow run
- Kakao taps Circle to explore won stablecoin payment infrastructure
- Here’s what happened in crypto today
- Swiss bank BancaStato launches regulated crypto trading with Sygnum
- White House accuses Moonshot AI of distilling Anthropic tech for K3
- SEC settles Coinbase suit over ‘text messages that disappeared’
- Hackers steal $31.6M in 2 crypto bridge attacks within 7 hours
- S&P launches blockchain fundamentals index for digital assets
- Crypto PAC pours $1M into Michigan Democratic primary race
- South Korea's oldest crypto exchange is now part of the $1 trillion Mirae Group family
- Bitcoin, Ethereum-linked protocols lose $35 million in multiple attacks hours apart
- Arbitrum-based AFX Trade drained of $24 million after bridge keys compromised
- XRP whales accumulate as small holders capitulate
🔍 Technical Analysis
Bitcoin (BTC) — -0.83%
$65,554.04 52W: $57,747.77 — $99,804.43
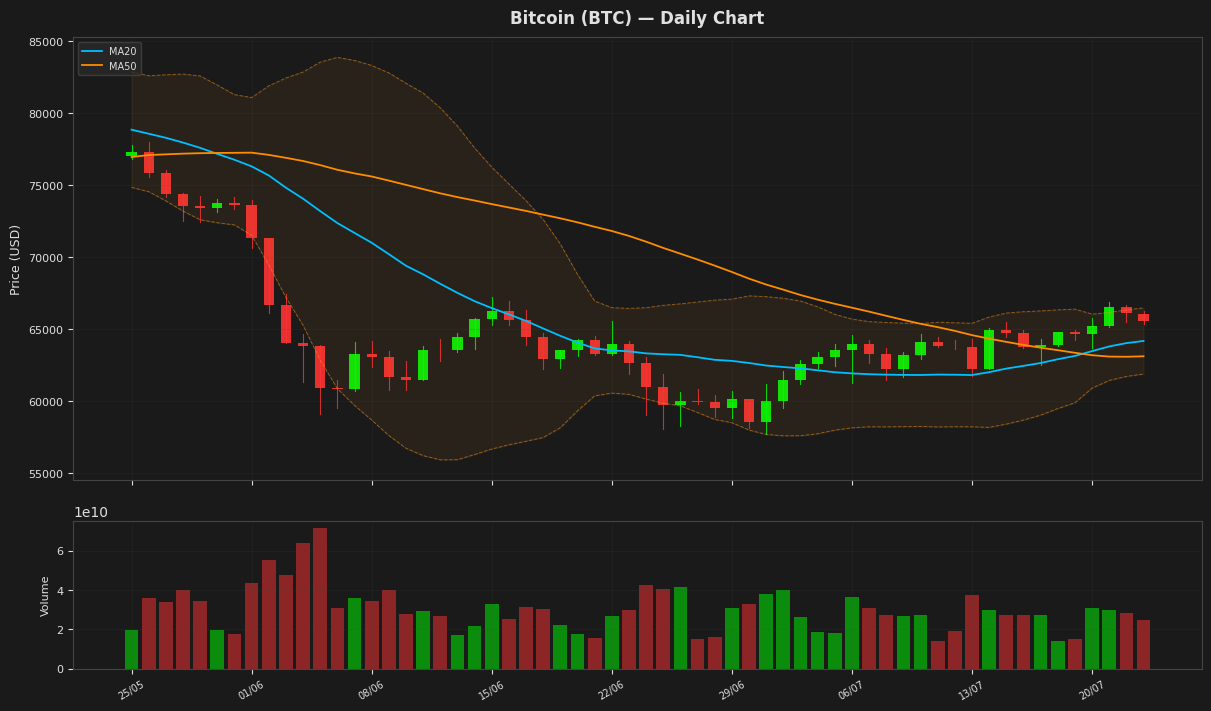
Bitcoin is currently trading at $65,554, slightly below its 20-day moving average of $64,177, indicating a relatively stable trend. The Relative Strength Index (RSI) at 61.15 suggests the cryptocurrency is nearing overbought territory but still has room to maneuver. The Moving Average Convergence Divergence (MACD) is above its signal line, indicating a bullish signal. The price is also within the Bollinger Bands, with the upper band at $66,472 and lower band at $61,882.
Ethereum (ETH) — -0.64%
$1,921.10 52W: $1,506.51 — $3,446.62
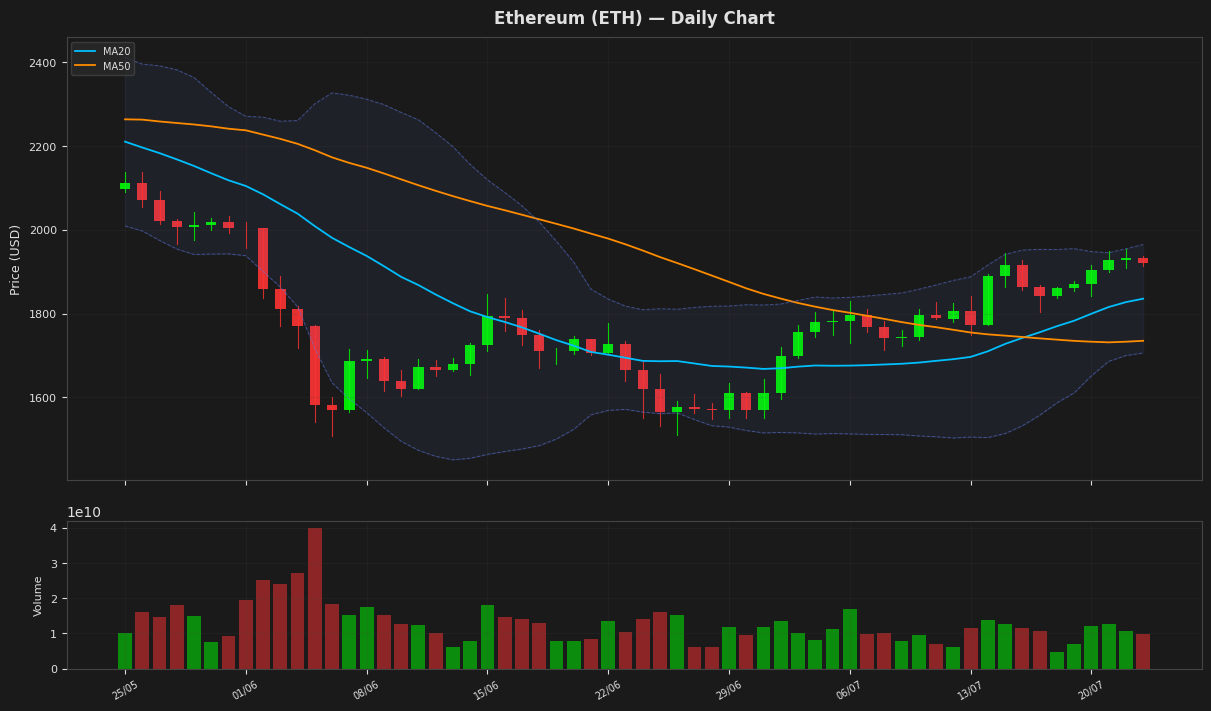
Ethereum's price is currently at $1,921.10, showing a slight decline of 0.64% and hovering near the upper Bollinger Band at $1,965.09, indicating potential resistance. The RSI is at 70.39, suggesting the asset is nearing overbought territory. The MACD is above its signal line, indicating a bullish signal, while the ATR suggests moderate volatility. The price is still below its 52-week high, indicating room for further upside.
Ripple (XRP) — -0.59%
$1.1349 52W: $1.0098 — $2.4103
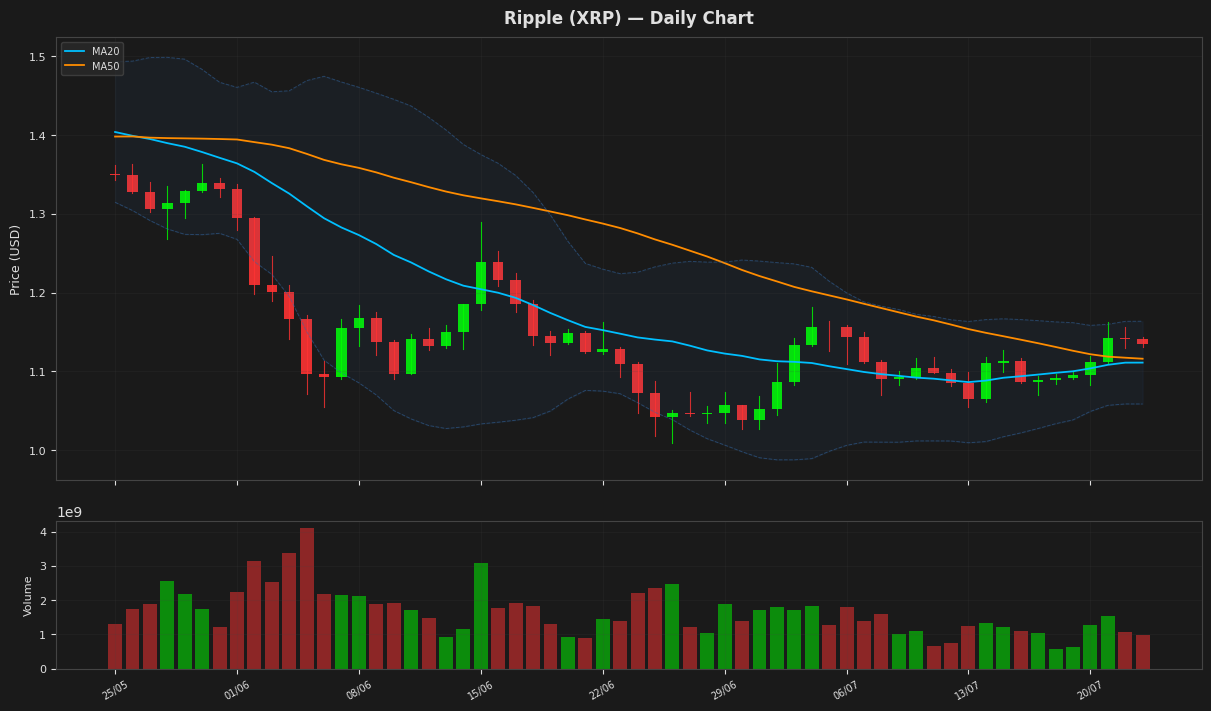
Ripple's price is currently at $1.134900, slightly above its MA20 and MA50, indicating a neutral to slightly bullish trend. The RSI is at 61.139842, suggesting the asset is not overbought but nearing it. The MACD is positive and above its signal line, indicating a potential buy signal. The price is also within the Bollinger Bands, with the upper band at $1.163588.
Solana (SOL) — -0.77%
$77.3100 52W: $60.4147 — $148.2160
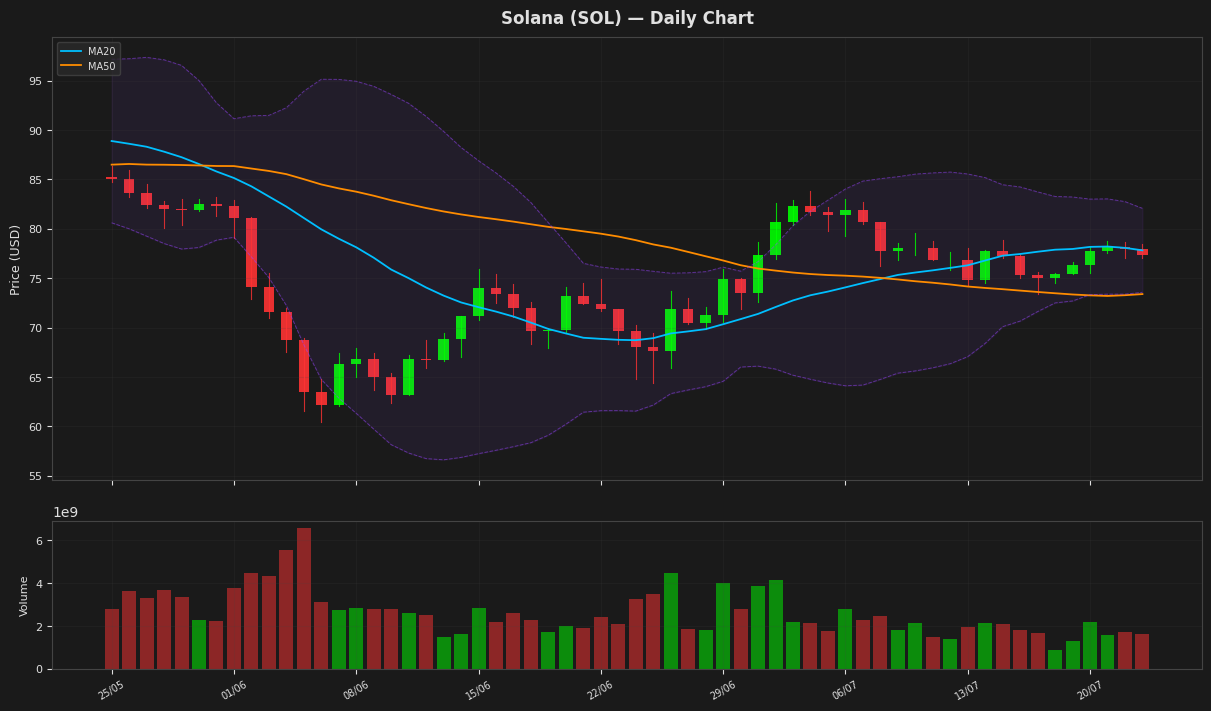
Solana's price is currently at $77.31, showing a minor decline of 0.77%. The RSI at 47.14 indicates a neutral stance, while the MACD at 0.49 is below its signal line at 0.58, suggesting a potential bearish crossover. The price is hovering around the MA20 at 77.82 and above the MA50 at 73.39, indicating a possible consolidation phase.
BNB (BNB) — -0.09%
$570.2300 52W: $538.5992 — $954.8583
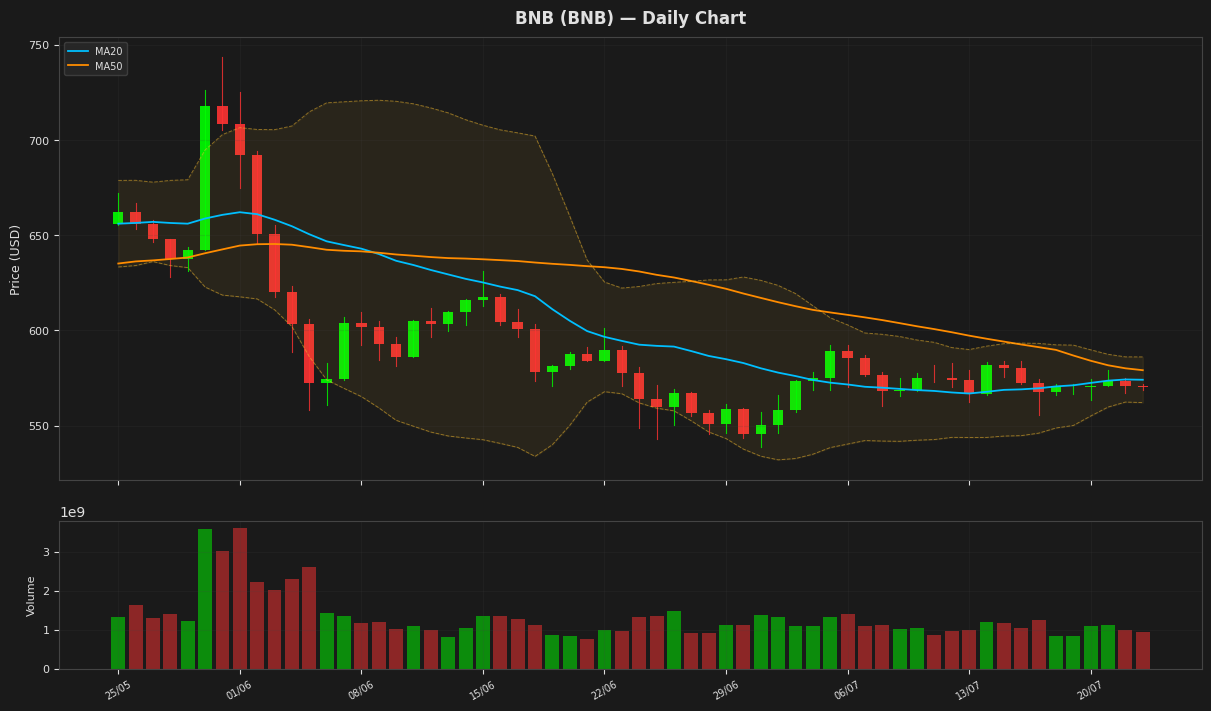
BNB is currently trading at $570.23, slightly below its MA20 and MA50, indicating a neutral short-term trend. The RSI is at 51.65, suggesting a balanced market with no clear dominance of buyers or sellers. The Bollinger Bands indicate that the price is within the normal volatility range, with the upper band at $586.06 and lower band at $562.07. The MACD is above its signal line, hinting at a potential bullish crossover.
Tron (TRX) — -0.38%
$0.327516 52W: $0.268138 — $0.376332
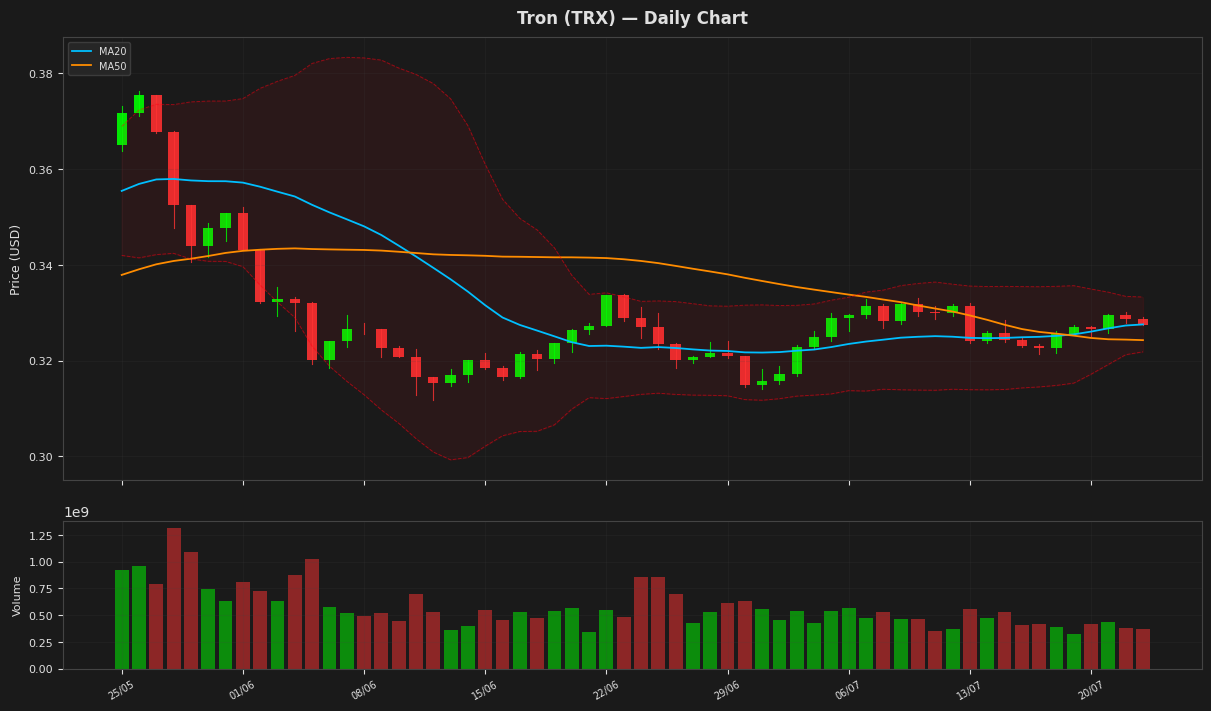
Tron's price is currently at $0.327516, showing a minor decline of 0.38% and hovering around its MA20 at 0.327559, indicating a lack of strong directional momentum. The RSI at 41.316447 suggests that TRX is nearing oversold territory, while the MACD is above its signal line, indicating a potential bullish crossover. The Bollinger Bands suggest that the price is near the upper band at 0.333281, indicating potential resistance.
Dogecoin (DOGE) — -0.80%
$0.072370 52W: $0.069611 — $0.165719
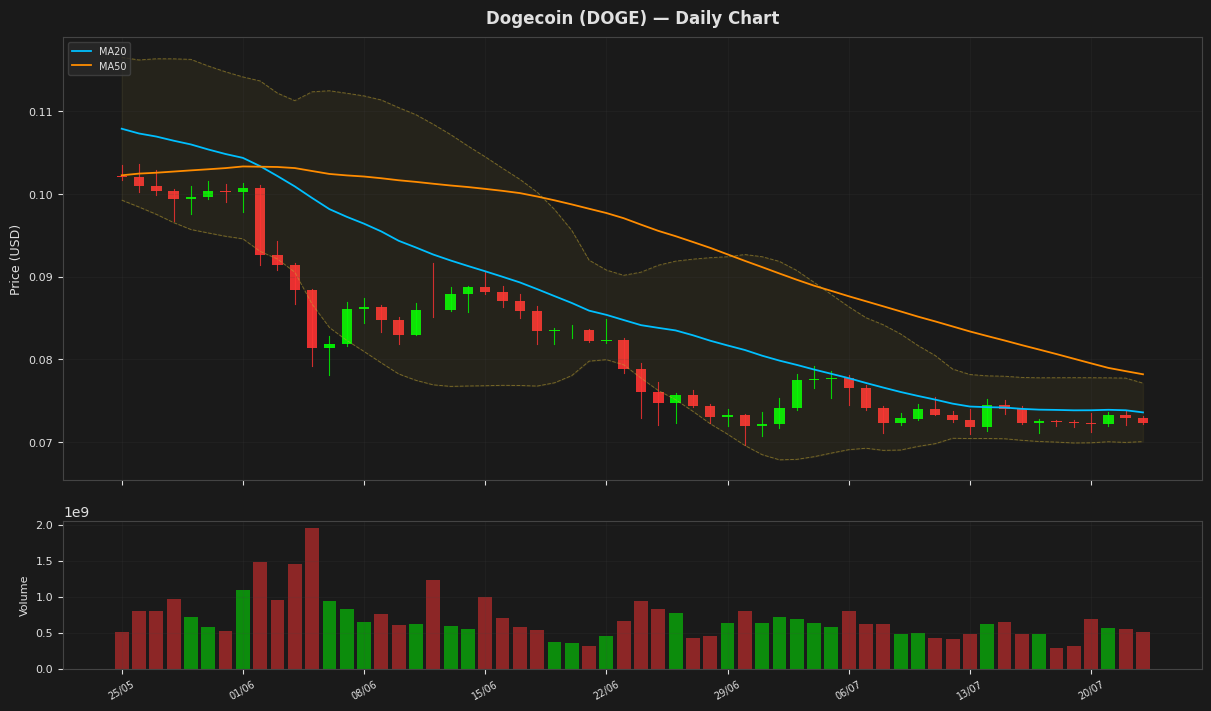
Dogecoin's price is currently at $0.072370, showing a slight decline, and is positioned between the Bollinger Band upper and lower limits, indicating a consolidating trend. The RSI value of 47.708761 suggests a neutral stance, not indicating overbought or oversold conditions. The MACD line is below the signal line, hinting at a bearish signal, while the price remains above the 52-week low, suggesting some support. The ATR indicates low volatility.
Disclaimer
The content on MarketsFN.com is provided for educational and informational purposes only. It does not constitute financial advice or investment recommendations. All investments involve risk. Past performance does not guarantee future results.