Crypto Market Slumps: BNB, Dogecoin, and Ethereum Lead Losses Today
· Crypto · QuoteReporter
Crypto Market Slumps: BNB, Dogecoin, and Ethereum Lead Losses Today
Crypto Market Report | June 19, 2026
📊 Crypto Market Overview
The cryptocurrency market is experiencing a downturn today, with major assets such as Bitcoin and Ethereum witnessing significant declines. Bitcoin's price has dropped by 2.88% to $62,560.60, while Ethereum has fallen by 3.07% to $1,694.14. Other notable cryptocurrencies, including BNB and Dogecoin, have also seen substantial losses, with declines of 4.52% and 4.01%, respectively.
The overall market sentiment appears to be bearish, with several key players exhibiting oversold conditions. Bitcoin's Relative Strength Index (RSI) stands at 46.0, while Ethereum's RSI is at 44.5, indicating a potential for a rebound. However, the Moving Average Convergence Divergence (MACD) indicators for both assets are in negative territory, suggesting a prevailing downtrend.
The macroeconomic context is also worth noting, with Goldman Sachs recently cutting its year-end gold target by $500, citing doubts about rate cuts. This development may be contributing to the current risk-off sentiment in the market. Meanwhile, the emergence of new stablecoins, such as AllUnity's SEKAU, a fully reserved Swedish krona stablecoin, highlights the ongoing innovation in the cryptocurrency space.
From a technical perspective, several cryptocurrencies are displaying interesting signals. Solana's RSI is at 59.4, indicating a relatively stronger position compared to other major assets. In contrast, Dogecoin's RSI is at 39.1, suggesting a potentially oversold condition. The MACD indicators for various assets, including Ripple and Tron, are also providing insight into their respective trends. Overall, the cryptocurrency market is currently characterized by a mix of bearish sentiment and technical signals, with various assets exhibiting different strengths and weaknesses.
📰 Crypto News
- Goldman Sachs cuts year-end gold target by $500, doubting rate cuts
- AllUnity debuts SEKAU, a fully reserved Swedish krona stablecoin
- Here’s what happened in crypto today
- Algorand plans ‘broad quantum resilience’ by 2027
- Microsoft warns users of 'Crypto Clipper' malware spread via USB drives
- US crypto ETFs are pulling Bitcoiners into TradFi: BlackRock's Jay Jacobs
- Celsius’ Mashinsky gets permanent trading ban in CFTC settlement
- Ether analysts predict another ‘selling wave’ as ETH struggles to overcome $1.7K
- Malta proposes DeFi rulebook covering DAOs under MiCA-era framework
- Bitcoin decouples from tech stocks: Is $60K BTC’s next stop?
- Ireland mulls crypto safeguards in response to financial risks
- US regulators push user ID requirements for stablecoin issuers akin to regulated banks
- Custodia, Vantage propose token that toggles between bank deposits and stablecoins
- XRP falls 3% after losing $1.15 support as breakout attempt fades
- Live markets: Bitcoin has traded below its mining cost for five months, squeezing miners
🔍 Technical Analysis
Bitcoin (BTC) — -2.88%
$62,560.60 52W: $59,108.92 — $122,509.66
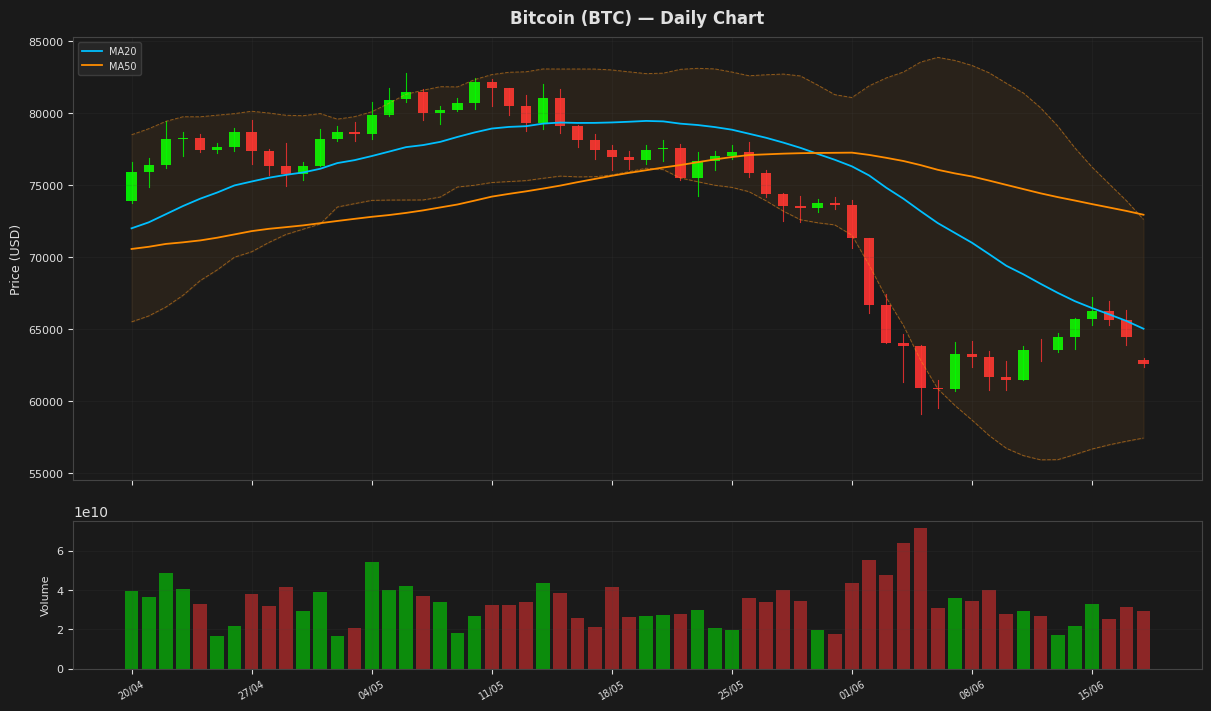
Bitcoin's price is currently at $62,560.60, showing a daily decline of 2.88% as it hovers near the lower end of its recent trading range, with the RSI indicating a neutral territory at 46.05. The MACD is below its signal line, suggesting a bearish momentum. The price is also below both the MA20 and MA50, and has room to move towards the lower Bollinger Band at $57,441.25.
Ethereum (ETH) — -3.07%
$1,694.14 52W: $1,506.51 — $4,395.57
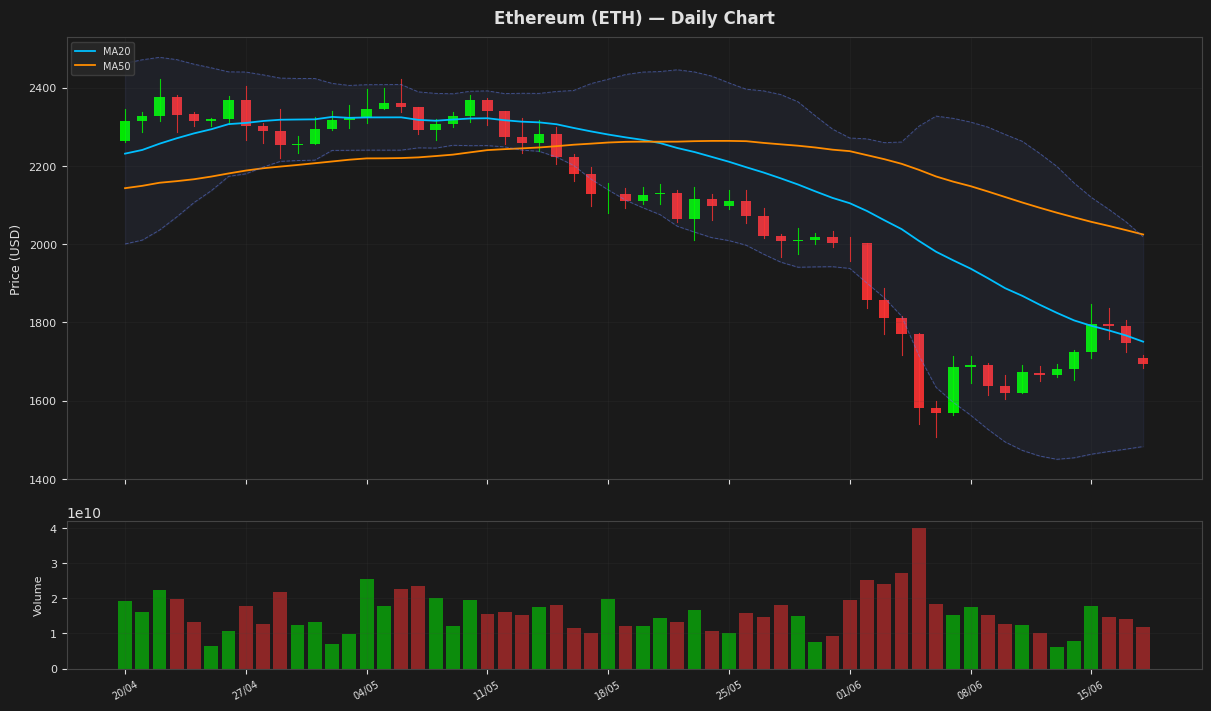
Ethereum's price is currently at $1,694.14, showing a decline of 3.07% for the day, as it trades below both its MA20 at $1,750.98 and MA50 at $2,024.88, indicating a bearish trend. The RSI(14) at 44.47 suggests the asset is nearing oversold territory, while the MACD at -84.78, below its signal line at -106.93, reinforces the negative momentum. The price is also below the upper Bollinger Band at $2,019.03 and above the lower band at $1,482.94.
Ripple (XRP) — -1.72%
$1.1257 52W: $1.0547 — $2.6934
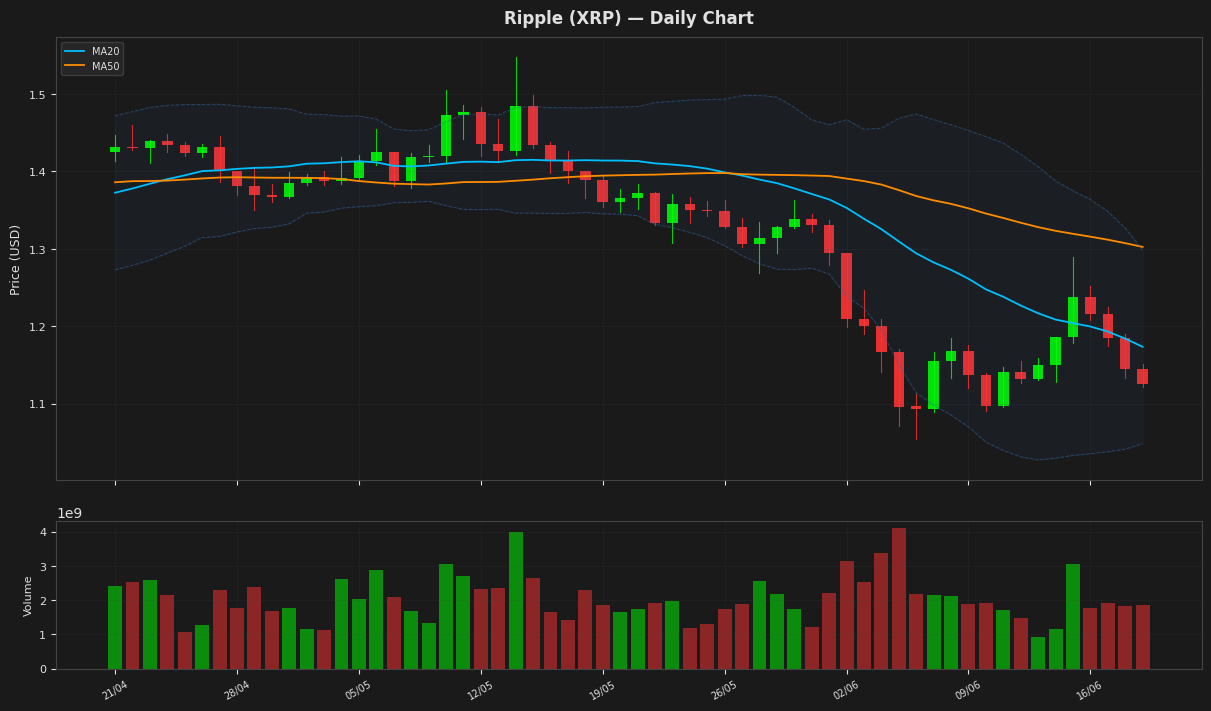
Ripple's price is currently at $1.125700, showing a decline of 1.72% for the day, and is positioned below both its 20-day and 50-day moving averages, indicating a bearish trend. The RSI is near neutral at 53.473784, while the MACD is below its signal line, suggesting a potential continuation of the downtrend. The price is also below the upper Bollinger Band, but above the lower band, indicating moderate volatility. The ATR suggests a relatively stable volatility environment.
Solana (SOL) — -1.75%
$68.4100 52W: $60.4147 — $211.1050
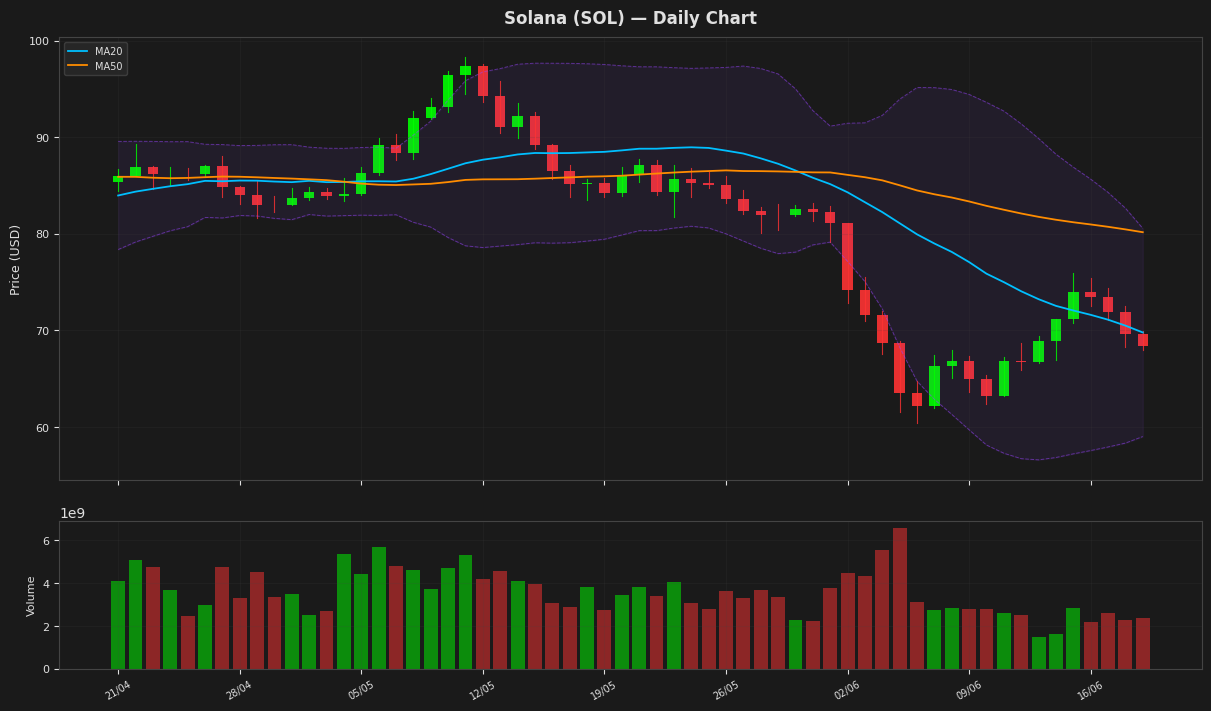
Solana's price is currently at $68.41, showing a decline of 1.75% for the day, and is positioned below both its 20-day and 50-day moving averages, indicating a bearish trend. The RSI reading of 59.44 suggests that the asset is nearing overbought territory but hasn't reached it yet. With the Bollinger Bands indicating an upper limit at $80.56 and a lower limit at $59.01, the price is within the bands, and the MACD being above its signal line suggests a potential for a slight recovery. The ATR indicates moderate volatility.
BNB (BNB) — -4.52%
$573.8000 52W: $558.3898 — $1,370.55
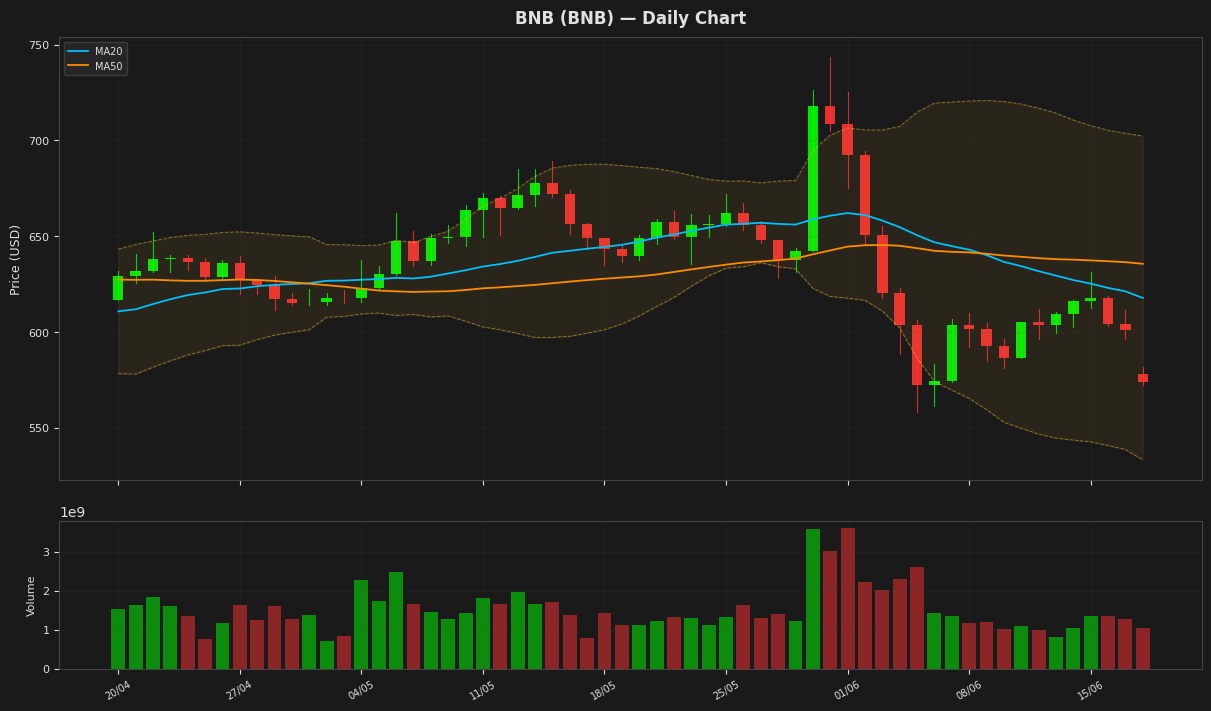
BNB is currently trading at $573.80, down 4.52% on the day, with its price hovering near the lower Bollinger Band at $533.17, indicating potential oversold conditions. The RSI(14) value of 40.61 suggests that the asset is approaching oversold territory, while the MACD is below its signal line, indicating a bearish trend. The price is also below both MA20 and MA50, further supporting the bearish sentiment.
Tron (TRX) — -0.01%
$0.320371 52W: $0.268138 — $0.376332
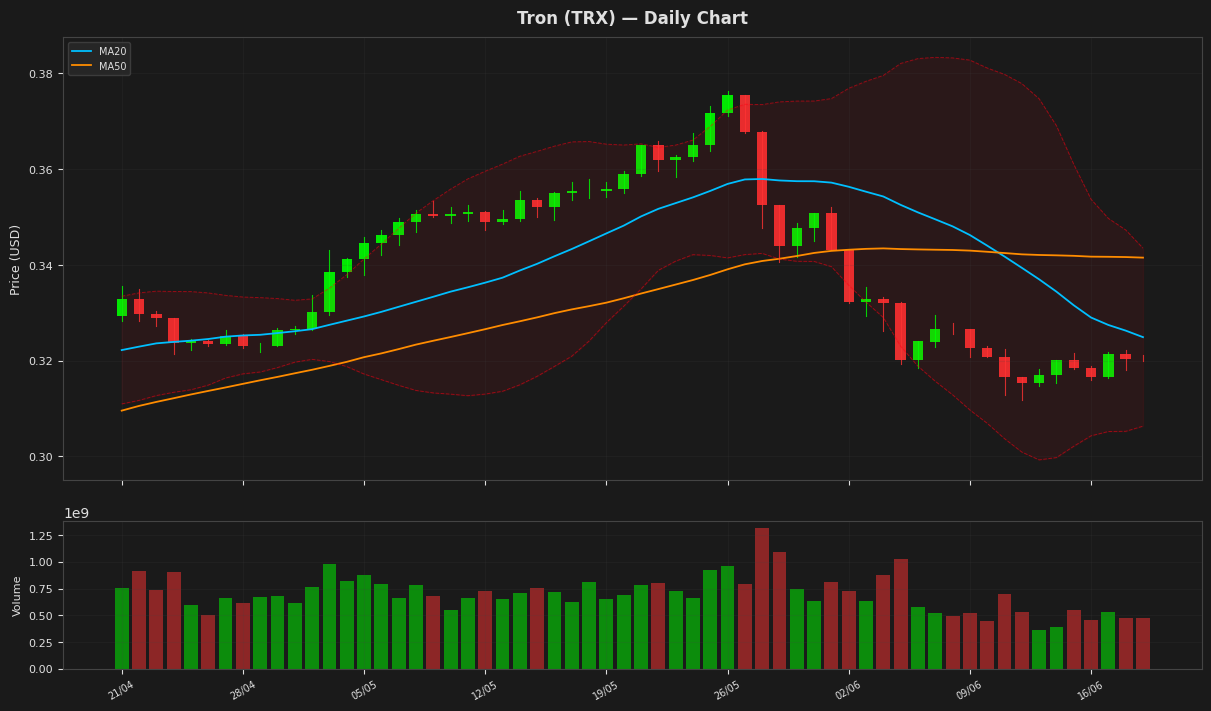
Tron's price is currently at $0.320371, showing a minimal daily change. The RSI is near 50, indicating a neutral market sentiment, while the MACD is slightly below its signal line, suggesting a potential bearish trend continuation. The price is also below both MA20 and MA50, and near the lower end of the Bollinger Bands, indicating a possible support level around $0.306326.
Dogecoin (DOGE) — -4.01%
$0.082360 52W: $0.078095 — $0.253624
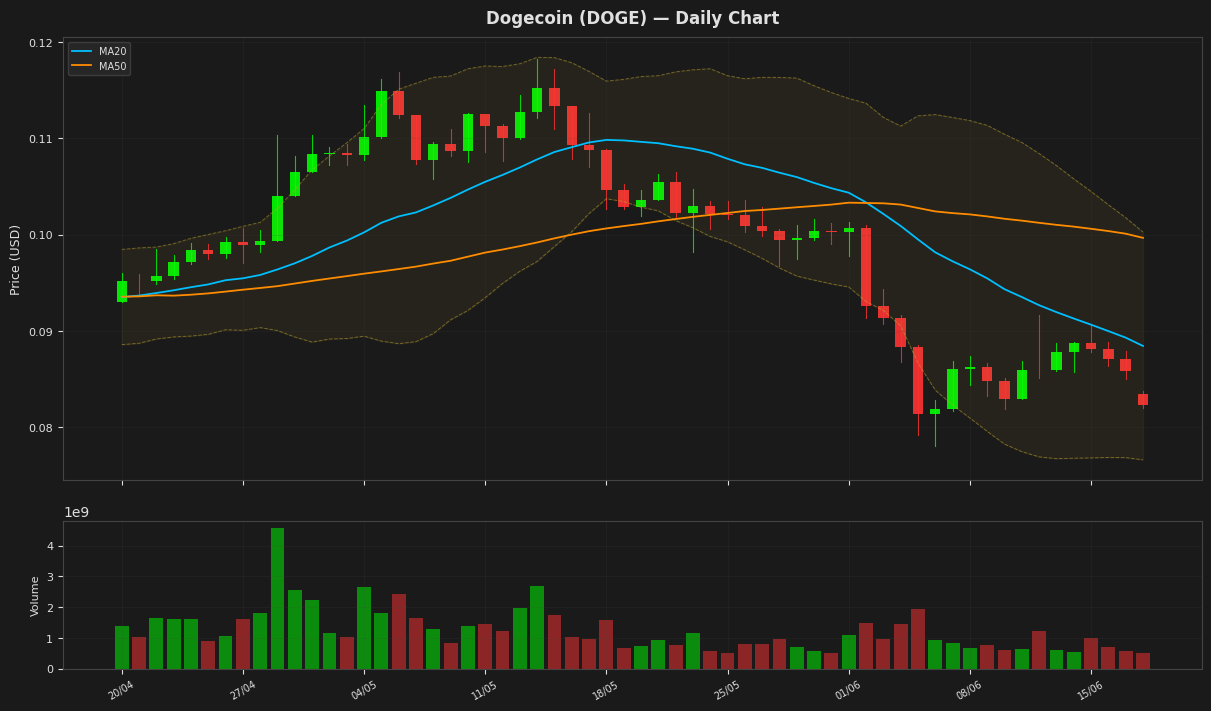
Dogecoin's price is currently at $0.082360, showing a daily decline of 4.01%. The RSI(14) value of 39.062494 indicates that the cryptocurrency is approaching oversold territory, while the MACD line is below the signal line, suggesting a bearish trend. The price is also near the lower Bollinger Band at 0.07662, indicating potential support. The ATR(14) suggests moderate volatility.
Disclaimer
The content on MarketsFN.com is provided for educational and informational purposes only. It does not constitute financial advice or investment recommendations. All investments involve risk. Past performance does not guarantee future results.