Crypto Market Slumps: BNB, Dogecoin, Ethereum Lead Today's Biggest Losses
· Crypto · QuoteReporter
Crypto Market Slumps: BNB, Dogecoin, Ethereum Lead Today's Biggest Losses
Crypto Market Report | June 19, 2026
📊 Crypto Market Overview
The cryptocurrency market is experiencing a downturn today, with most major assets trading in the red. Bitcoin, the largest cryptocurrency by market capitalization, has seen its value decline by 3.04% to $62,458.8984. Ethereum, the second-largest cryptocurrency, has also fallen by 3.10% to $1,693.7600. Other notable cryptocurrencies such as BNB and Dogecoin have seen significant declines of 4.74% and 4.02%, respectively.
The overall market sentiment is bearish, with many assets displaying oversold conditions on their Relative Strength Index (RSI). Bitcoin's RSI stands at 45.8, while Ethereum's is at 44.4, indicating a potential for a bounce back. The Moving Average Convergence Divergence (MACD) indicator is also in negative territory for most major assets, suggesting a prevailing downtrend.
In the macro context, the market is being influenced by traditional financial market trends. Goldman Sachs' decision to cut its year-end gold target by $500, citing doubts over rate cuts, has contributed to a risk-off sentiment. The emergence of new financial products, such as AllUnity's SEKAU, a fully reserved Swedish krona stablecoin, highlights the growing integration of cryptocurrencies with traditional finance.
Notable technical signals include the RSI and MACD indicators, which are providing insights into the current market dynamics. Bitcoin and Ethereum's MACD indicators are at -2472.0605 and -84.8129, respectively, indicating a strong bearish momentum. Meanwhile, Tron is one of the few cryptocurrencies that has managed to stay relatively stable, with a marginal gain of 0.04% today. The market is also being influenced by regulatory developments, with Malta proposing a DeFi rulebook that could potentially shape the future of the industry.
📰 Crypto News
- Goldman Sachs cuts year-end gold target by $500, doubting rate cuts
- AllUnity debuts SEKAU, a fully reserved Swedish krona stablecoin
- Here’s what happened in crypto today
- Algorand plans ‘broad quantum resilience’ by 2027
- Microsoft warns users of 'Crypto Clipper' malware spread via USB drives
- US crypto ETFs are pulling Bitcoiners into TradFi: BlackRock's Jay Jacobs
- Celsius’ Mashinsky gets permanent trading ban in CFTC settlement
- Ether analysts predict another ‘selling wave’ as ETH struggles to overcome $1.7K
- Malta proposes DeFi rulebook covering DAOs under MiCA-era framework
- Bitcoin decouples from tech stocks: Is $60K BTC’s next stop?
- Ireland mulls crypto safeguards in response to financial risks
- US regulators push user ID requirements for stablecoin issuers akin to regulated banks
- Microsoft found malware that hijacks crypto wallets and spreads through USB sticks
- XRP falls 3% after losing $1.15 support as breakout attempt fades
- Live markets: Bitcoin has traded below its mining cost for five months, squeezing miners
🔍 Technical Analysis
Bitcoin (BTC) — -3.04%
$62,458.90 52W: $59,108.92 — $122,509.66
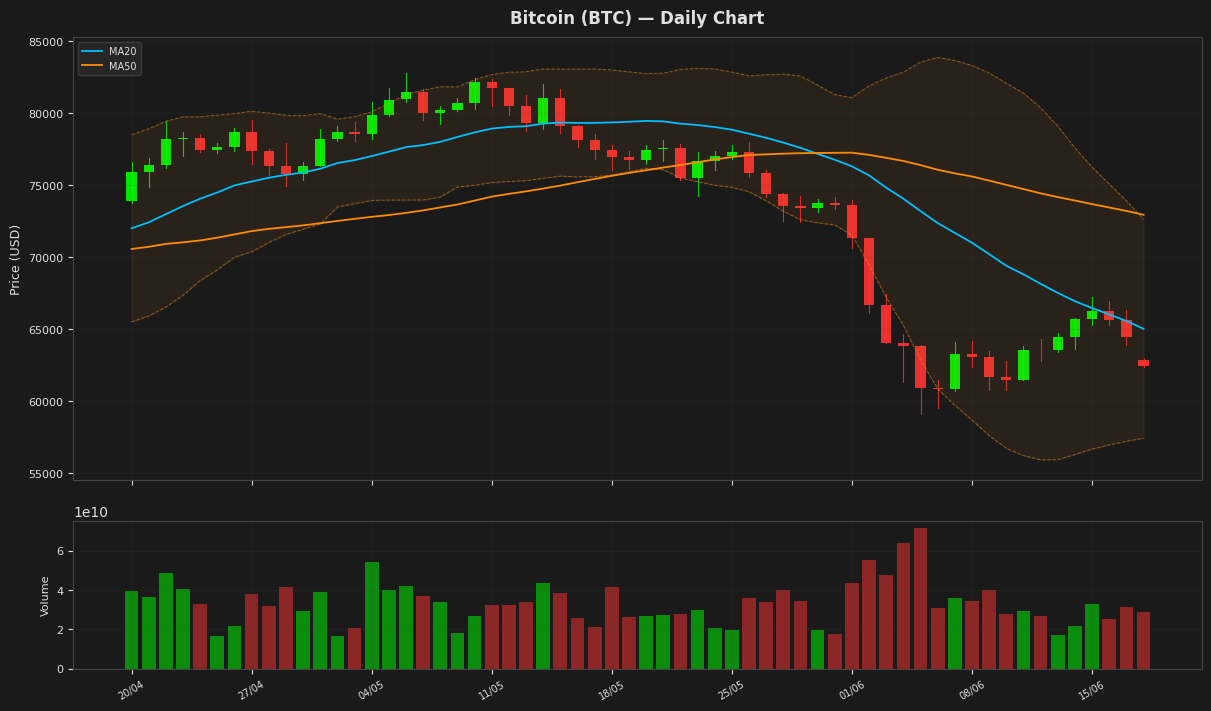
Bitcoin's price is currently at $62,458.898438, showing a daily decline of 3.04%, and is positioned below both its MA20 and MA50, indicating a bearish trend. The RSI(14) value of 45.751838 suggests that the asset is nearing oversold territory but hasn't reached it yet. The MACD is below its signal line, further reinforcing the bearish sentiment. The price is also within the Bollinger Bands, with the upper and lower bands at $72,609.987171 and $57,429.074547 respectively.
Ethereum (ETH) — -3.10%
$1,693.76 52W: $1,506.51 — $4,395.57
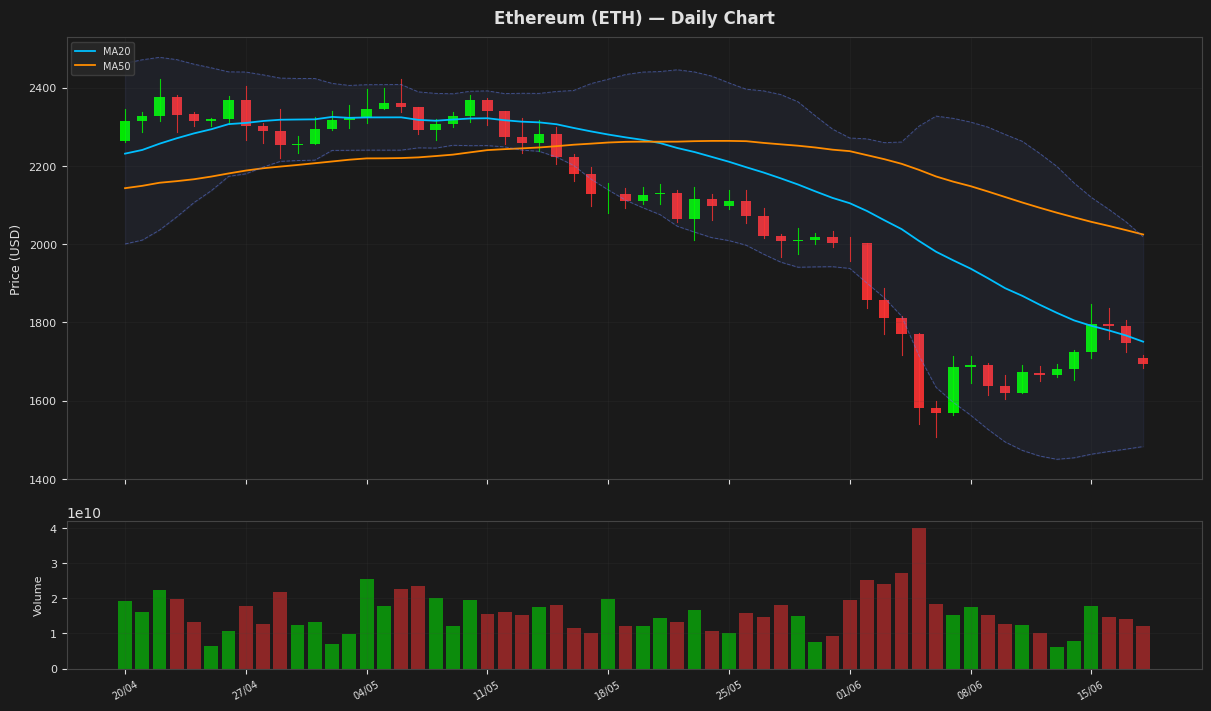
Ethereum's price is currently at $1,693.76, showing a decline of 3.10% for the day, and is positioned near the middle of its recent trading range as it is below both its MA20 and MA50. The RSI is at 44.445665, indicating a neutral to slightly bearish sentiment. The MACD is below its signal line, suggesting a potential continuation of the downtrend. The price is also below the upper Bollinger Band, indicating a lack of strong upward momentum.
Ripple (XRP) — -1.93%
$1.1233 52W: $1.0547 — $2.6934
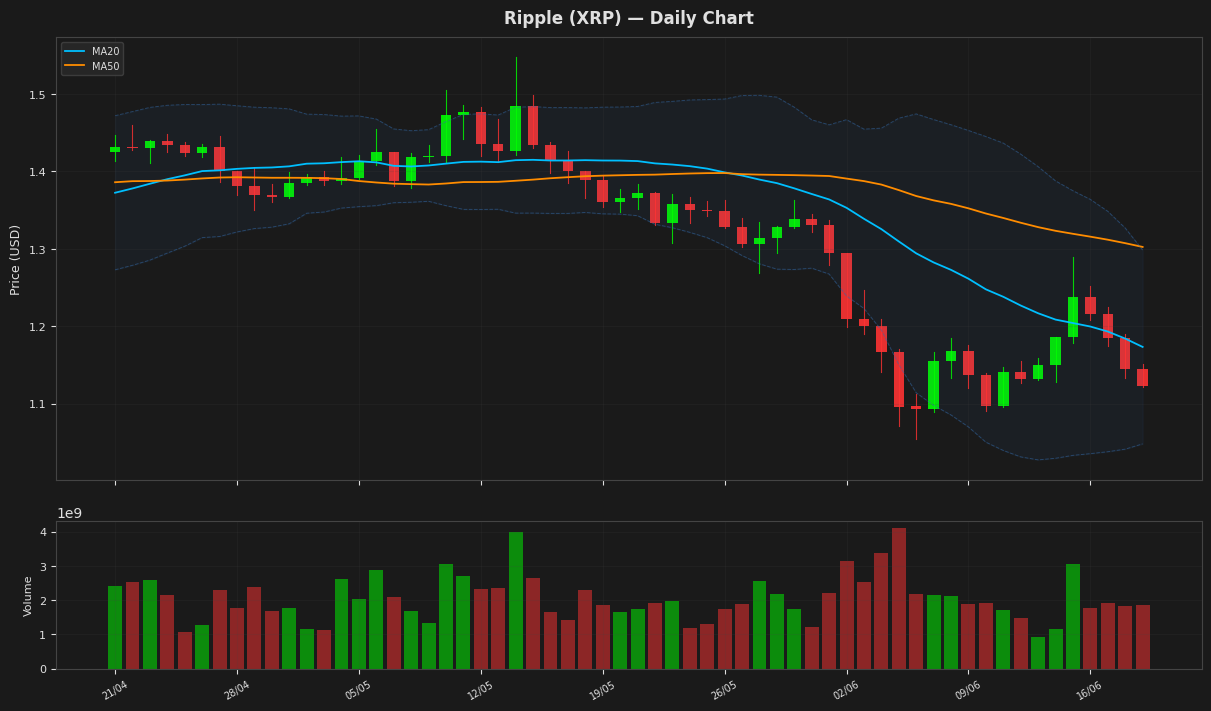
Ripple's price is currently at $1.123300, showing a decline of 1.93% for the day, and is positioned below both its 20-day and 50-day moving averages, indicating a bearish trend. The RSI is at 53.17082, suggesting neutral territory, while the MACD is below its signal line, reinforcing the bearish sentiment. The price is also below the upper Bollinger Band, indicating a lack of strong upward momentum. The ATR suggests moderate volatility.
Solana (SOL) — -1.68%
$68.4600 52W: $60.4147 — $211.1050
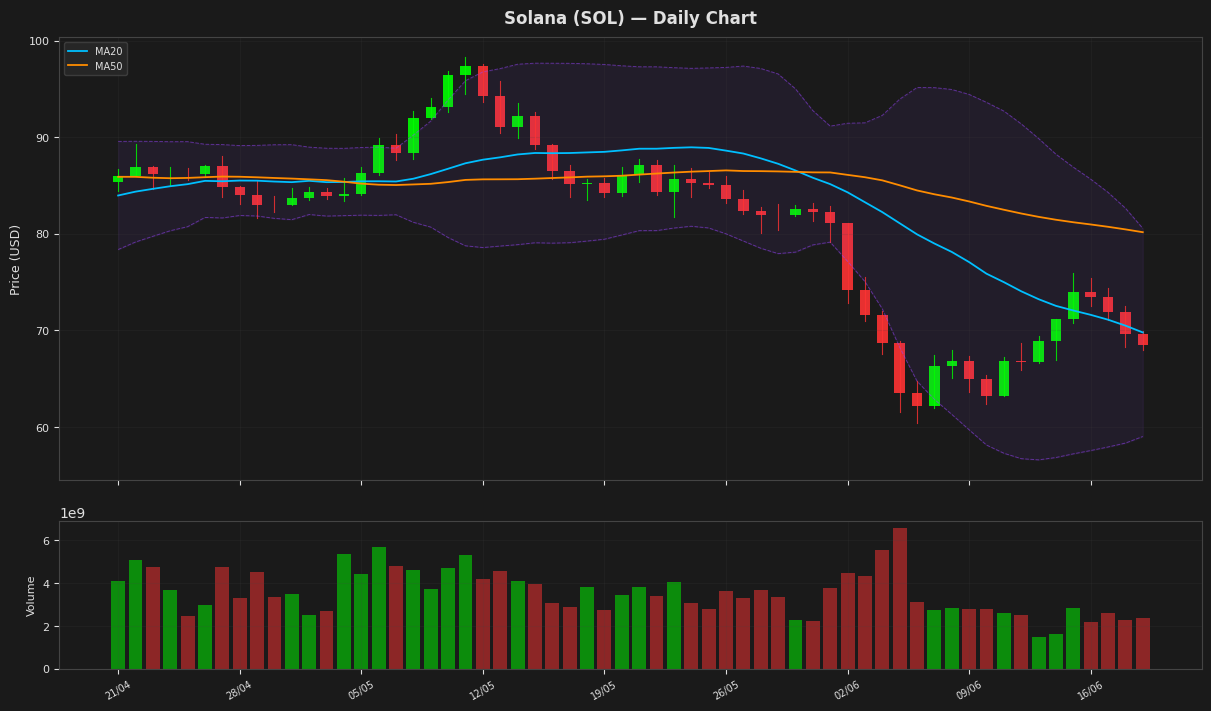
Solana's current price is $68.46, showing a decline of 1.68% for the day, as it continues to trade below its MA20 at $69.79 and MA50 at $80.17, indicating a downtrend. The RSI at 59.56 suggests the asset is not overbought or oversold, while the MACD being above its signal line indicates a potential bullish signal. The price is currently within the Bollinger Bands, with the upper band at $80.56 and lower band at $59.02.
BNB (BNB) — -4.74%
$572.5000 52W: $558.3898 — $1,370.55
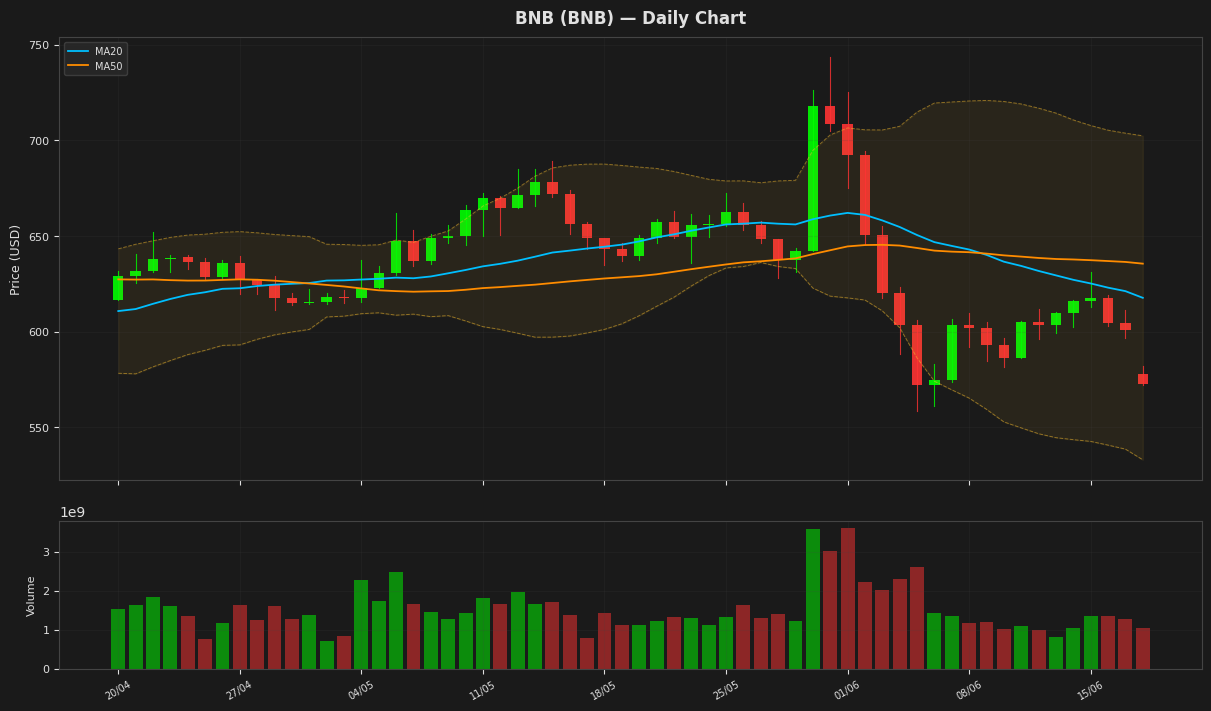
BNB is currently trading at $572.50, down 4.74% for the day, as it continues to test the lower end of its recent trading range. The price is near the lower Bollinger Band at $532.96, indicating potential oversold conditions, with the RSI(14) at 40.28. The MACD is negative and below its signal line, suggesting bearish momentum. The price is also below both the MA20 and MA50, further indicating a downtrend.
Tron (TRX) — +0.04%
$0.320543 52W: $0.268138 — $0.376332
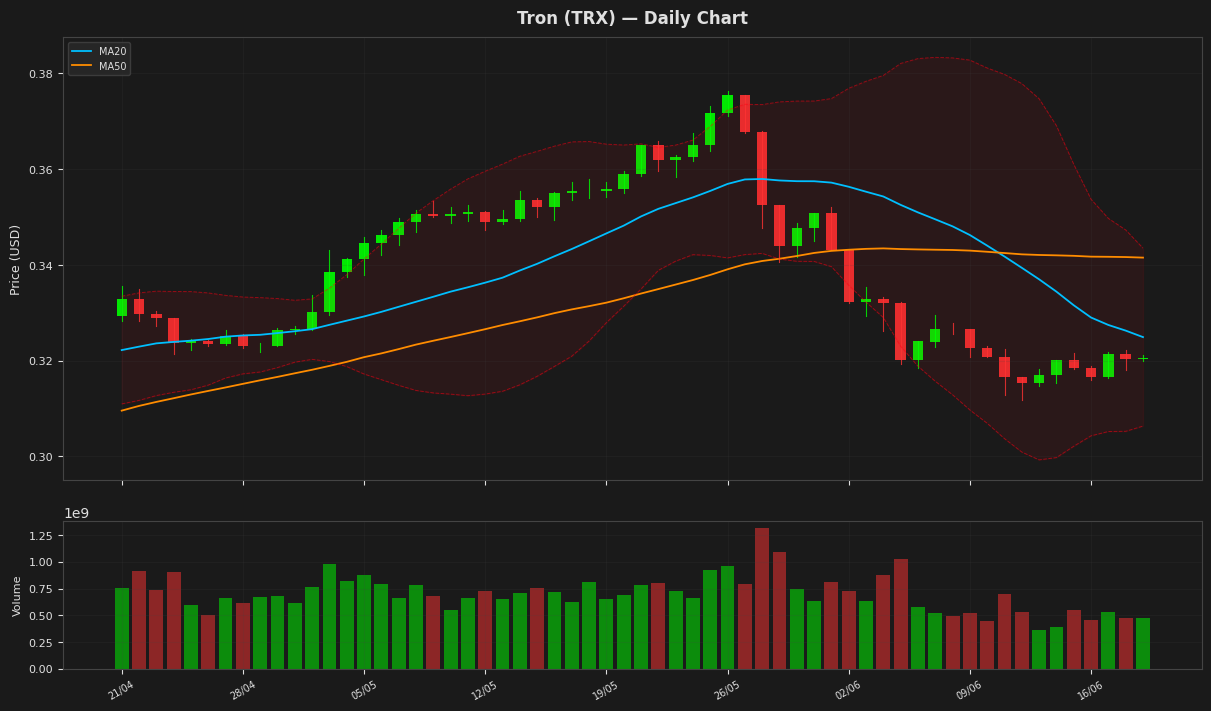
Tron's price is currently at $0.320543, showing a minimal daily change of +0.04%. The RSI value of 50.713924 indicates a neutral market sentiment, while the MACD being below its signal line suggests a slightly bearish trend. The price is also below both MA20 and MA50, and near the lower end of the Bollinger Bands, indicating potential support around the lower band at $0.306343.
Dogecoin (DOGE) — -4.02%
$0.082350 52W: $0.078095 — $0.253624
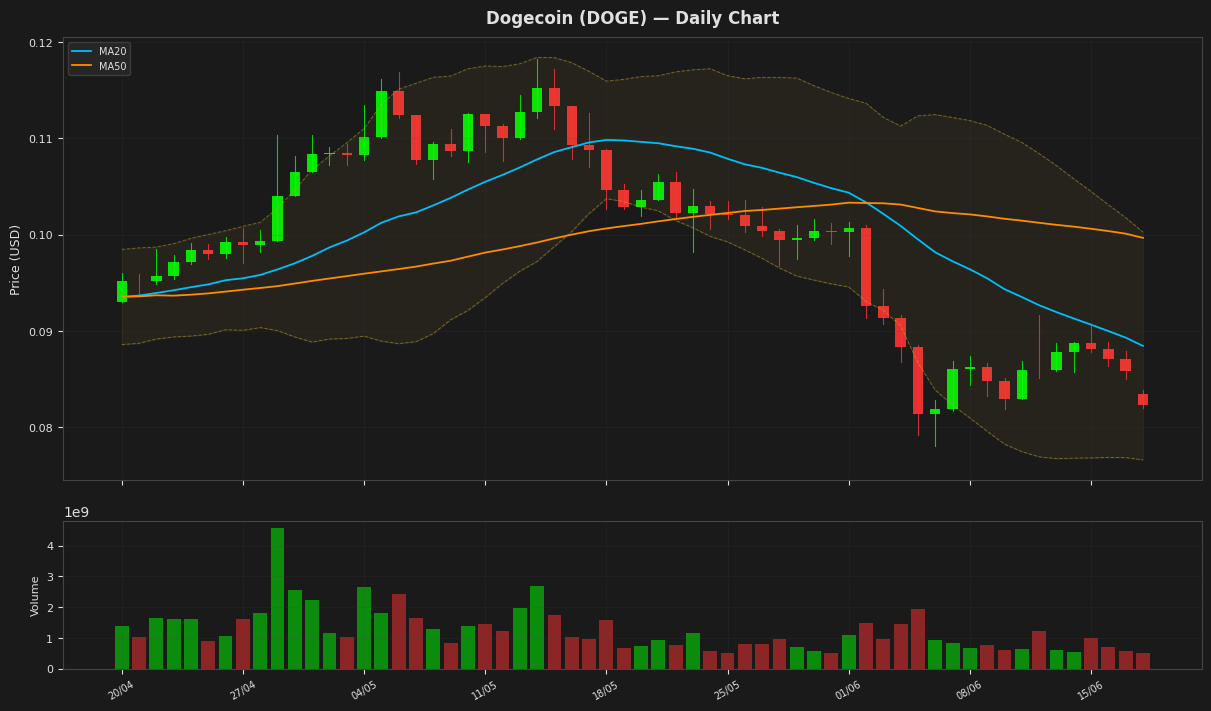
Dogecoin's price is currently at $0.082350, showing a decline of 4.02% for the day, as it continues to trade below both its 20-day and 50-day moving averages of 0.088449 and 0.099677 respectively. The Relative Strength Index (RSI) stands at 39.048306, indicating the cryptocurrency is approaching oversold territory. The Bollinger Bands suggest support around the lower band at 0.076618.
Disclaimer
The content on MarketsFN.com is provided for educational and informational purposes only. It does not constitute financial advice or investment recommendations. All investments involve risk. Past performance does not guarantee future results.