Crypto Market Slumps: BNB, Solana, and Dogecoin Lead Top Losers Today
· Crypto · QuoteReporter
Crypto Market Slumps: BNB, Solana, and Dogecoin Lead Top Losers Today
Crypto Market Report | June 04, 2026
📊 Crypto Market Overview
The cryptocurrency market is currently experiencing a downturn, with most major assets trading in the red. Bitcoin, the largest cryptocurrency by market capitalization, has seen a decline of 0.45% over the past 24 hours, trading at $63,728.1797. Other major cryptocurrencies, including Ethereum, Ripple, Solana, and BNB, have also seen significant losses, with Solana and BNB leading the decline with losses of 2.45% and 2.83%, respectively.
From a technical perspective, several major cryptocurrencies are exhibiting oversold conditions, as indicated by their Relative Strength Index (RSI) values. Bitcoin's RSI is currently at 12.0, while Solana's RSI is at 9.3, and Dogecoin's RSI is at 10.6. These low RSI values suggest that these assets may be due for a potential bounce. The Moving Average Convergence Divergence (MACD) indicator is also showing negative values for most major cryptocurrencies, indicating a bearish trend.
The macroeconomic context continues to influence the cryptocurrency market, with regulatory developments and news headlines shaping market sentiment. Recent news has highlighted the growing scrutiny of cryptocurrency-related activities, with Coinbase freezing $3 million tied to Southeast Asia crypto fraud networks. Additionally, the US Treasury secretary has signaled progress on the Bitcoin reserve and the CLARITY Act, while Revolut US bank plans to offer stablecoins alongside FDIC-insured accounts. The overall market sentiment remains cautious, with investors closely monitoring these developments and their potential impact on the market. The recent primary election outcomes in the US, where Crypto PAC-supported candidates were successful, may also have implications for future regulatory decisions.
📰 Crypto News
- About 67% of banned Anthropic accounts used AI to prep for cyberattacks
- Bitmine eyes dividend-paying preferred shares, echoing Strategy’s playbook
- Coinbase freezes $3M tied to Southeast Asia crypto fraud networks
- CFTC follows SEC in scrapping ‘no-deny’ policy for settlements
- Israel’s tax authority ‘disappointed’ in voluntary crypto disclosures: Report
- Wyoming executive order to guide AI data center development
- US Treasury secretary signals progress on Bitcoin reserve, CLARITY Act
- Revolut US bank plans stablecoins alongside FDIC-insured accounts: Report
- Price predictions 6/3: BTC, ETH, BNB, XRP, SOL, HYPE, DOGE, ZEC, ADA, XLM
- Crypto PAC-supported candidates sweep US state primaries after media buys
- Apyx's STRC collateralized stablecoin suffers a brief depeg. Protocol says its a feature, not bug
- BTC, ETH, SOL and XRP ETFs bleed $4.4 billion over 13 sessions, only HYPE in green
- Bitcoin briefly drops below $62,000 as $1.5 billion in crypto longs get wiped out
- Live Markets: Bitcoin bounces to $64,000 in classic oversold rebound
- Bitcoin tanks below $63,000 for the first time since February as price selloff deepens
🔍 Technical Analysis
Bitcoin (BTC) — -0.45%
$63,728.18 52W: $60,074.20 — $126,198.07
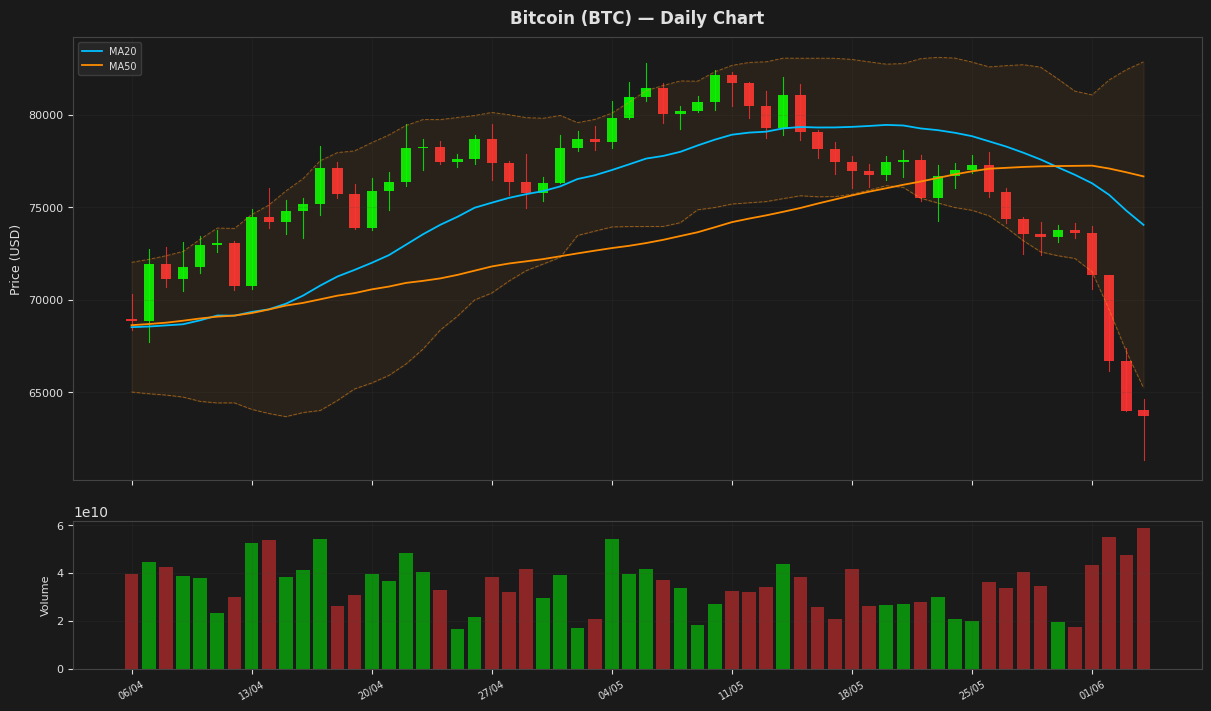
Bitcoin's price is currently at $63,728, showing a minor decline of 0.45% and is nearing the lower band of the Bollinger Bands at $65,235. The RSI is at 11.97, indicating an oversold condition, which could potentially lead to a bounce. The MACD is below its signal line, suggesting a bearish trend. The ATR indicates high volatility, suggesting significant price movements are possible.
Ethereum (ETH) — -1.89%
$1,777.48 52W: $1,717.80 — $4,755.22
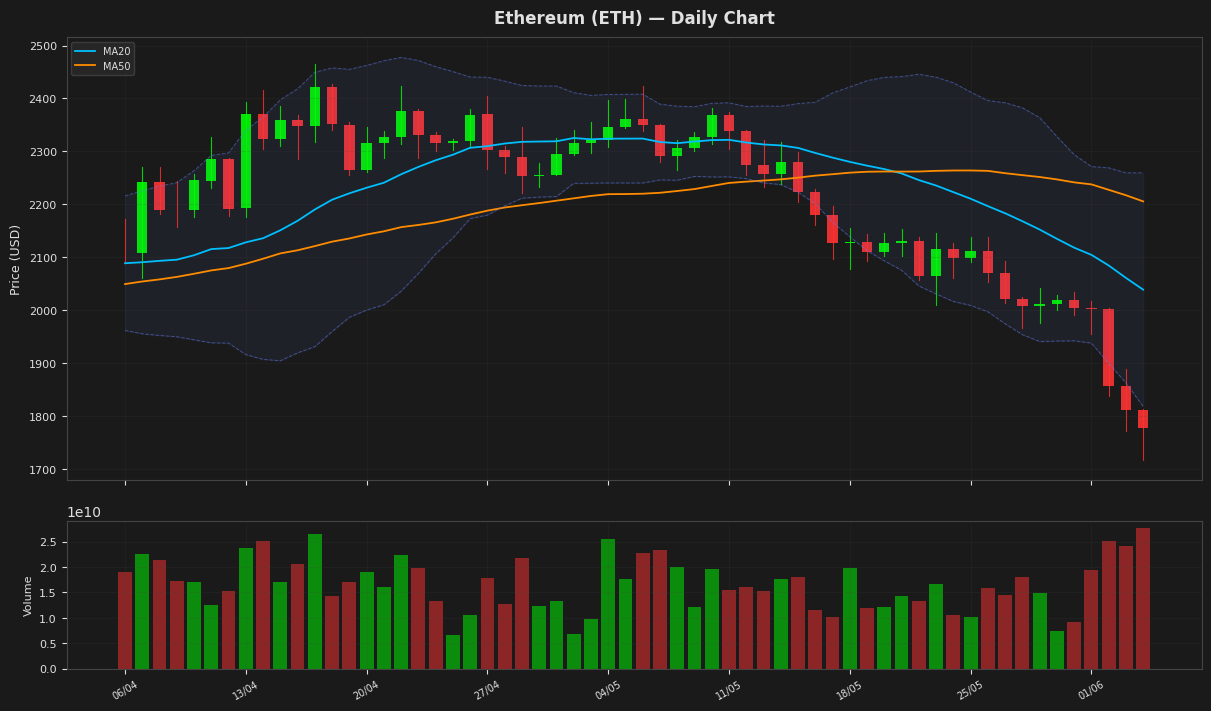
Ethereum's price is currently at $1,777.48, nearing the lower Bollinger Band at $1,818.47, indicating a potential oversold condition as the RSI(14) is at 15.10. The MACD is below its signal line, suggesting a bearish trend. The price is also close to its 52-week low of $1,717.80, potentially providing support.
Ripple (XRP) — -1.60%
$1.1810 52W: $1.1335 — $3.0993
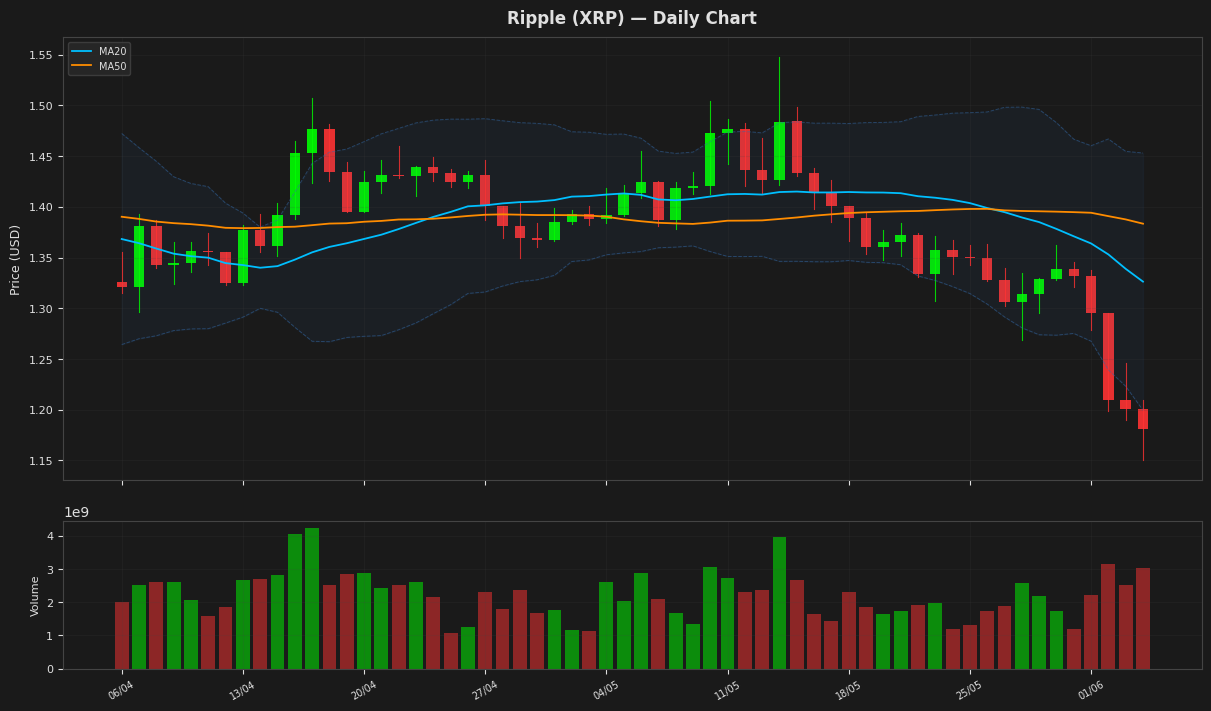
Ripple's price is currently at $1.181000, showing a daily decline of 1.60%, and is positioned near the lower Bollinger Band at 1.19936, indicating potential oversold conditions. The RSI(14) value of 18.471755 further supports this, as it is below 20, typically considered oversold territory. The MACD is below its signal line, suggesting bearish momentum. The price is also below both MA20 and MA50, indicating a downtrend.
Solana (SOL) — -2.45%
$69.8600 52W: $67.6651 — $237.3225
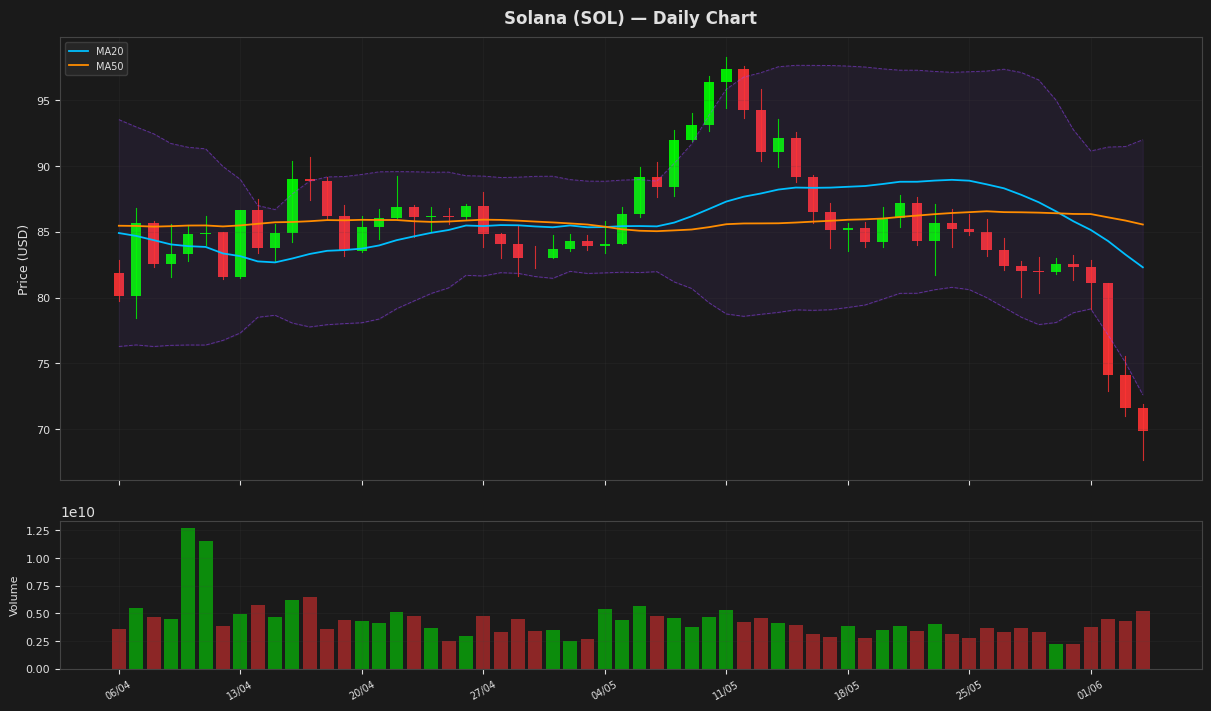
Solana's price is currently at $69.86, showing a decline of 2.45% for the day, and is positioned near the lower Bollinger Band at $72.61, indicating potential oversold conditions. The RSI(14) reading of 9.26 further supports this, suggesting the asset may be due for a rebound. The MACD is below its signal line, indicating bearish momentum, but the proximity to the 52-week low of $67.67 may limit further downside.
BNB (BNB) — -2.83%
$602.5800 52W: $570.6840 — $1,370.55
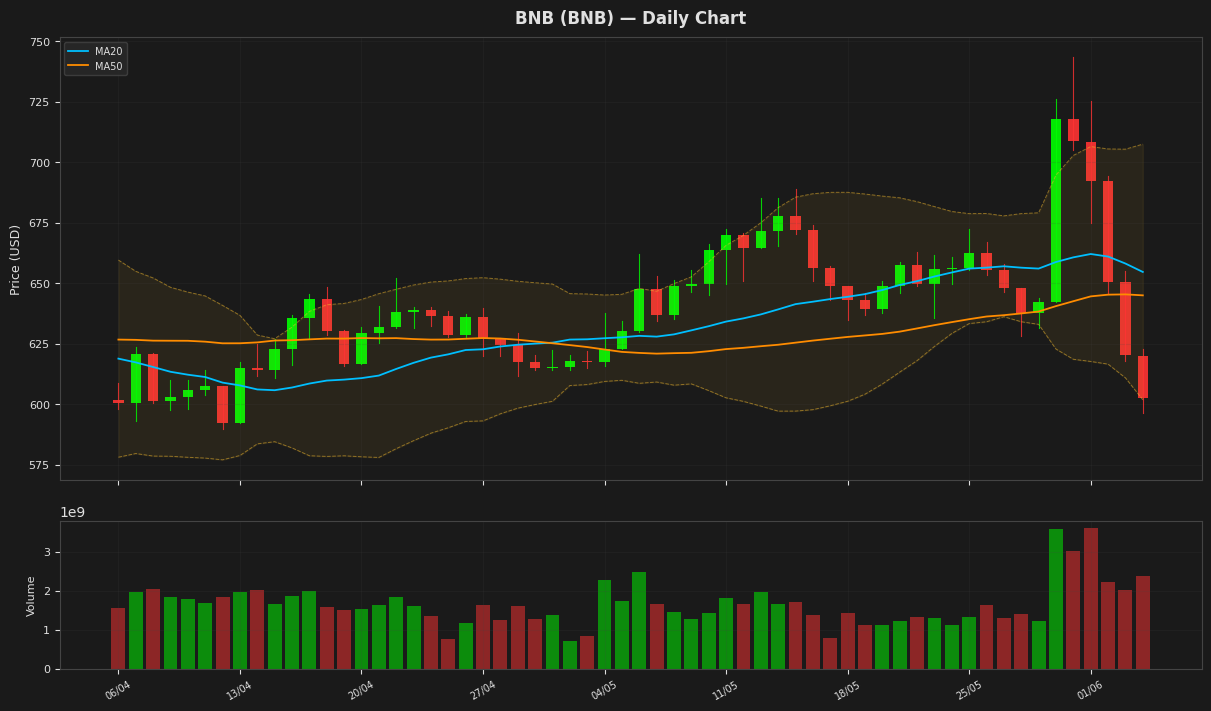
BNB is currently trading at $602.58, near its lower Bollinger Band of $601.79, indicating a potential support level. The RSI(14) at 38.65 suggests that the asset is approaching oversold territory, while the MACD is below its signal line, indicating a bearish trend. The price is also below both MA20 and MA50, further reinforcing the bearish sentiment. The ATR(14) of 29.41 indicates moderate volatility.
Tron (TRX) — -0.32%
$0.331888 52W: $0.268138 — $0.376332
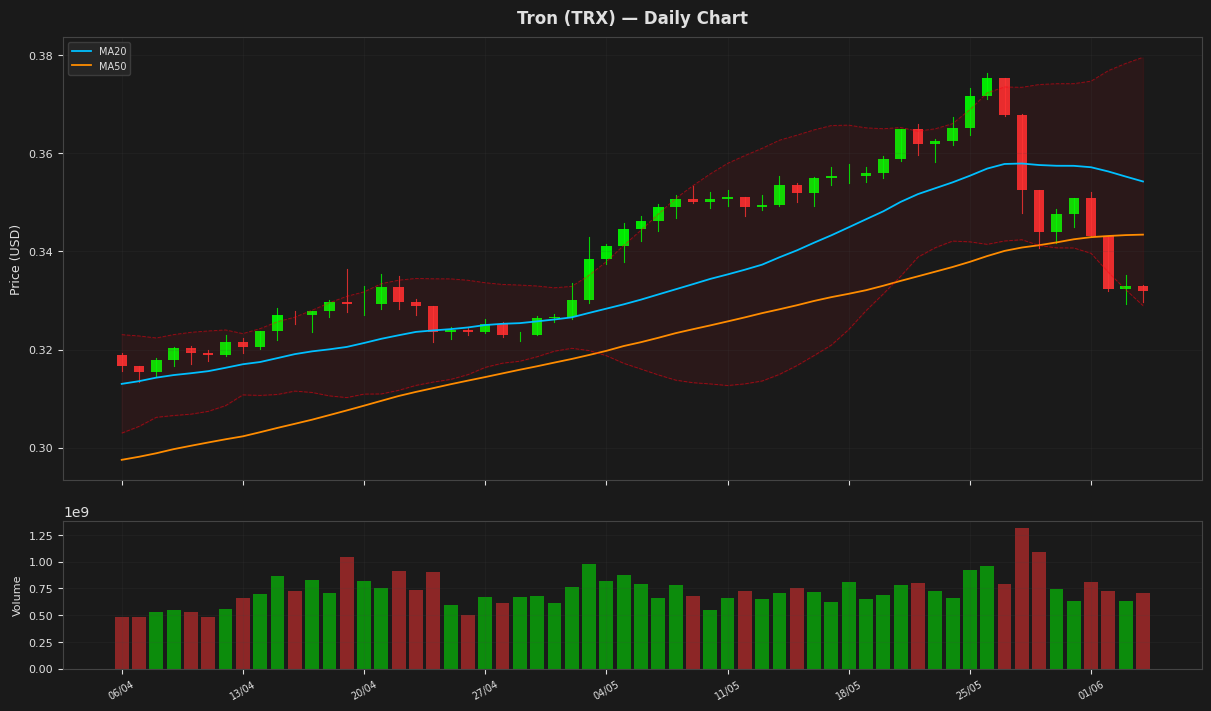
Tron's price is currently at $0.331888, near the lower Bollinger Band at $0.328969, indicating a potential oversold condition as the RSI(14) is at 27.939967. The MACD is below its signal line, suggesting a bearish trend. The Average True Range indicates low volatility, with a value of 0.008127. The price is also below both MA20 and MA50, reinforcing the bearish sentiment.
Dogecoin (DOGE) — -2.32%
$0.089240 52W: $0.081573 — $0.270047
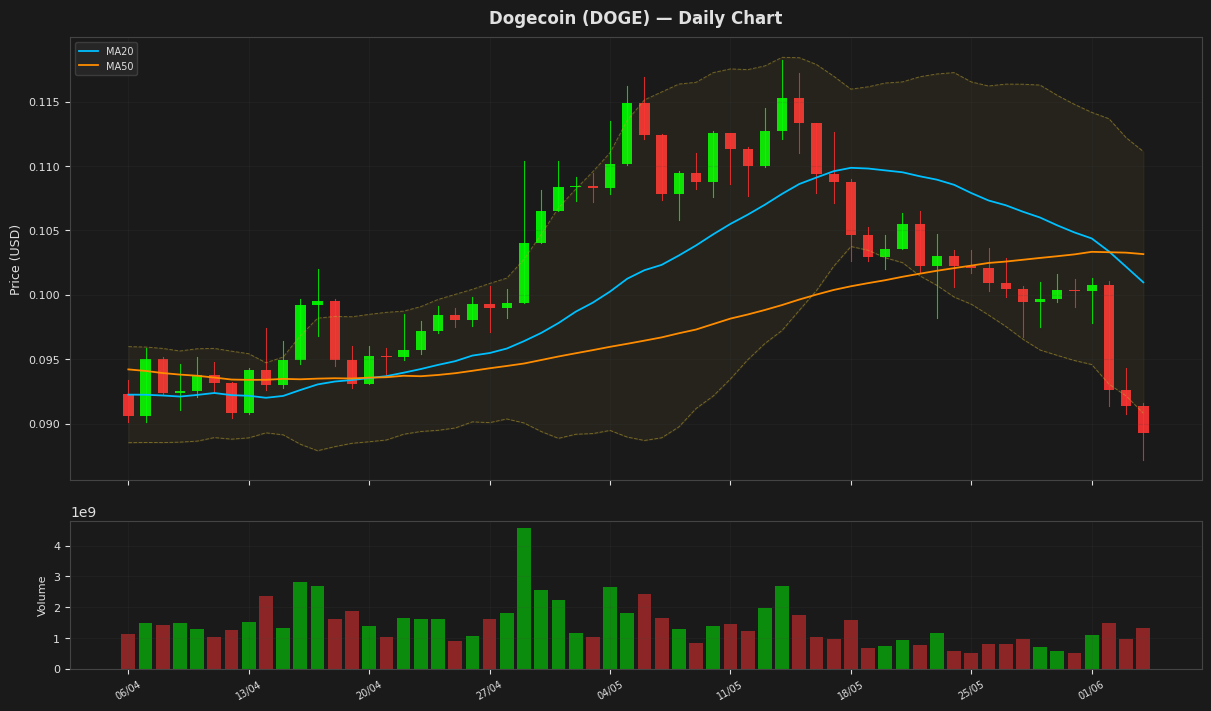
Dogecoin's price is currently at $0.089240, showing a daily decline of 2.32% and trading near the lower Bollinger Band at 0.090802, indicating potential oversold conditions. The RSI(14) value of 10.571499 further supports this, suggesting the cryptocurrency may be due for a rebound. The MACD line is below the signal line, indicating a bearish trend, but the significant oversold RSI reading could signal a potential reversal.
Disclaimer
The content on MarketsFN.com is provided for educational and informational purposes only. It does not constitute financial advice or investment recommendations. All investments involve risk. Past performance does not guarantee future results.