Crypto Market Slumps: Dogecoin, Ethereum, Solana Lead Top Losers Today
· Crypto · QuoteReporter
Crypto Market Slumps: Dogecoin, Ethereum, Solana Lead Top Losers Today
Crypto Market Report | July 16, 2026
📊 Crypto Market Overview
The cryptocurrency market is currently experiencing a subdued trading environment, with most major assets recording minor losses. Bitcoin, the largest cryptocurrency by market capitalization, is trading at $64,089.7383, down 0.96% on the day, while its relative strength index (RSI) stands at 61.2, indicating a neutral sentiment. The MACD indicator is at 93.0222, suggesting a continued bullish trend.
Ethereum, the second-largest cryptocurrency, has underperformed Bitcoin, with a 1.40% daily decline to $1,890.0300. Its RSI is at 72.0, nearing overbought territory, while the MACD is at 38.0803, indicating a strong uptrend. Other major cryptocurrencies, such as Ripple, Solana, and Dogecoin, have also recorded losses, with Solana's RSI at 35.4, indicating oversold conditions.
The macroeconomic context remains a key driver of market sentiment, with recent news headlines influencing investor attitudes. The unanimous opposition by the U.S. Senate to clemency for FTX founder Sam Bankman-Fried and the movement of a dormant bitcoin wallet containing $383 million have been notable developments. Additionally, the return of ETF money to Ether, largely driven by BlackRock's fund, has seen it outperform Bitcoin.
Notable technical signals include Ethereum's RSI nearing overbought territory and Solana's oversold conditions. The MACD indicators for most major cryptocurrencies suggest a continued trend, with Bitcoin and Ethereum remaining in bullish territory. Overall, the market sentiment remains cautious, with investors closely monitoring macroeconomic developments and technical signals. The recent news and market movements have not significantly altered the overall market direction, with most assets trading within established ranges.
Ethereum, the second-largest cryptocurrency, has underperformed Bitcoin, with a 1.40% daily decline to $1,890.0300. Its RSI is at 72.0, nearing overbought territory, while the MACD is at 38.0803, indicating a strong uptrend. Other major cryptocurrencies, such as Ripple, Solana, and Dogecoin, have also recorded losses, with Solana's RSI at 35.4, indicating oversold conditions.
The macroeconomic context remains a key driver of market sentiment, with recent news headlines influencing investor attitudes. The unanimous opposition by the U.S. Senate to clemency for FTX founder Sam Bankman-Fried and the movement of a dormant bitcoin wallet containing $383 million have been notable developments. Additionally, the return of ETF money to Ether, largely driven by BlackRock's fund, has seen it outperform Bitcoin.
Notable technical signals include Ethereum's RSI nearing overbought territory and Solana's oversold conditions. The MACD indicators for most major cryptocurrencies suggest a continued trend, with Bitcoin and Ethereum remaining in bullish territory. Overall, the market sentiment remains cautious, with investors closely monitoring macroeconomic developments and technical signals. The recent news and market movements have not significantly altered the overall market direction, with most assets trading within established ranges.
📰 Crypto News
- Bitcoin $107K buyers providing ‘early signals’ of 2026 bear-market bottom: Glassnode
- Robinhood Chain memecoin launchpad Vlad.fun halts after ‘internal integrity’ issue
- Hyperion DeFi to deploy 500K HYPE for Hyperliquid HIP-3 markets
- Here’s what happened in crypto today
- Trump to meet with senators over CLARITY Act on Thursday: Politico
- Base’s social bet left it trailing in prediction markets and perps: Pollak
- Live updates: ZachXBT calls hardware wallets complete garbage; BTC steady after Korea rate hike
- U.S. Senate unanimously opposes clemency for FTX founder Sam Bankman-Fried
- A bitcoin wallet dormant since the 2017 peak just moved $383 million
- Ether outruns bitcoin as ETF money returns, almost all of from BlackRock's fund
- Two groups of bitcoin investors sell on the rise as U.S. inflation lifts prices to nearly $65,000
- Why Analysts Aren’t Worried About Coinbase’s 30% Drop
- OpenAI Uses AI Red Team to Strengthen GPT-5.6 Against Prompt Injection Attacks
🔍 Technical Analysis
Bitcoin (BTC) — -0.96%
$64,089.74 52W: $57,747.77 — $107,428.26
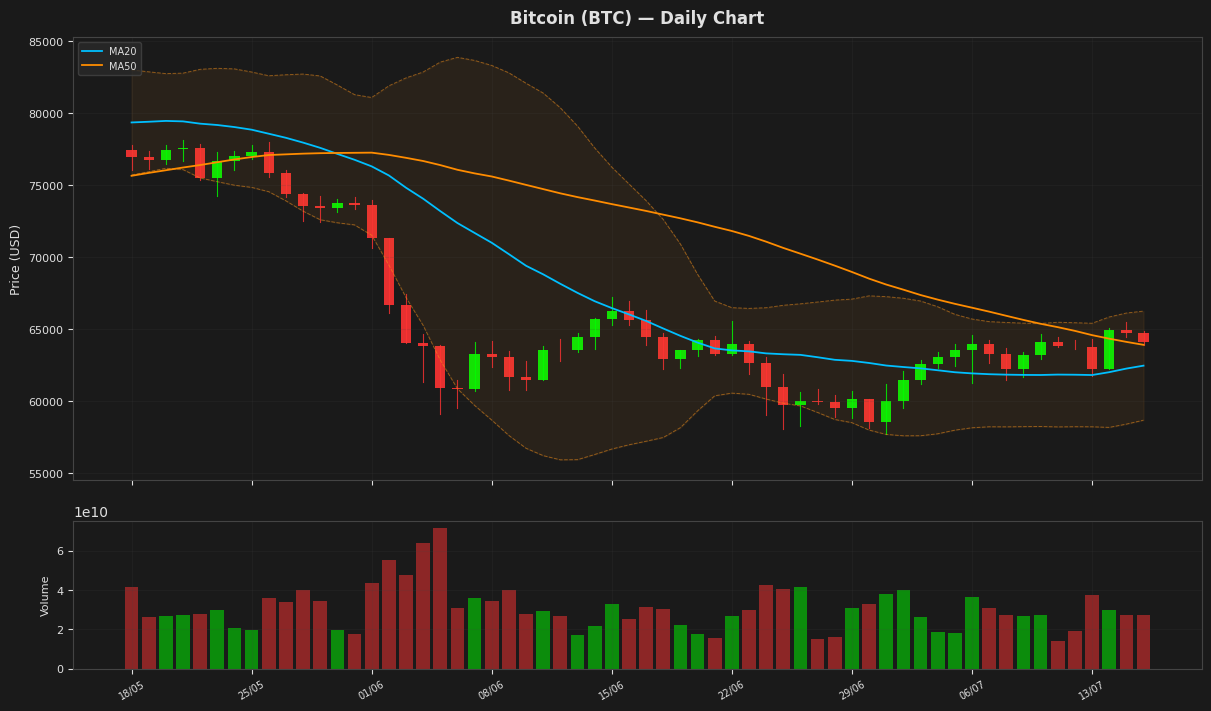
Bitcoin is currently trading at $64,089.74, slightly below its 50-day moving average of $63,907.51, indicating a neutral short-term trend. The Relative Strength Index (RSI) at 61.24 suggests that the cryptocurrency is nearing overbought territory but still has room to maneuver. The MACD indicator is above its signal line, indicating a potential bullish crossover, although the signal line remains in negative territory.
Ethereum (ETH) — -1.40%
$1,890.03 52W: $1,506.51 — $3,656.15
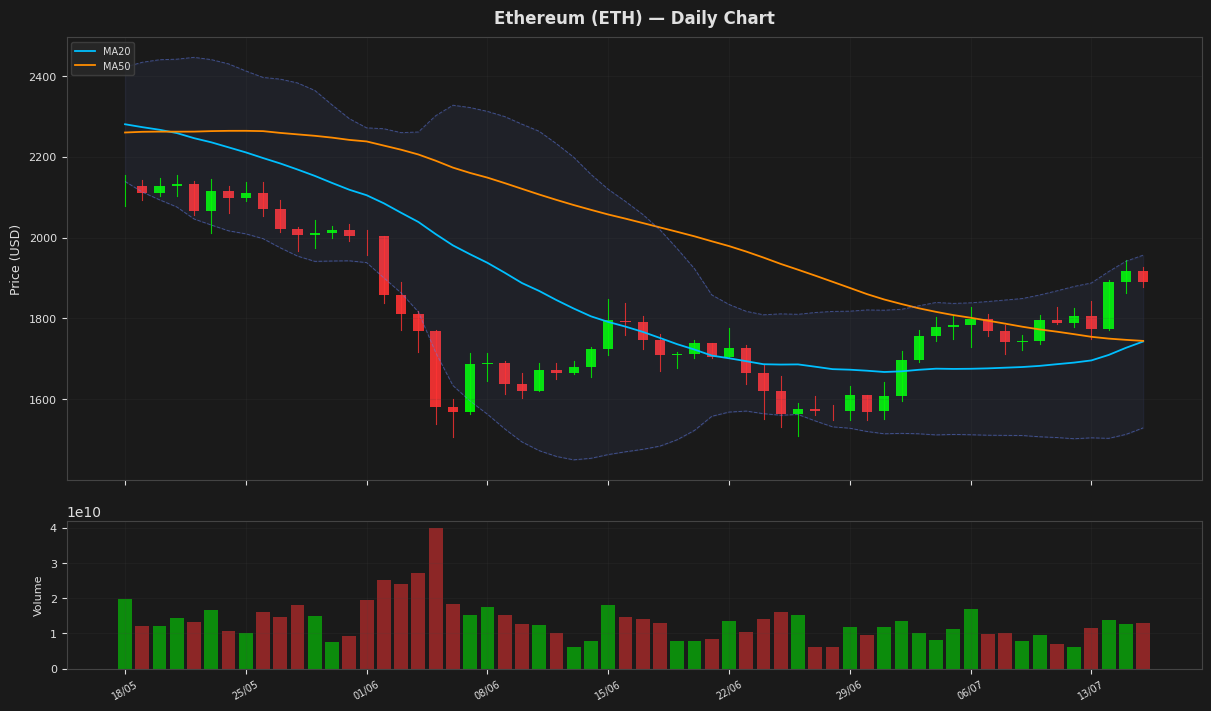
Ethereum is currently trading at $1,890.03, near the upper band of the Bollinger Bands at $1,956.55, indicating a potentially overbought condition, which is also supported by the RSI reading of 72.04. The MACD is above its signal line, suggesting a bullish trend. The price is above both the MA20 and MA50, further indicating a positive short-term trend.
Ripple (XRP) — -0.69%
$1.1051 52W: $1.0098 — $2.5772
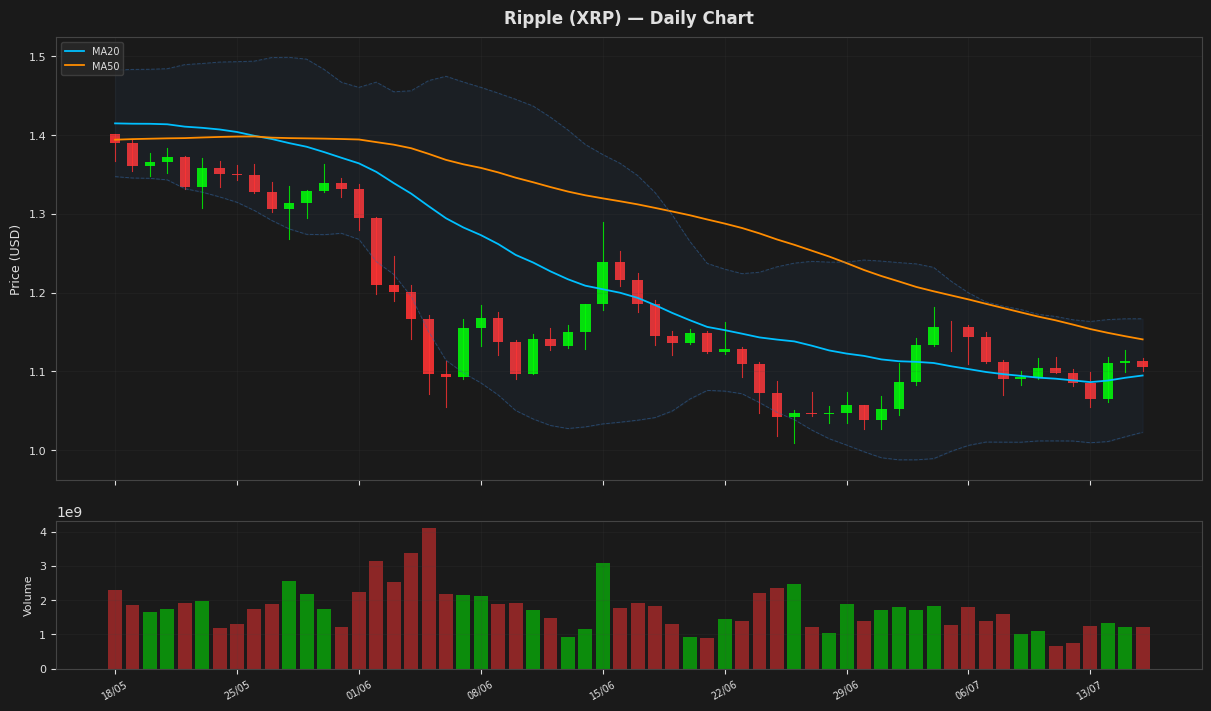
Ripple's price is currently at $1.105100, slightly above its 20-day moving average of 1.094778, indicating a neutral short-term trend. The RSI at 53.805254 suggests a balanced market with no extreme buying or selling pressure. The MACD is negative but above its signal line, indicating a potential for a slight bullish reversal. The price is also within the Bollinger Bands, suggesting a relatively stable volatility.
Solana (SOL) — -1.35%
$76.2200 52W: $60.4147 — $171.6073
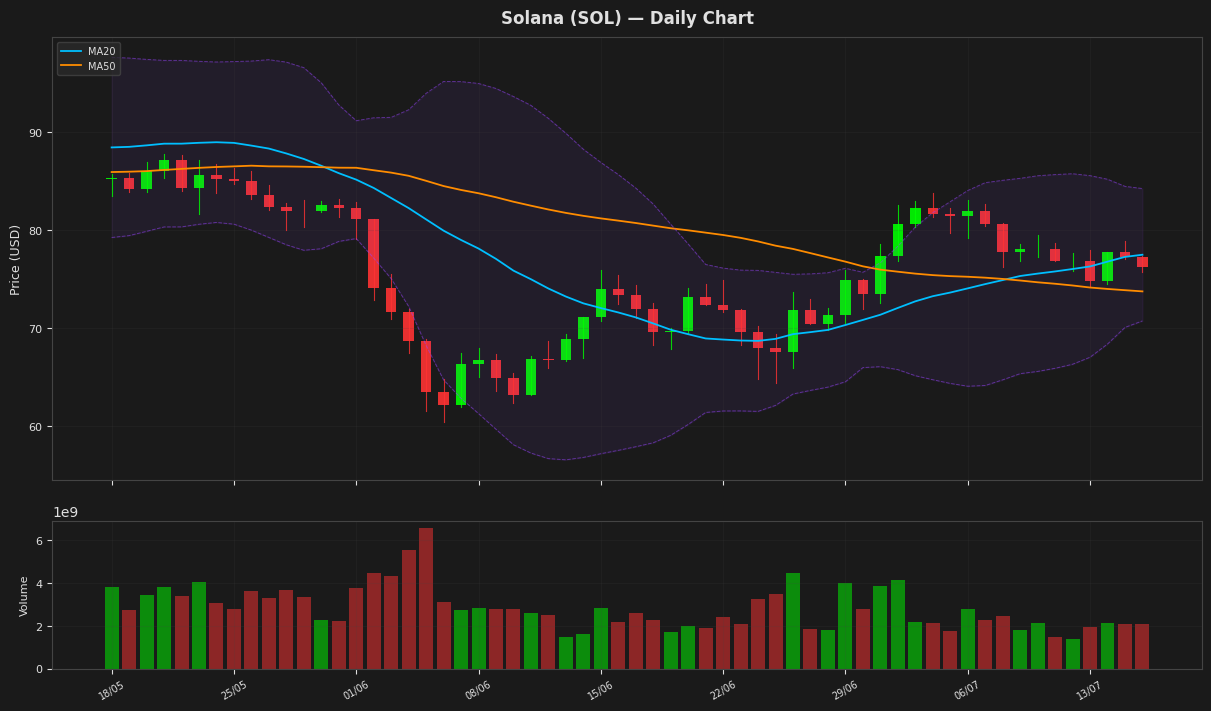
Solana's price is currently at $76.22, showing a slight decline of 1.35% and trading below its 20-day moving average of $77.49, indicating a potential bearish trend. The RSI is at 35.39, suggesting the asset is approaching oversold territory. The MACD is below its signal line, further indicating a bearish signal. The price is also near the lower end of its Bollinger Bands, with the lower band at $70.75.
BNB (BNB) — -0.63%
$576.4500 52W: $538.5992 — $1,017.68
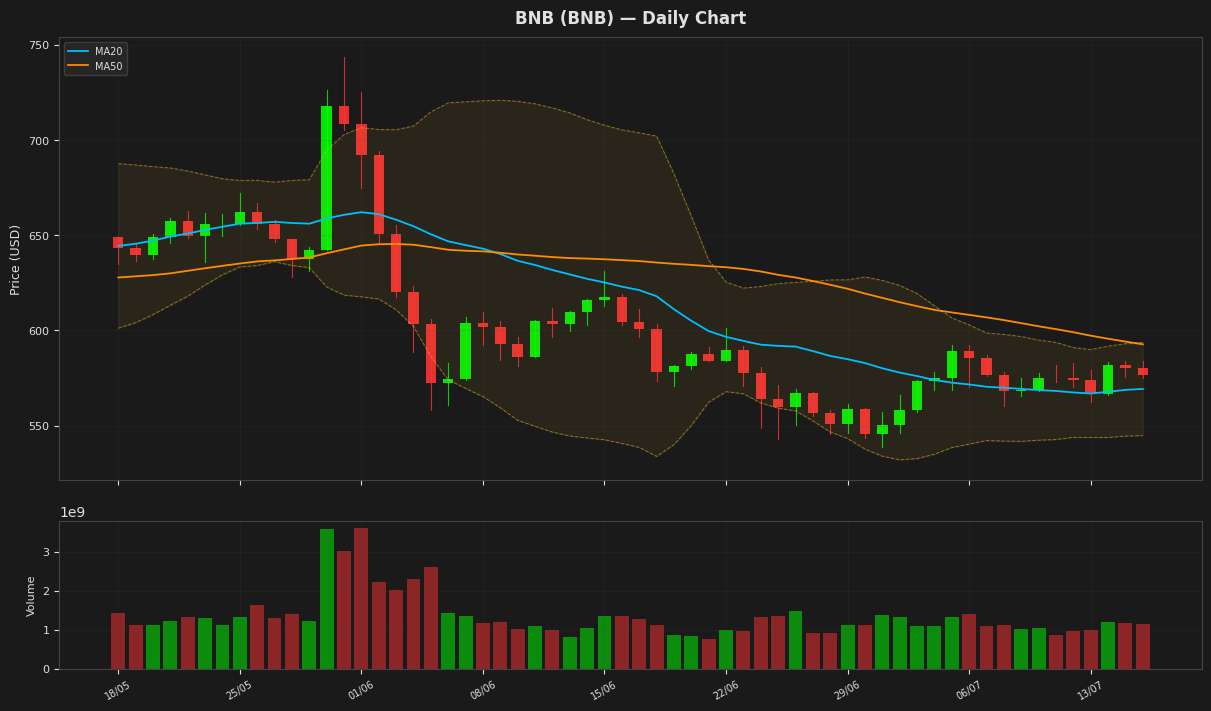
BNB is currently trading at $576.45, slightly above its 20-day moving average of $569.24, indicating a relatively stable short-term trend. The Relative Strength Index (RSI) at 60.58 suggests that the asset is nearing overbought territory but still has room to maneuver. The MACD line is below the signal line, indicating a potential bearish signal, while the price remains within the Bollinger Bands, suggesting that the volatility is relatively contained.
Tron (TRX) — -0.28%
$0.323415 52W: $0.268138 — $0.376332
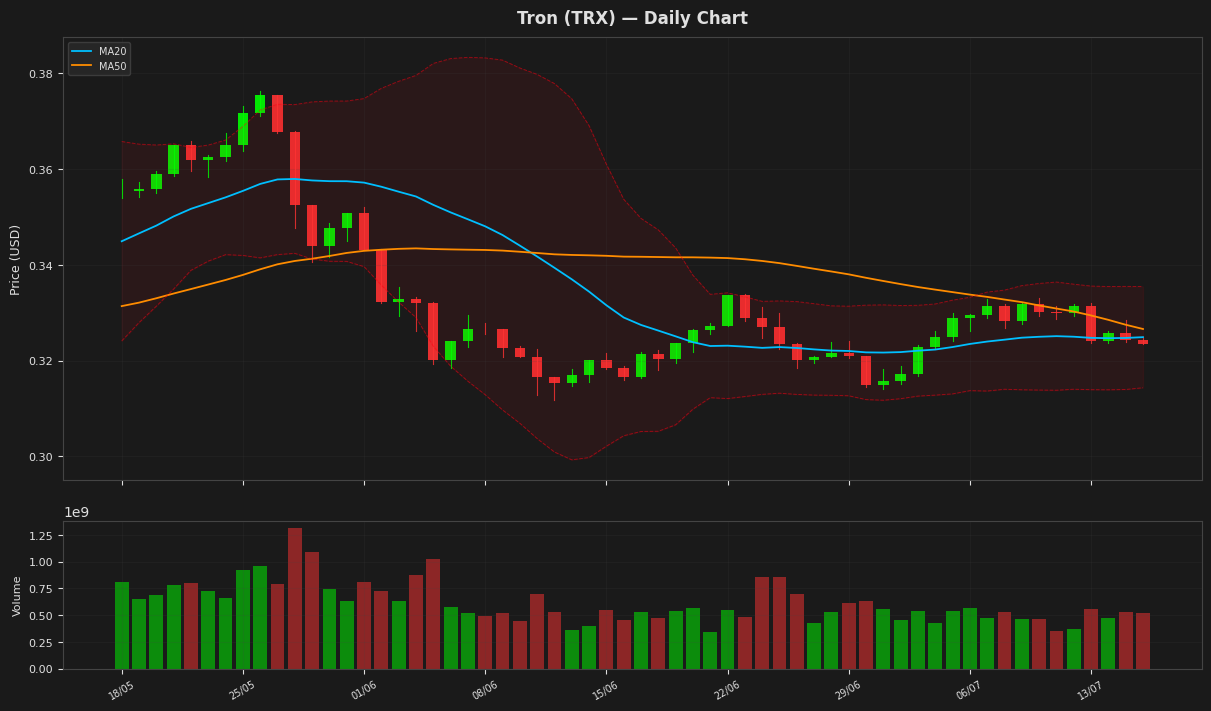
Tron's price is currently at $0.323415, showing a minor decline, and is positioned near the middle of the Bollinger Bands, indicating a lack of strong directional momentum. The RSI is at 58.658429, suggesting the asset is not overbought but is nearing the overbought territory. The MACD is negative but showing a slight convergence with its signal line, indicating a potential for a minor reversal. The ATR is relatively low at 0.004179, indicating low volatility.
Dogecoin (DOGE) — -1.41%
$0.073000 52W: $0.069611 — $0.185346
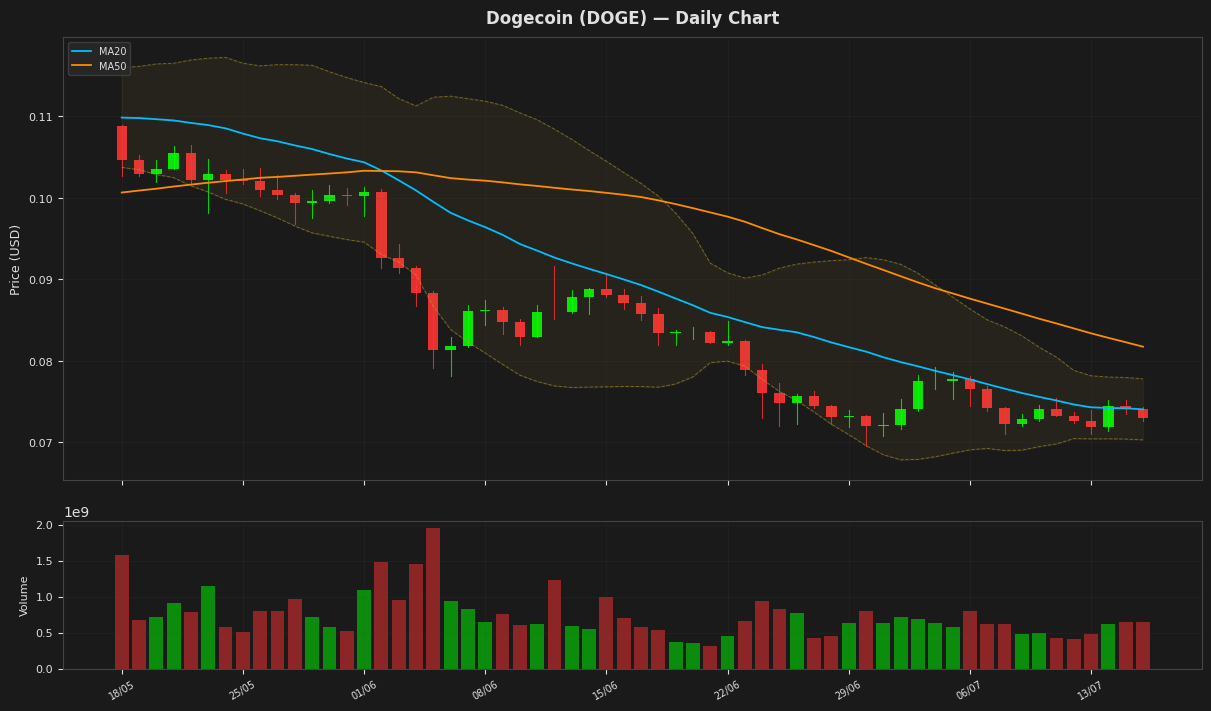
Dogecoin's price is currently at $0.073000, showing a decline of 1.41% for the day, and is positioned between the Bollinger Band upper and lower limits, indicating a consolidating trend. The RSI value of 46.83099 suggests a neutral stance, while the MACD line being below the signal line indicates a bearish signal. The price is also below both the MA20 and MA50, further reinforcing the bearish outlook.
Disclaimer
The content on MarketsFN.com is provided for educational and informational purposes only. It does not constitute financial advice or investment recommendations. All investments involve risk. Past performance does not guarantee future results.