Crypto Market Slumps: Dogecoin, Ripple, and Bitcoin Lead Losses Today
· Crypto · QuoteReporter
Crypto Market Slumps: Dogecoin, Ripple, and Bitcoin Lead Losses Today
Crypto Market Report | July 07, 2026
📊 Crypto Market Overview
The cryptocurrency market is currently experiencing a mixed sentiment, with most major assets trading in the red. Bitcoin, the largest cryptocurrency by market capitalization, has seen its value decrease by 1.52% over the past 24 hours, trading at $63,021.3398. The Relative Strength Index (RSI) for Bitcoin stands at 51.4, indicating a neutral stance, while the MACD is negative at -813.7863, suggesting a bearish trend.
Other major cryptocurrencies, such as Ethereum and Ripple, have also seen declines, with Ethereum dropping by 1.50% to $1,770.6899 and Ripple decreasing by 1.58% to $1.1257. Their RSI values are 61.6 and 53.2, respectively, indicating that they are not significantly overbought or oversold. Solana, on the other hand, has been relatively resilient, falling by only 0.60% to $81.4200, with an RSI of 74.2, which is nearing overbought territory.
The broader market context is influenced by various factors, including recent news and developments. A significant event was the sale of $216 million worth of Bitcoin by Strategy, which, according to Grayscale, may have contributed to establishing a durable bottom for Bitcoin. Additionally, discussions around the control of the US Bitcoin reserve and comments from political figures have been making headlines.
From a technical perspective, the MACD indicators for most major cryptocurrencies are either negative or showing signs of bearish divergence. Dogecoin, for instance, has a MACD of -0.0032 and an RSI of 38.7, indicating a potentially oversold condition. Overall, the current market sentiment appears cautious, with traders and investors closely monitoring key technical signals and reacting to significant news and events in the cryptocurrency space.
Other major cryptocurrencies, such as Ethereum and Ripple, have also seen declines, with Ethereum dropping by 1.50% to $1,770.6899 and Ripple decreasing by 1.58% to $1.1257. Their RSI values are 61.6 and 53.2, respectively, indicating that they are not significantly overbought or oversold. Solana, on the other hand, has been relatively resilient, falling by only 0.60% to $81.4200, with an RSI of 74.2, which is nearing overbought territory.
The broader market context is influenced by various factors, including recent news and developments. A significant event was the sale of $216 million worth of Bitcoin by Strategy, which, according to Grayscale, may have contributed to establishing a durable bottom for Bitcoin. Additionally, discussions around the control of the US Bitcoin reserve and comments from political figures have been making headlines.
From a technical perspective, the MACD indicators for most major cryptocurrencies are either negative or showing signs of bearish divergence. Dogecoin, for instance, has a MACD of -0.0032 and an RSI of 38.7, indicating a potentially oversold condition. Overall, the current market sentiment appears cautious, with traders and investors closely monitoring key technical signals and reacting to significant news and events in the cryptocurrency space.
📰 Crypto News
- Here’s what happened in crypto today
- Trader loses $2M in ‘same-block backrun extraction’ exploit
- Yield Guild Games cuts 35 staff, shuts game publisher to focus on AI
- Strategy’s Bitcoin sale may give BTC a ‘durable bottom,’ Grayscale says
- Trump says he became ‘a big crypto guy’ partly for politics
- L1s face decentralization 'tug-of-war' as adoption grows: Injective CEO
- US Bitcoin reserve hits snag as federal agencies debate for control: Bloomberg
- Bitcoin bulls shake off Strategy's $216M BTC sale as price overtakes $64K
- Strategy sells $216M Bitcoin, Bollinger bullish on BTC: Hodler's Digest, June 29-July 6, 2026
- Former Tether CIO seeks to sell stake in stablecoin issuer, Bloomberg reports
- Bitcoin recovers from Strategy's BTC sale, funding rates hit 9%: Are bulls back?
- BonkDAO reports $20M theft from ‘malicious governance proposal’
- Binance taps into Bitcoin holders’ hunger for yield with new covered call yield play
- Bitcoin's recent macro relief faces a challenge from Japanese interest rates
- Live markets: Bitcoin and ether ETFs drew inflows on Monday
🔍 Technical Analysis
Bitcoin (BTC) — -1.52%
$63,021.34 52W: $57,747.77 — $113,642.73
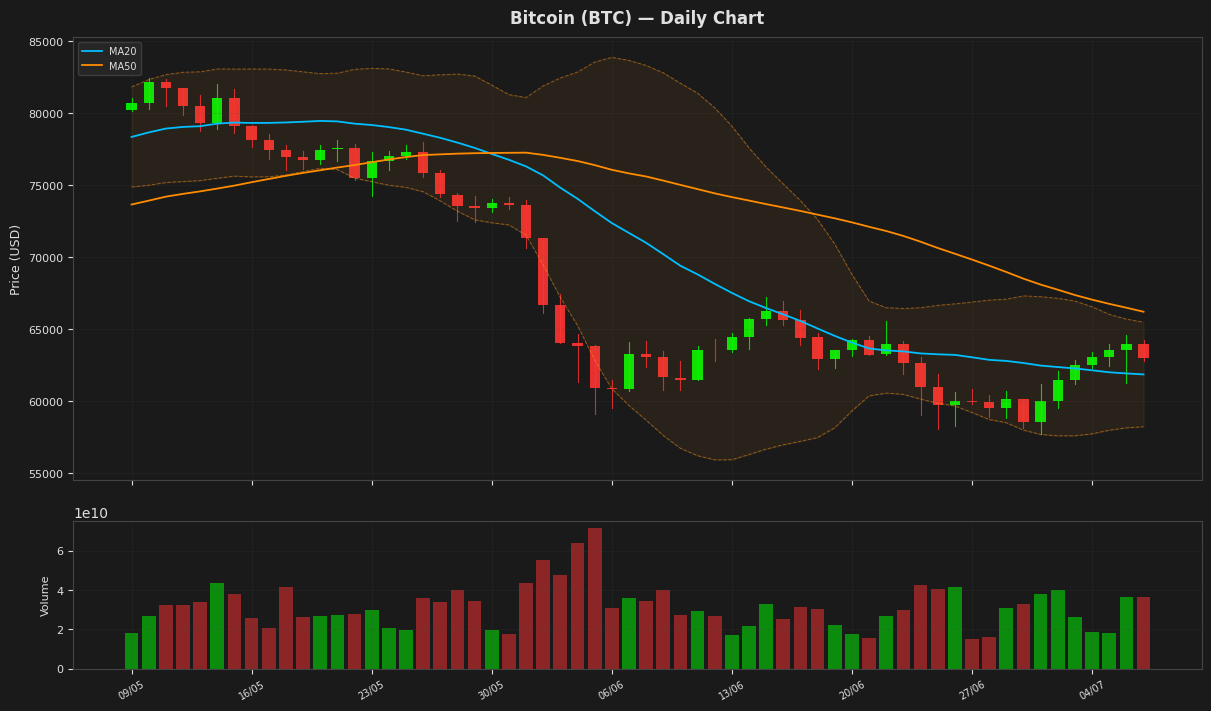
Bitcoin is currently trading at $63,021, showing a slight decline of 1.52% for the day. The RSI reading of 51.43 indicates a neutral market sentiment, while the MACD line is below the signal line, suggesting a potential bearish trend. The price is above the lower Bollinger Band at $58,229, but below the upper band at $65,483, indicating moderate volatility. The ATR of 2278 suggests significant price swings.
Ethereum (ETH) — -1.50%
$1,770.69 52W: $1,506.51 — $4,036.35
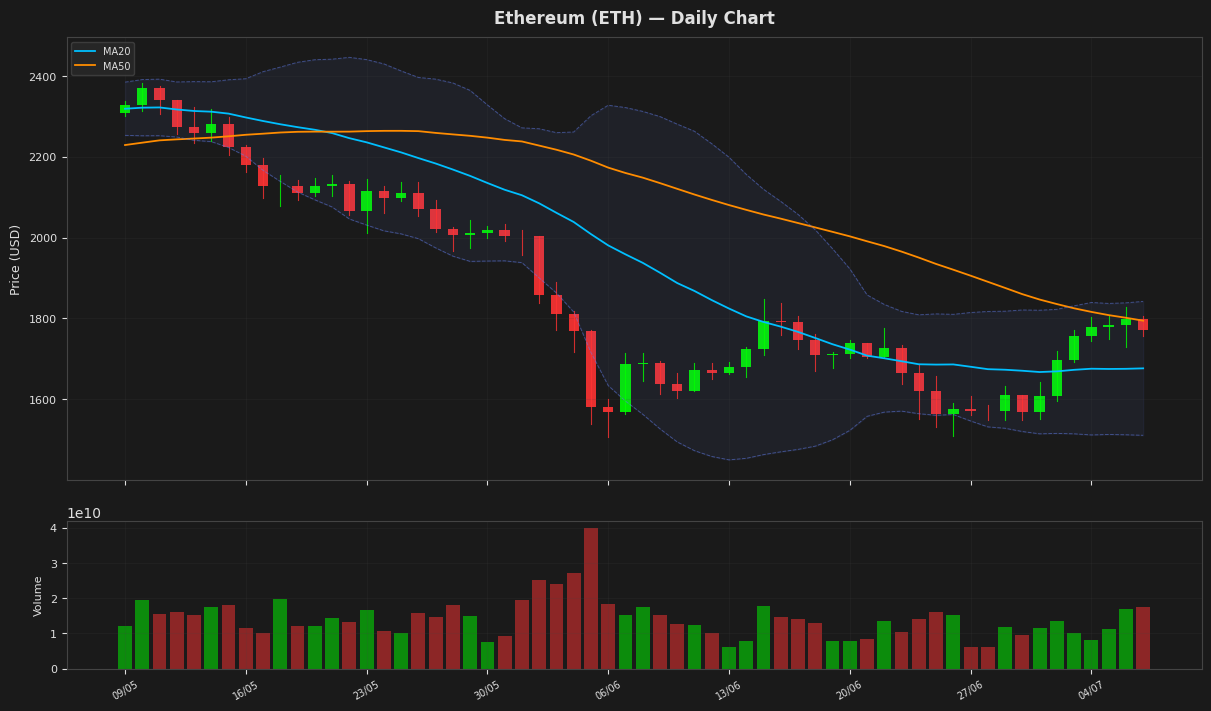
Ethereum is currently trading at $1,770.69, slightly below its 50-day moving average of $1,794.60, indicating a potential resistance level. The Relative Strength Index (RSI) at 61.59 suggests that the asset is nearing overbought territory, while the MACD line is above its signal line, indicating a potential bullish signal. The price is also within the upper and lower Bollinger Bands, with the upper band at $1,842.23 and lower band at $1,511.10.
Ripple (XRP) — -1.58%
$1.1257 52W: $1.0098 — $2.6630
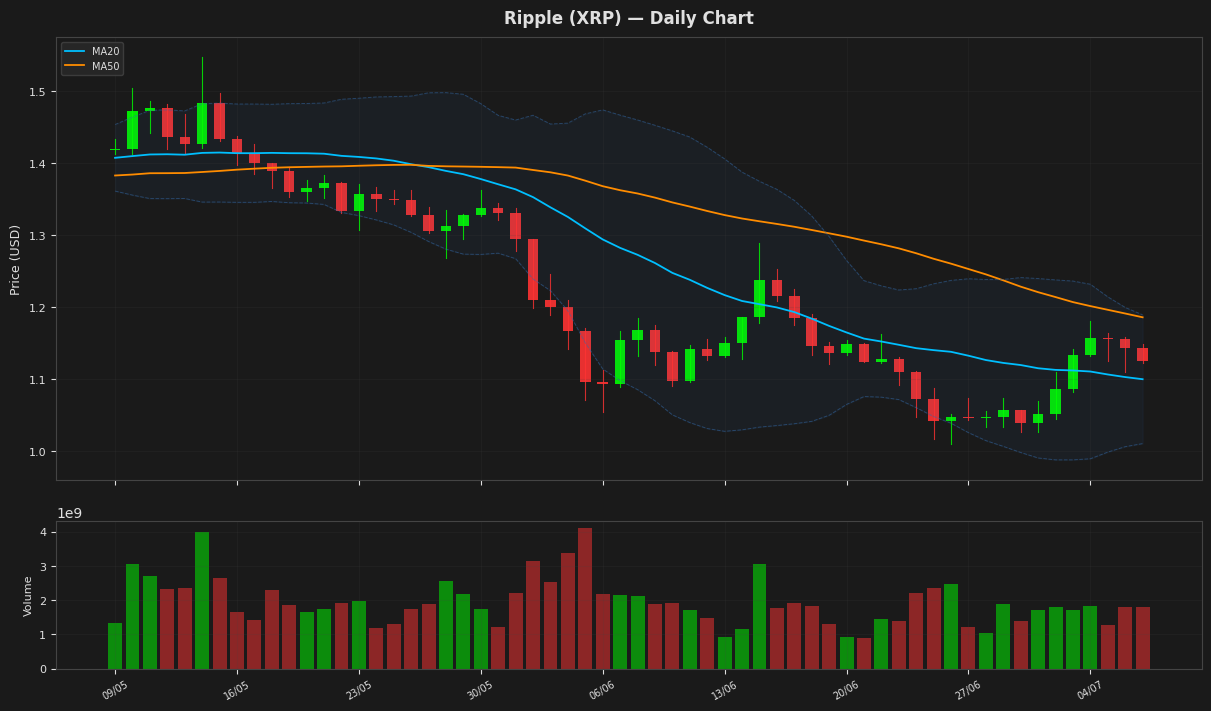
Ripple's price is currently trading near the middle of the Bollinger Bands, indicating a lack of clear direction, with the RSI at 53.218514 suggesting a neutral market sentiment. The MACD is above its signal line, indicating a potential bullish crossover. The price is also above the MA20, showing some short-term strength. The ATR indicates moderate volatility.
Solana (SOL) — -0.60%
$81.4200 52W: $60.4147 — $201.6774
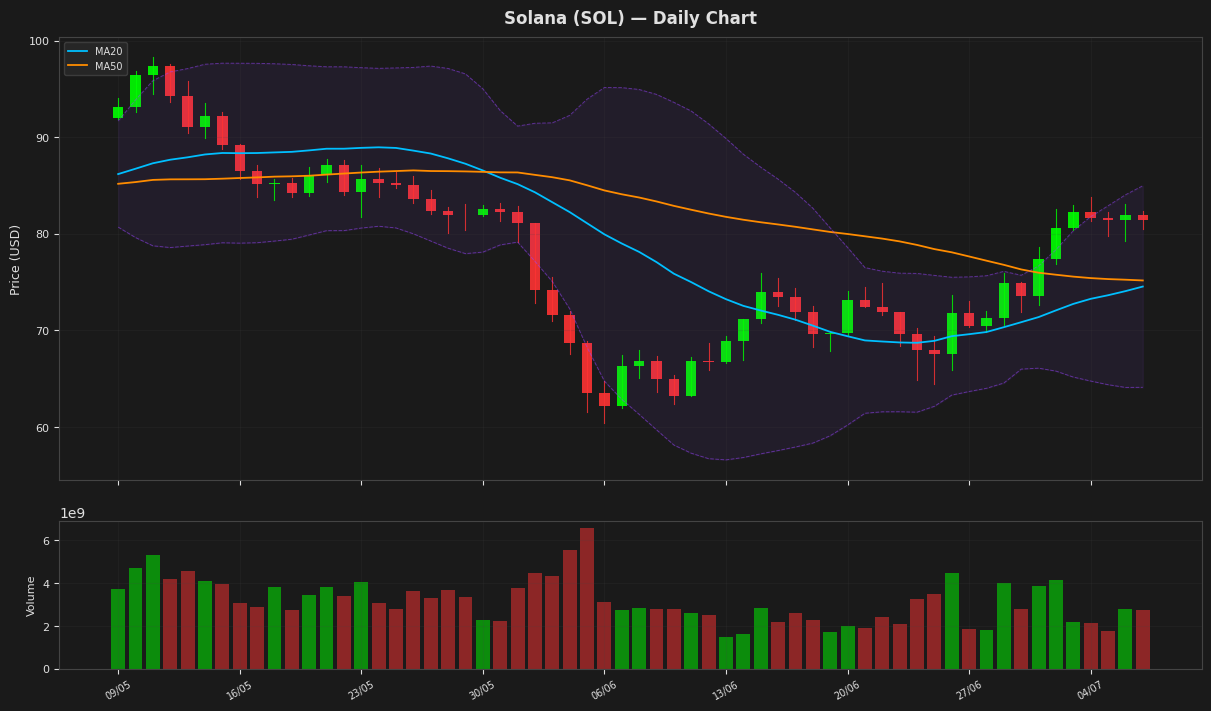
Solana's price is currently at $81.42, showing a minor decline of 0.60% and trading near the upper Bollinger Band at $84.97, indicating potential resistance. The RSI is at 74.21, suggesting the asset is nearing overbought territory. The MACD is above its signal line, indicating a bullish signal, while the ATR suggests moderate volatility.
BNB (BNB) — -1.41%
$577.1700 52W: $538.5992 — $1,123.70
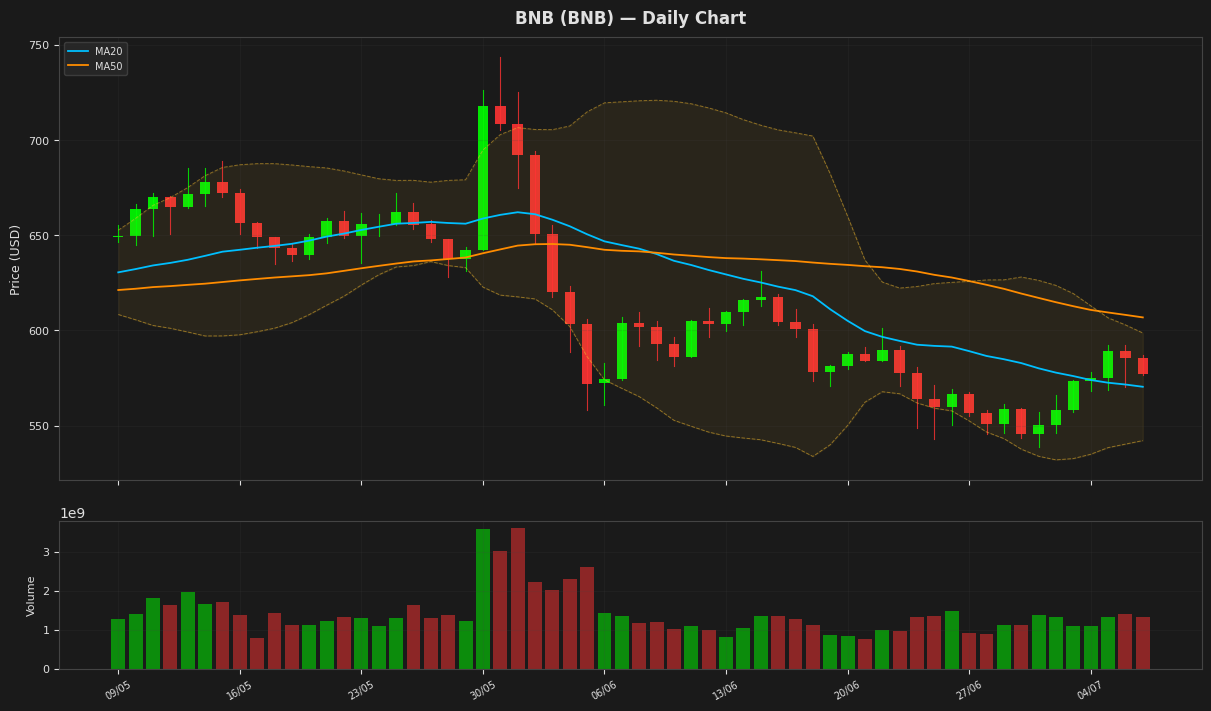
BNB is currently trading at $577.17, slightly below its MA50, indicating a potential bearish trend. The RSI is near neutral at 49.82, while the MACD is below its signal line, suggesting a bearish momentum. The price is within the Bollinger Bands, with the upper band at $598.66 and lower band at $542.14, indicating moderate volatility. The ATR is at 18.25, showing relatively high price fluctuations.
Tron (TRX) — -0.05%
$0.329305 52W: $0.268138 — $0.376332
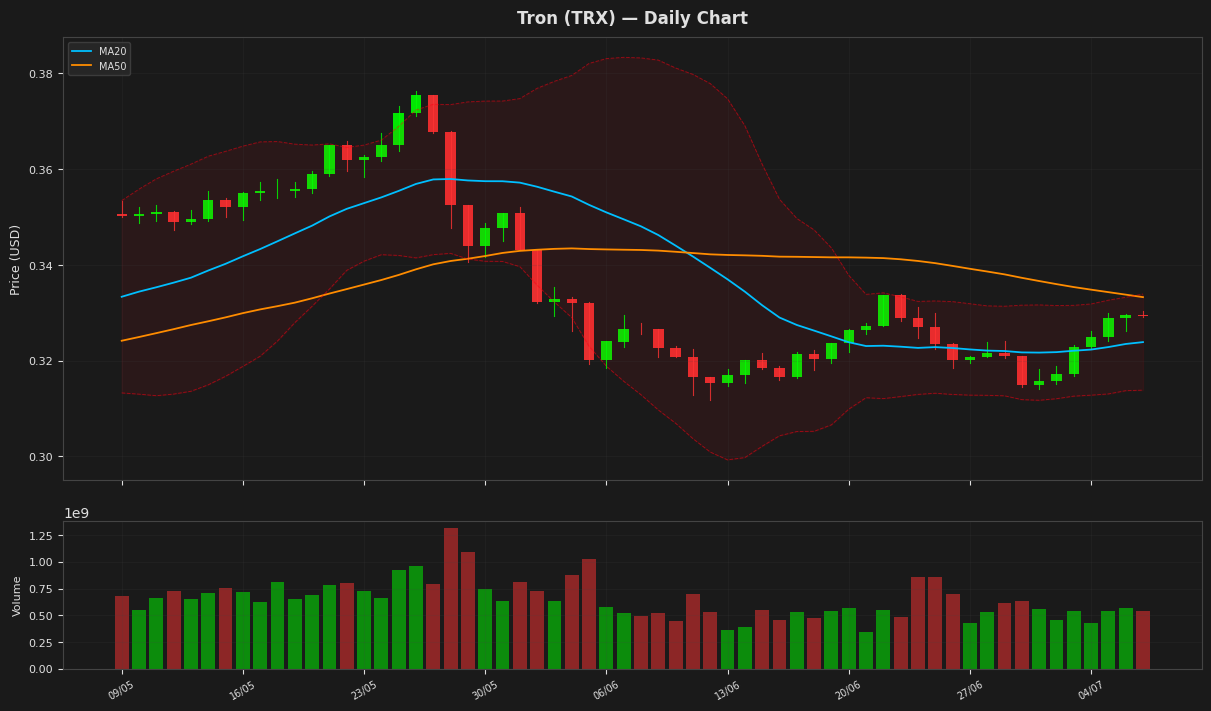
Tron's price is currently at $0.329305, slightly above its 20-day moving average of 0.323872, indicating a relatively stable trend. The RSI at 50.650405 suggests a neutral market sentiment, while the MACD being below its signal line indicates a potential bearish signal. The Bollinger Bands suggest that the price is near the upper band at 0.333908, indicating a potential resistance level.
Dogecoin (DOGE) — -2.26%
$0.074850 52W: $0.069611 — $0.197270
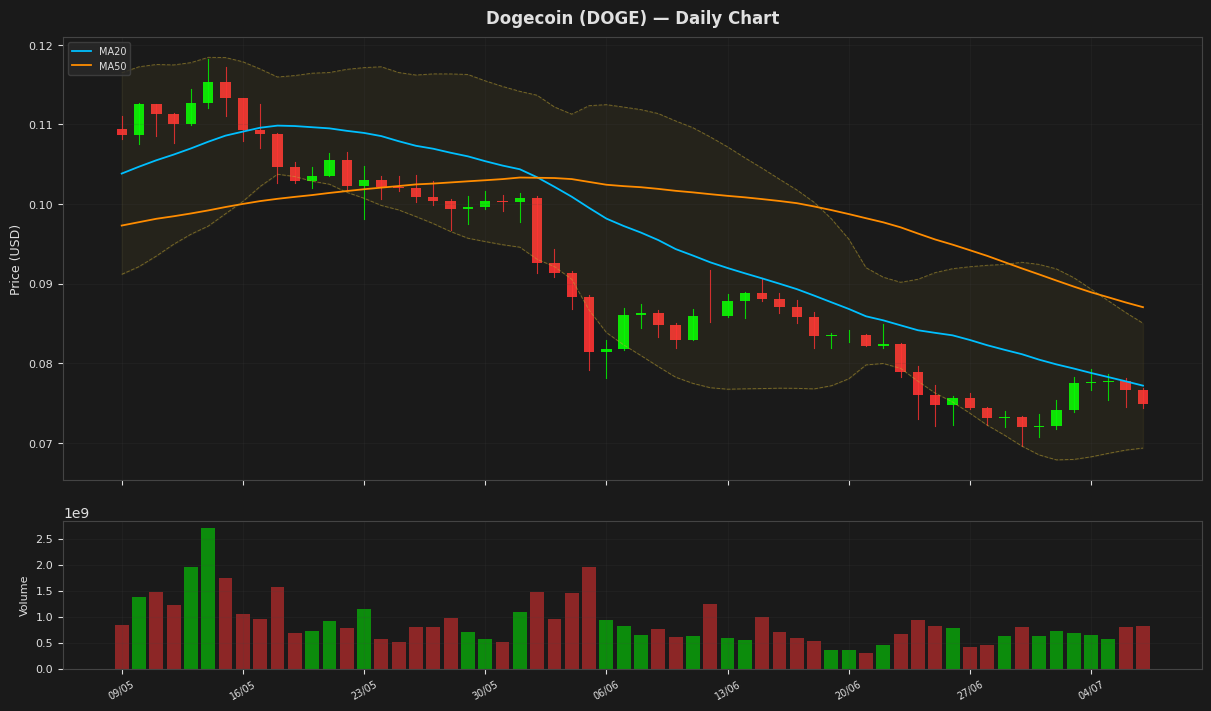
Dogecoin's price is currently at $0.074850, showing a decline of 2.26% for the day, and is positioned between the Bollinger Band upper and lower limits, indicating a consolidating trend. The RSI value of 38.67 suggests that the cryptocurrency is nearing oversold territory. The MACD line is above the signal line, indicating a potential buy signal, although the overall trend remains bearish given the price is below both the MA20 and MA50.
Disclaimer
The content on MarketsFN.com is provided for educational and informational purposes only. It does not constitute financial advice or investment recommendations. All investments involve risk. Past performance does not guarantee future results.