Crypto Market Slumps: Ethereum, Ripple, and Dogecoin Lead Losses Today
· Crypto · QuoteReporter
Crypto Market Slumps: Ethereum, Ripple, and Dogecoin Lead Losses Today
Crypto Market Report | June 08, 2026
📊 Crypto Market Overview
The cryptocurrency market is currently characterized by a mix of stability and volatility, with major assets exhibiting varied performance. Bitcoin, the largest cryptocurrency by market capitalization, is trading at $63,251.8398, showing a marginal increase of 0.02% over the day. The Relative Strength Index (RSI) for Bitcoin stands at 14.1, indicating oversold conditions, while the MACD is negative at -4022.6558, suggesting a bearish trend.
Other major cryptocurrencies are experiencing declines, with Ethereum down 1.46% to $1,661.8400, Solana decreasing by 0.82% to $65.7700, and BNB falling 0.85% to $598.5000. XRP has steadied above $1.10, bouncing from four-month lows, while Tron and Dogecoin are also trading lower.
Recent news has been mixed, with tokenization firm Securitize clearing a key hurdle for an NYSE listing, and CME introducing a new product allowing traders to bet on bitcoin volatility. Conversely, Arthur Hayes' sale of WLD and Justin Sun's HTX delisting of the Trump family's USD1 have contributed to market uncertainty.
The broader macro context is also influencing the cryptocurrency market, with tensions between Iran and Israel affecting global markets, including Korean stocks, which have crashed. Bitcoin's price spiked to $63,700, triggering significant short liquidations, before falling back below $63,000.
Notable technical signals include the oversold RSI readings for Bitcoin, Ethereum, and Solana, suggesting potential buying opportunities. However, the negative MACD values for these assets indicate a prevailing bearish sentiment. Overall, the cryptocurrency market remains sensitive to global economic and geopolitical developments, and traders are closely monitoring key technical indicators for signs of a potential shift in market direction.
📰 Crypto News
- Arthur Hayes dumps WLD days after Maelstrom’s AI IPO pitch
- Galaxy drops CLARITY Act odds to 60% as time is running out
- Tokenization firm Securitize clears key SEC hurdle for NYSE listing
- Justin Sun’s HTX delists Trump family’s USD1 amid freeze fight
- CME is letting traders bet on bitcoin volatility, not price, and two firms have already placed bets
- Zcash bounces 45% as developers propose new Ironwood upgrade
- XRP steadies above $1.10 to bounce from four-month lows
- Bitcoin pump to $63,700 triggers the most short liquidations since late April
- Bitcoin spikes, then dumps, from $63,700 as analysts assess Strategy's next BTC moves
- Bitcoin falls back below $63,000 as Iran-Israel trade strikes and Korean stocks crash
🔍 Technical Analysis
Bitcoin (BTC) — +0.02%
$63,251.84 52W: $59,108.92 — $126,198.07
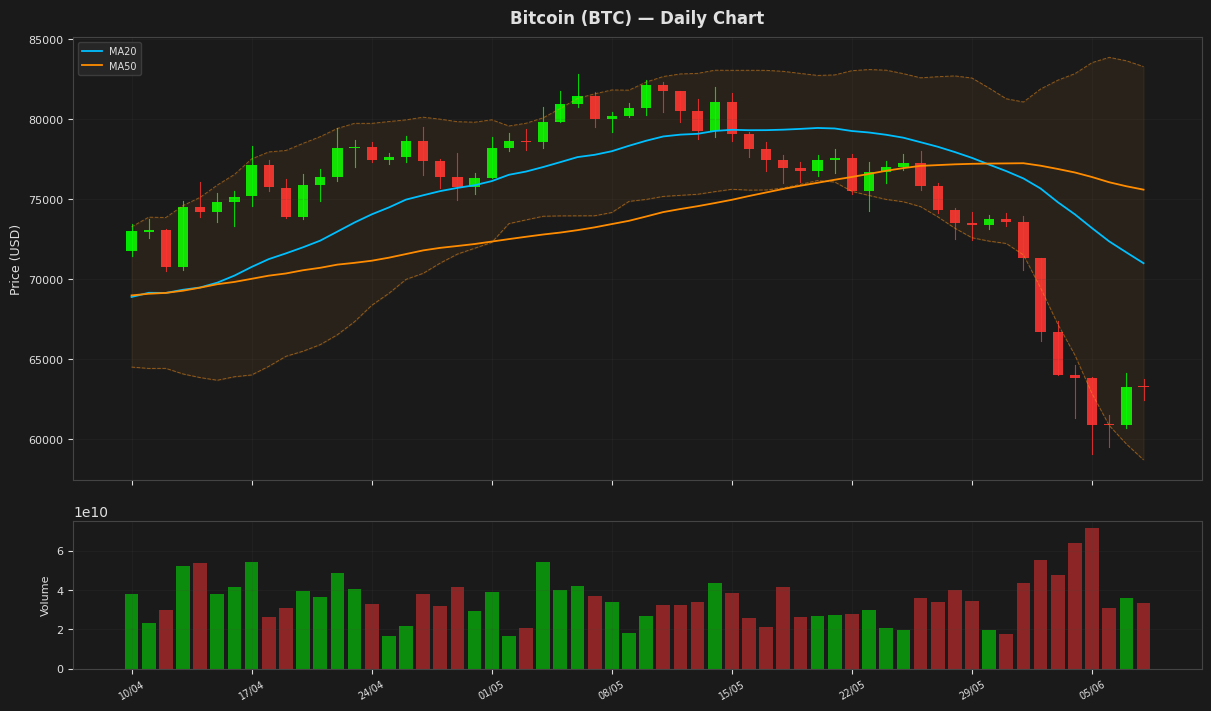
Bitcoin is currently trading at $63,251.84 with a minimal daily change, indicating a consolidation phase. The RSI(14) at 14.14 suggests that the asset is oversold, potentially setting up for a rebound. The MACD is below its signal line, indicating a bearish trend, while the price is near the lower end of the Bollinger Bands, at $63,251.84 being above the lower band of $58,716.41. The ATR(14) of $2,614.18 indicates high volatility.
Ethereum (ETH) — -1.46%
$1,661.84 52W: $1,506.51 — $4,755.22
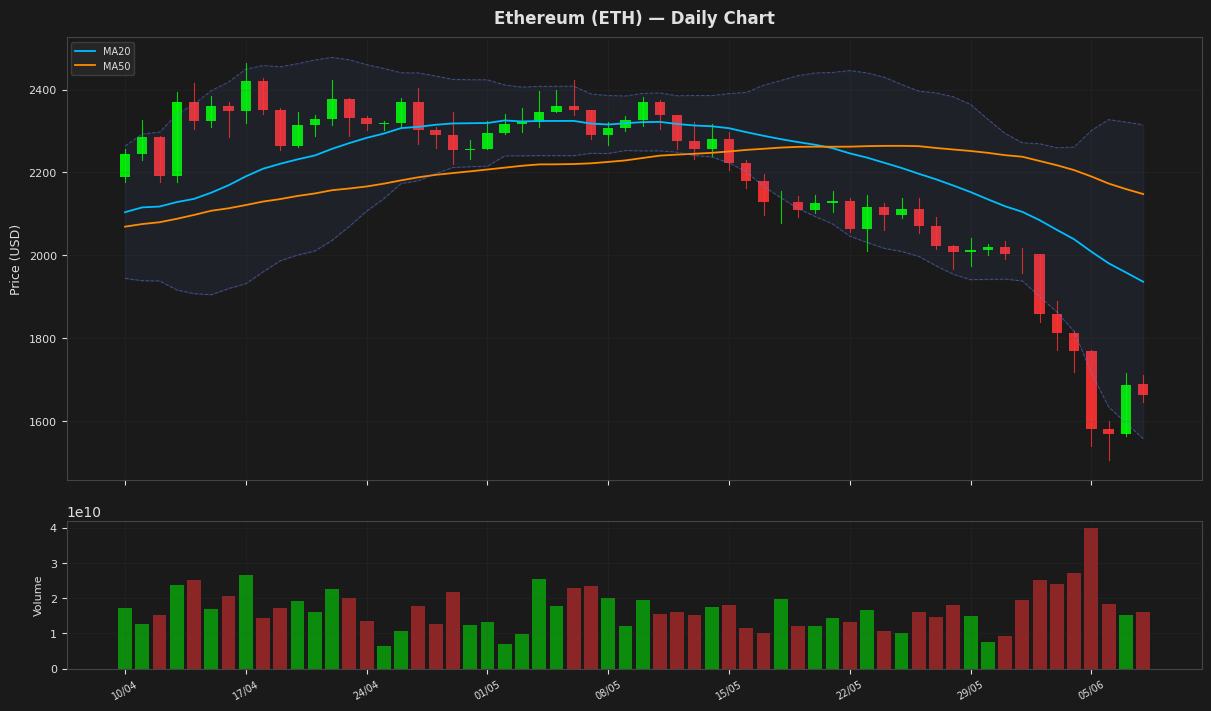
Ethereum's price is currently at $1,661.84, showing a daily decline of 1.46%, and is nearing the lower Bollinger Band at $1,557.61, indicating potential oversold conditions as the RSI(14) stands at 18.28. The MACD is below its signal line, suggesting bearish momentum. The price is also below both the MA20 and MA50, further indicating a downtrend. The ATR(14) suggests high volatility.
Ripple (XRP) — -1.04%
$1.1427 52W: $1.0547 — $3.0993
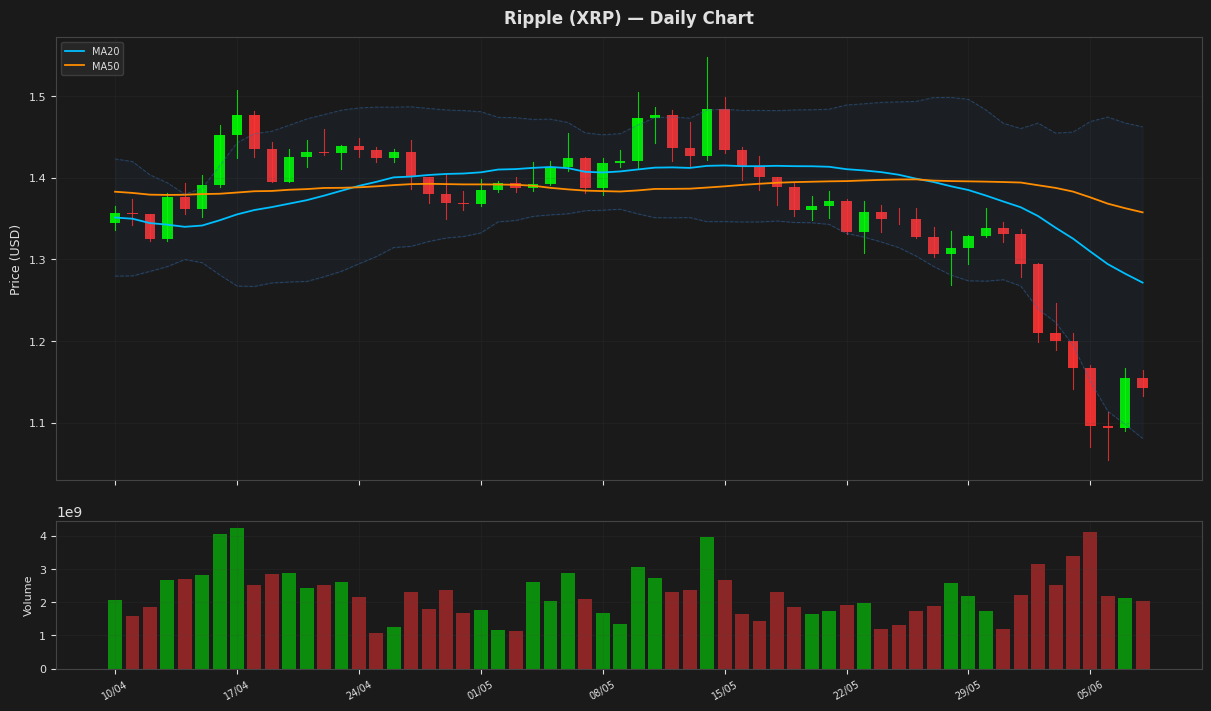
Ripple's price is currently at $1.142700, showing a slight decline, and is positioned near the lower Bollinger Band at 1.080869, indicating potential oversold conditions as supported by the RSI(14) value of 23.733933. The MACD is below its signal line, suggesting a bearish trend. The price is also below both the MA20 and MA50, further indicating a downward trend.
Solana (SOL) — -0.82%
$65.7700 52W: $60.4147 — $237.3225
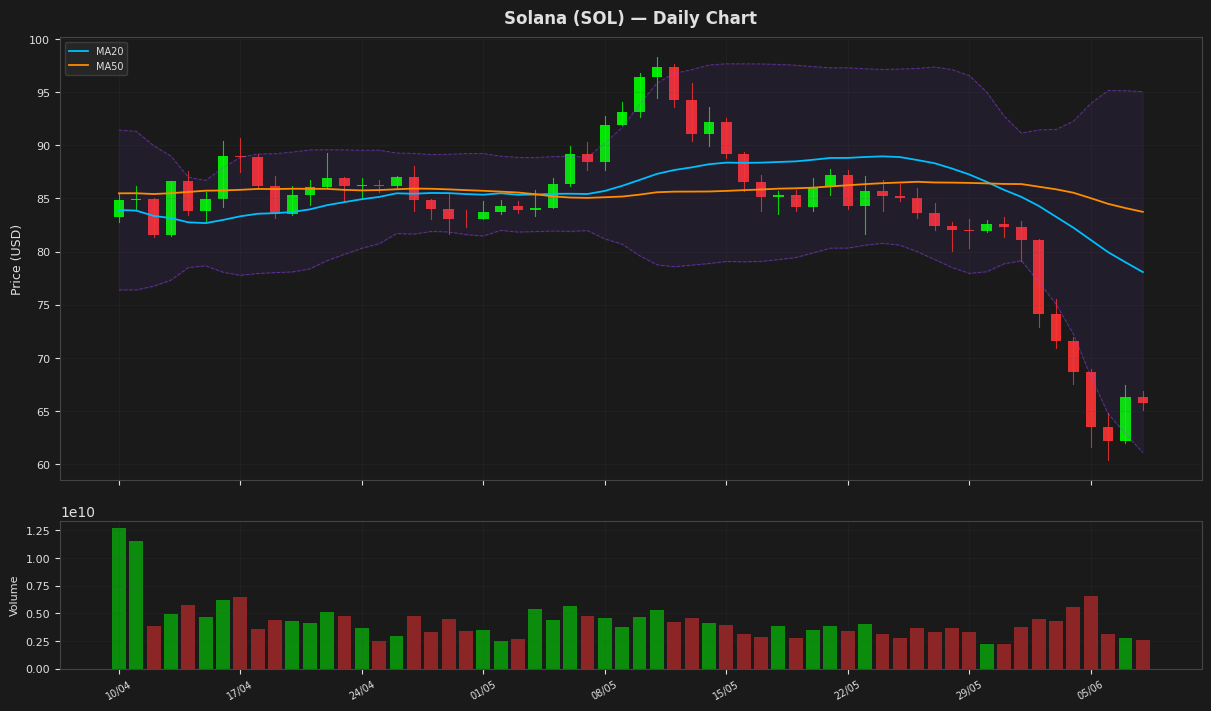
Solana's price is currently at $65.77, showing a minor decline of 0.82% for the day, and is positioned near the lower Bollinger Band at $61.11, indicating potential oversold conditions. The RSI is at 16.49, suggesting the asset is oversold, while the MACD is below its signal line, indicating a bearish trend. The price is also below both the MA20 and MA50, further reinforcing the bearish sentiment.
BNB (BNB) — -0.85%
$598.5000 52W: $558.3898 — $1,370.55
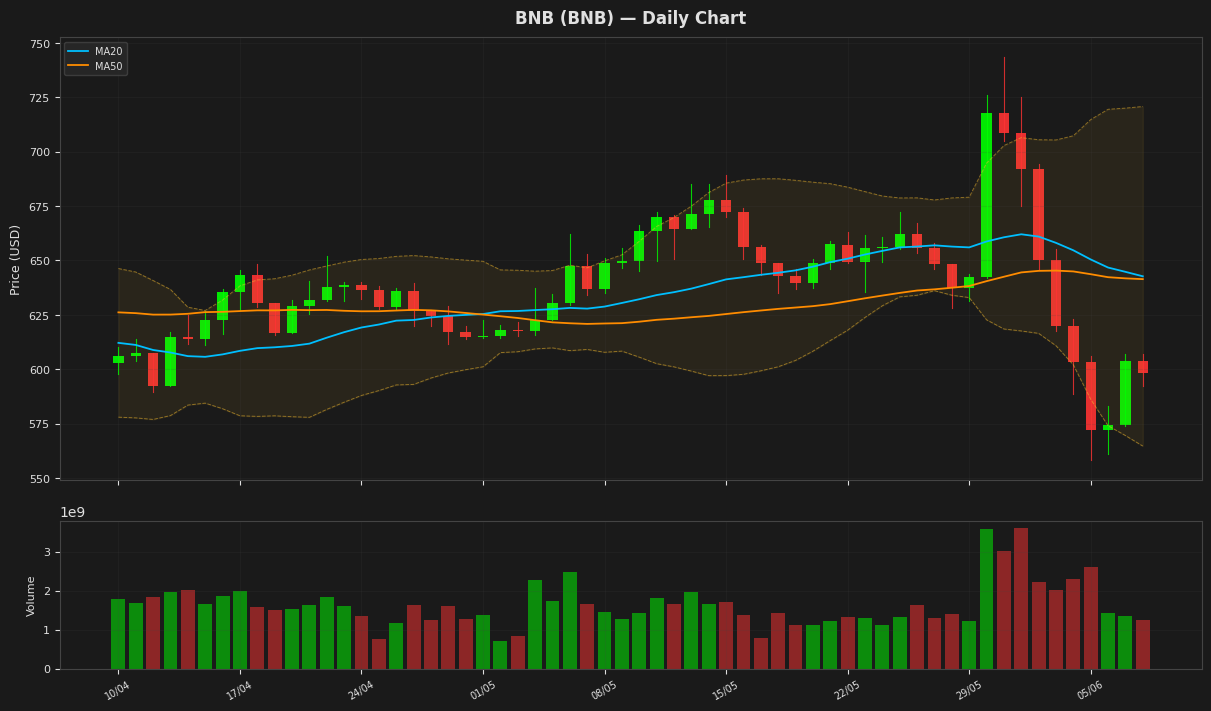
BNB is currently trading at $598.50, below its MA20 and MA50, indicating a bearish trend. The RSI is at 38.91, nearing oversold territory, while the MACD is below its signal line, suggesting further downward momentum. The price is near the lower Bollinger Band at $564.71, indicating potential support. The ATR suggests moderate volatility.
Tron (TRX) — -0.03%
$0.326468 52W: $0.268138 — $0.376332
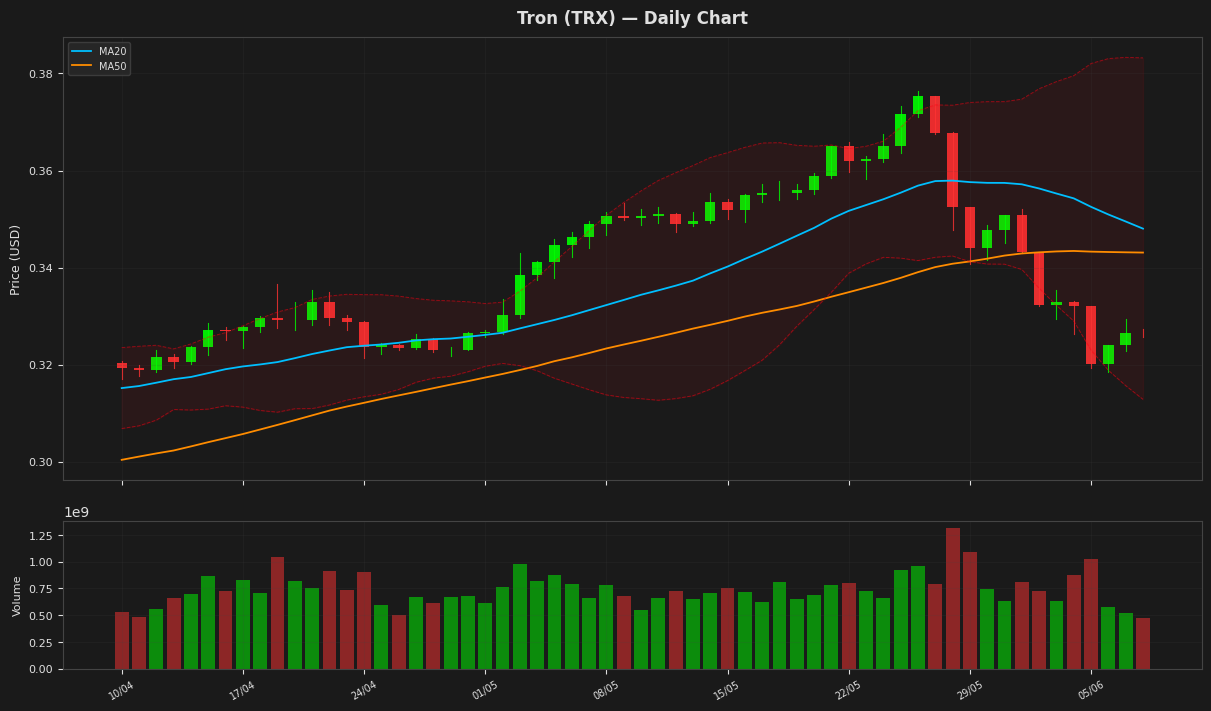
Tron's price is currently at $0.326468, showing a minimal daily change of -0.03%. The RSI(14) value of 21.979102 indicates that TRX is in oversold territory, potentially signaling a buying opportunity. The MACD is below the signal line, suggesting a bearish trend, while the price is near the lower Bollinger Band at $0.312861, indicating potential support. The ATR(14) suggests low volatility.
Dogecoin (DOGE) — -0.90%
$0.085310 52W: $0.078095 — $0.270047
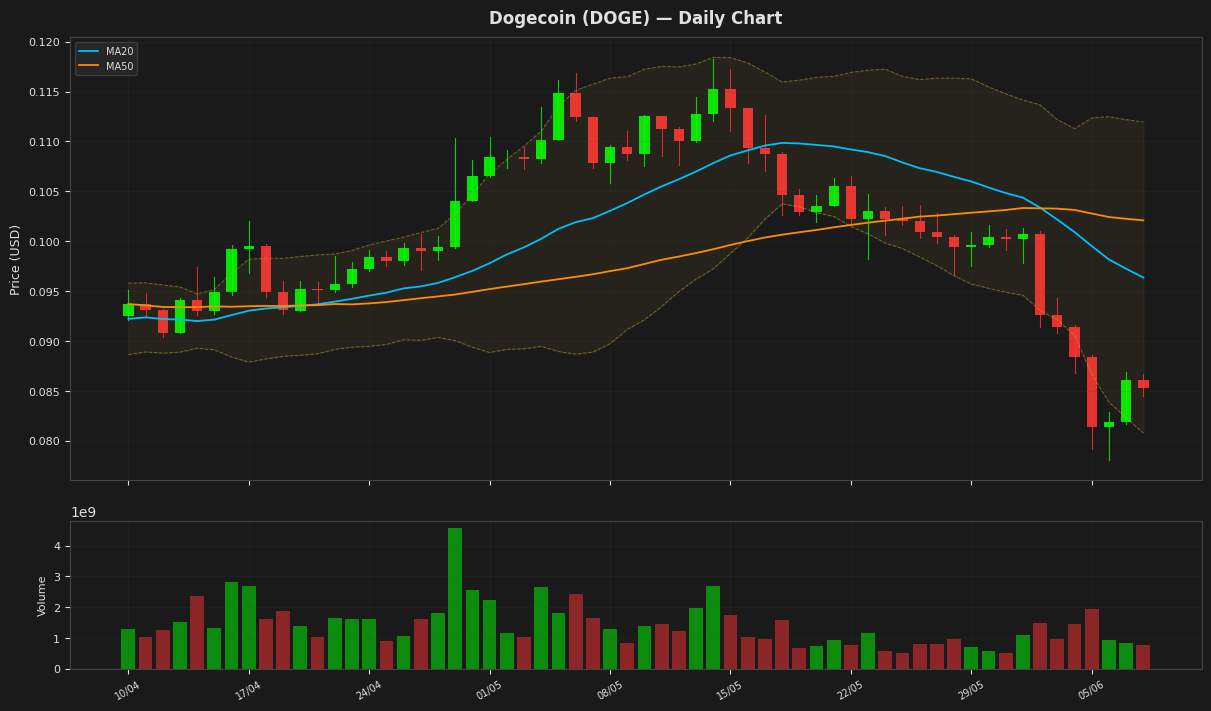
Dogecoin's price is currently at $0.085310, showing a daily decline of 0.90% and trading near the lower Bollinger Band at $0.080772, indicating potential oversold conditions. The RSI(14) value of 21.226691 further supports this, suggesting the cryptocurrency may be due for a rebound. The MACD is below the signal line, indicating a bearish trend, but the proximity to the 52-week low of $0.078095 may limit further downside.
Disclaimer
The content on MarketsFN.com is provided for educational and informational purposes only. It does not constitute financial advice or investment recommendations. All investments involve risk. Past performance does not guarantee future results.