Crypto Market Slumps: Ripple, Tron, and Solana Lead Daily Losses
· Crypto · QuoteReporter
Crypto Market Slumps: Ripple, Tron, and Solana Lead Daily Losses
Crypto Market Report | June 17, 2026
📊 Crypto Market Overview
The cryptocurrency market is currently characterized by a relatively stable sentiment, with most major assets experiencing minor fluctuations. Bitcoin, the largest cryptocurrency by market capitalization, is trading at $65,498.59, down 0.16% on the day, with its Relative Strength Index (RSI) at 55.7, indicating a neutral stance. The MACD indicator is negative at -2363.2977, suggesting a bearish trend.
Other major cryptocurrencies, such as Ethereum, Ripple, Solana, and Dogecoin, are also experiencing minor declines, ranging from 0.31% to 0.62%. BNB is a notable exception, posting a small gain of 0.26%. The RSI values for these assets are generally in the neutral to oversold territory, with Tron being an outlier at 30.2, indicating potential oversold conditions.
The macroeconomic context is influenced by recent news, including a Congressional deal on a housing bill that includes a ban on Central Bank Digital Currencies (CBDCs) until 2030. Additionally, the tokenized asset market has surpassed $43 billion as institutions increasingly adopt blockchain technology. Illinois has approved a crypto transaction tax despite industry opposition.
From a technical perspective, several assets are displaying interesting signals. Bitcoin's RSI is near the midpoint, while its MACD remains negative. Ethereum's RSI is below 50, and its MACD is also negative, indicating a potential bearish trend. Tron is oversold, with an RSI of 30.2, and a negative MACD. Overall, the market appears to be in a state of consolidation, with various assets exhibiting different technical signals. The recent news and developments are likely influencing market sentiment, but the overall trend remains uncertain.
📰 Crypto News
- Congress reaches deal on housing bill with CBDC ban until 2030
- Here’s what happened in crypto today
- Strategy’s STRC falls to $91 as investors flinch at latest BTC buying
- Illinois governor approves crypto transaction tax despite industry uproar
- Hyperliquid open interest surges 32% in week: Is $80 HYPE next?
- Senators urge Treasury to ensure state authority in GENIUS application
- Bitcoin tops $67K following US-Iran peace deal: Is it a bull trap?
- Tokenized asset market tops $43B as institutions accelerate blockchain adoption
- Bitcoin metric near ‘low-risk’ zone after holders absorb 125K BTC in June: Time for a rebound?
- Crypto PAC has $12M stake in Senate primary runoff as Alabama voters head to polls
- Coinbase lets users transfer stock portfolios as exchange expands beyond crypto
- BitGo offers Europe’s crypto firms a MiCA-compliance lifeline as license deadline looms
- Forget the price charts. Here's how bitcoin and S&P 500 look like when adjusted for the money printer
- Crypto PAC's $12 million Senate candidate, Barry Moore, wins Alabama GOP primary
- Live markets: A bitcoin bottom signal flashed as holders absorbed 125,000 BTC in June
🔍 Technical Analysis
Bitcoin (BTC) — -0.16%
$65,498.59 52W: $59,108.92 — $123,739.34
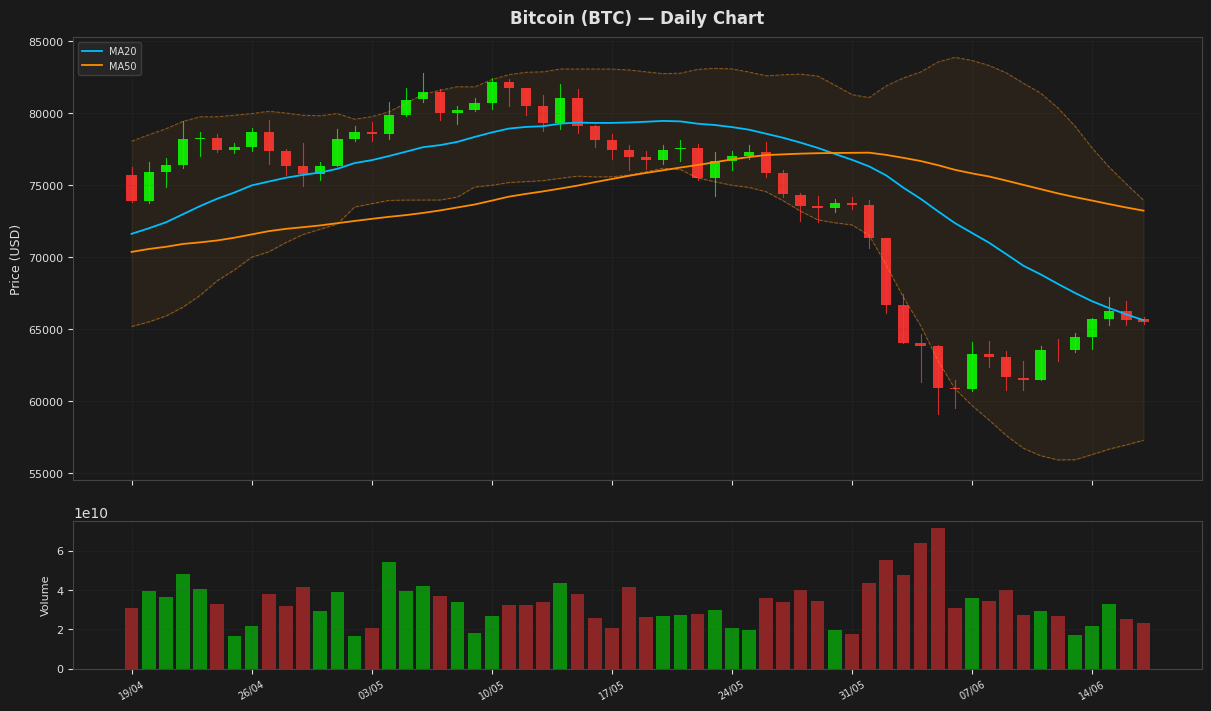
Bitcoin is currently trading at $65,498.59, near its 20-day moving average of $65,619.22, indicating a lack of strong directional momentum as the RSI is at a neutral level of 55.72. The price is also within the Bollinger Bands, with the upper band at $73,948.78 and lower band at $57,289.66, suggesting that it is in a consolidation phase. The MACD is negative but showing a potential bullish crossover as it is above its signal line.
Ethereum (ETH) — -0.31%
$1,784.76 52W: $1,506.51 — $4,531.72
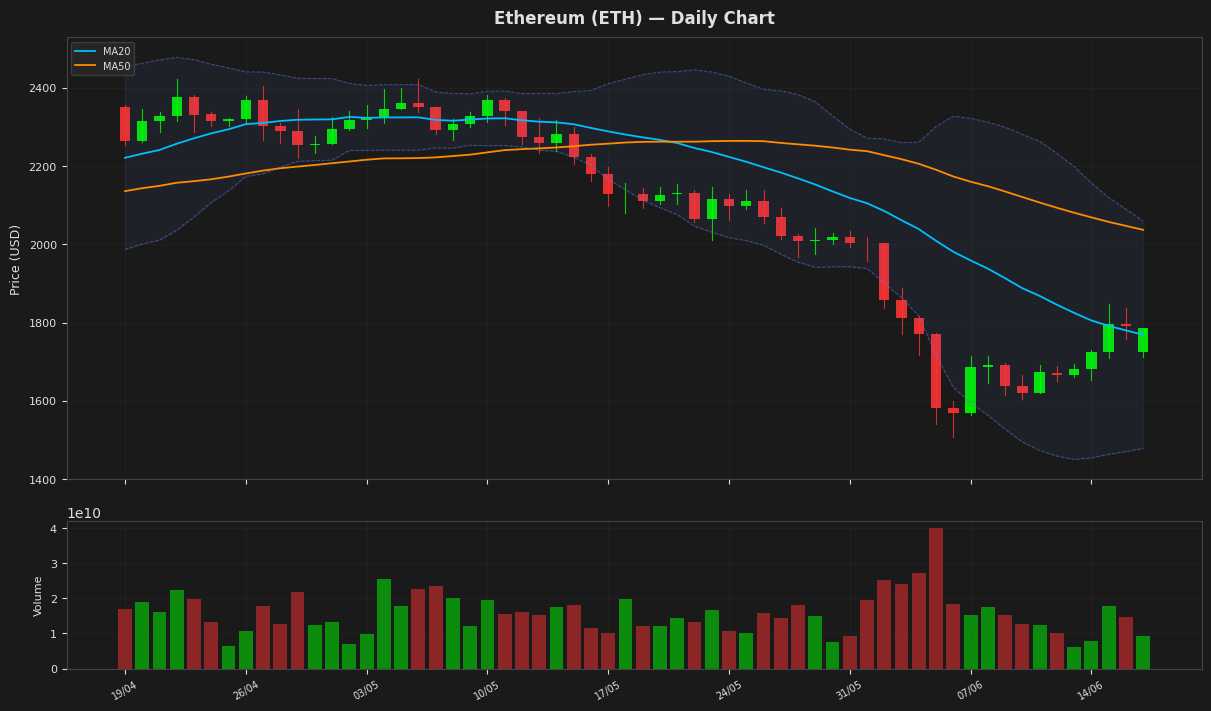
Ethereum's price is currently at $1,784.76, slightly above its 20-day moving average of $1,768.72, indicating a neutral short-term trend. The Relative Strength Index (RSI) at 47.87 suggests a balanced market with no extreme buying or selling pressure. The Moving Average Convergence Divergence (MACD) is below its signal line, indicating a potential bearish signal.
Ripple (XRP) — -0.62%
$1.2084 52W: $1.0547 — $2.8808
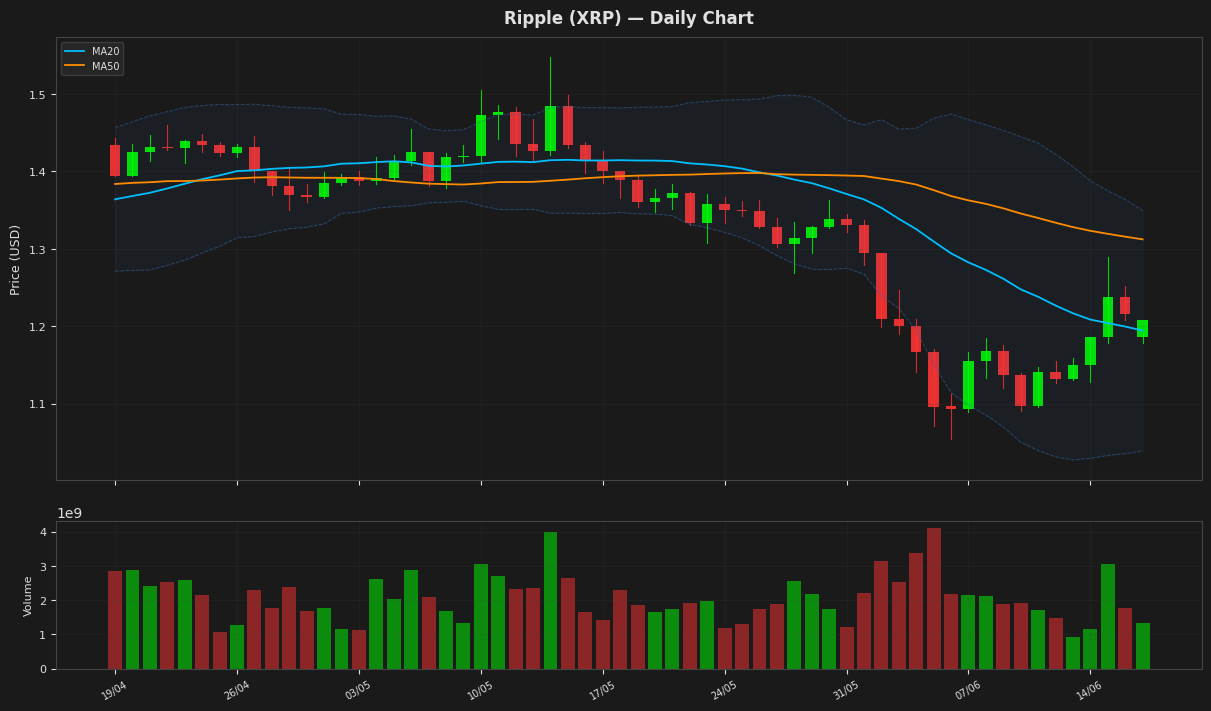
Ripple's price is currently at $1.208400, slightly above its 20-day moving average of 1.19445, indicating a neutral short-term trend. The RSI is at 50.921155, suggesting a balanced market with no clear dominance of buyers or sellers. The MACD is negative and below its signal line, indicating a potential bearish signal. The price is also below the 50-day moving average of 1.312331, further supporting a bearish outlook.
Solana (SOL) — -0.36%
$73.1500 52W: $60.4147 — $229.3158
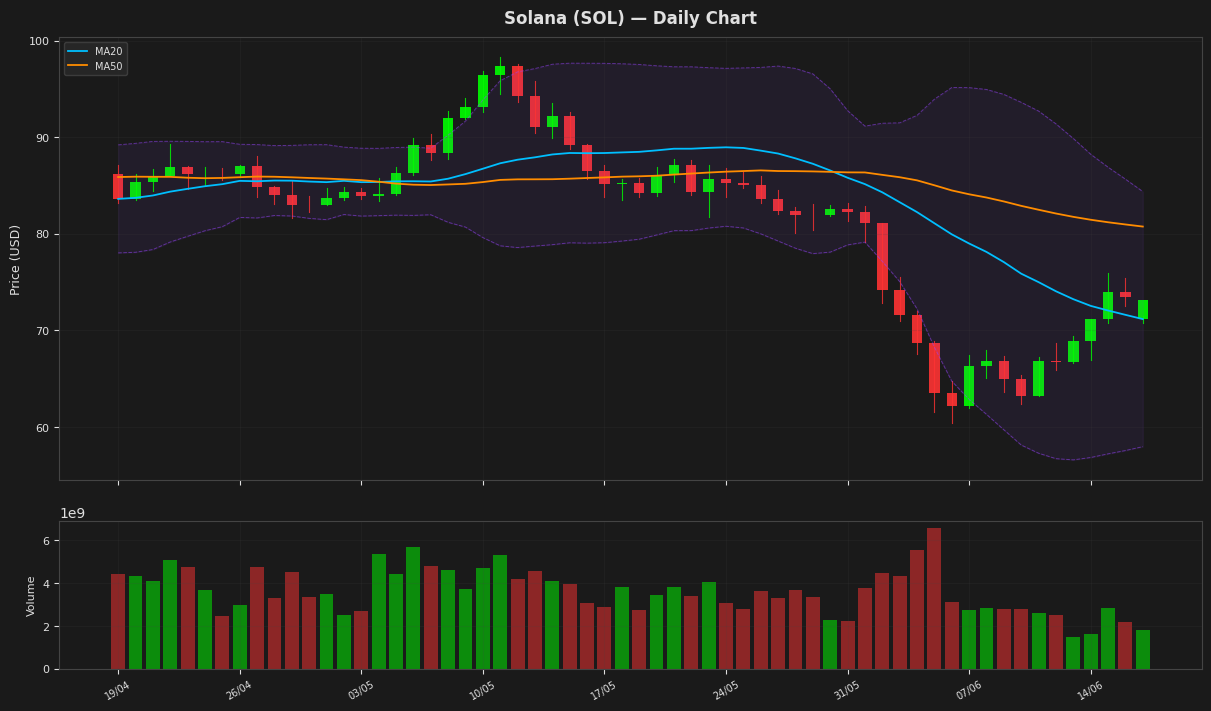
Solana's price is currently at $73.15, slightly above its 20-day moving average of $71.17, indicating a potential support level. The RSI is near neutral at 52.61, suggesting a lack of strong momentum in either direction. The MACD is below its signal line, indicating a bearish signal, while the price remains above the 52-week low of $60.41.
BNB (BNB) — +0.26%
$605.9000 52W: $558.3898 — $1,370.55
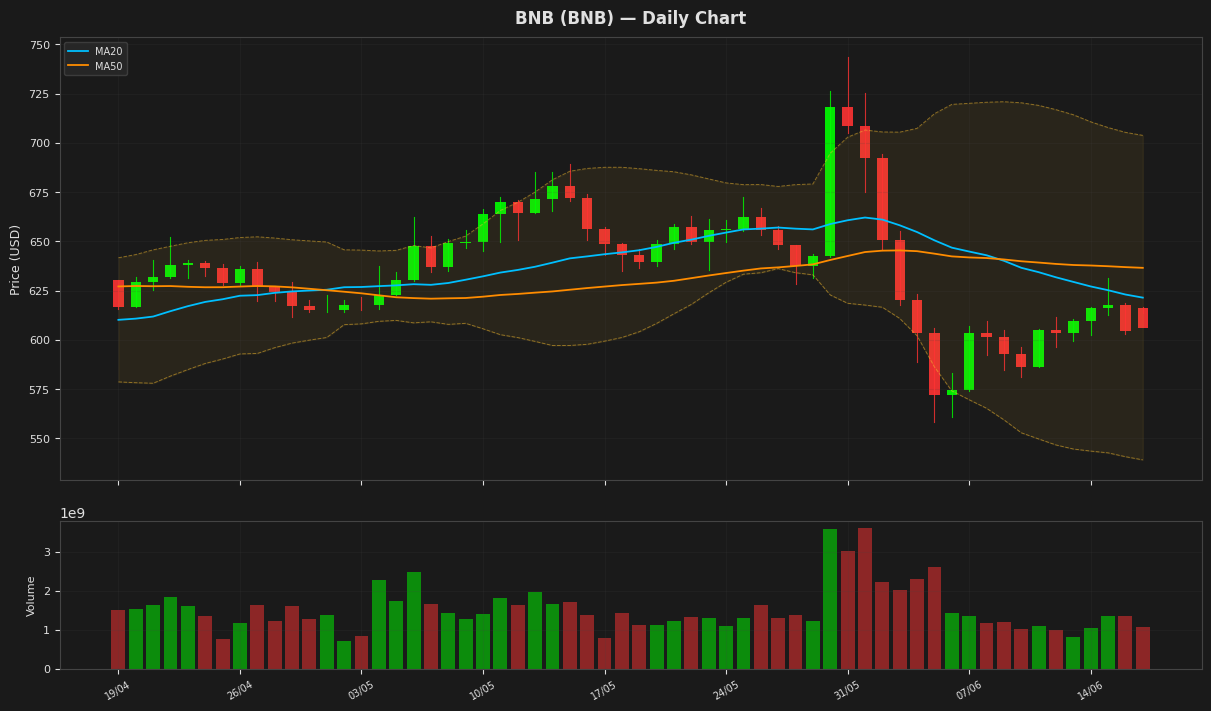
BNB is currently trading at $605.9, slightly above its 52-week low, with a neutral RSI reading of 45.13 indicating a lack of strong momentum. The price is below both the MA20 and MA50, suggesting a bearish trend, and is positioned near the lower end of the Bollinger Bands. The MACD is below its signal line, further indicating bearish sentiment. The ATR suggests moderate volatility.
Tron (TRX) — -0.58%
$0.316611 52W: $0.268138 — $0.376332
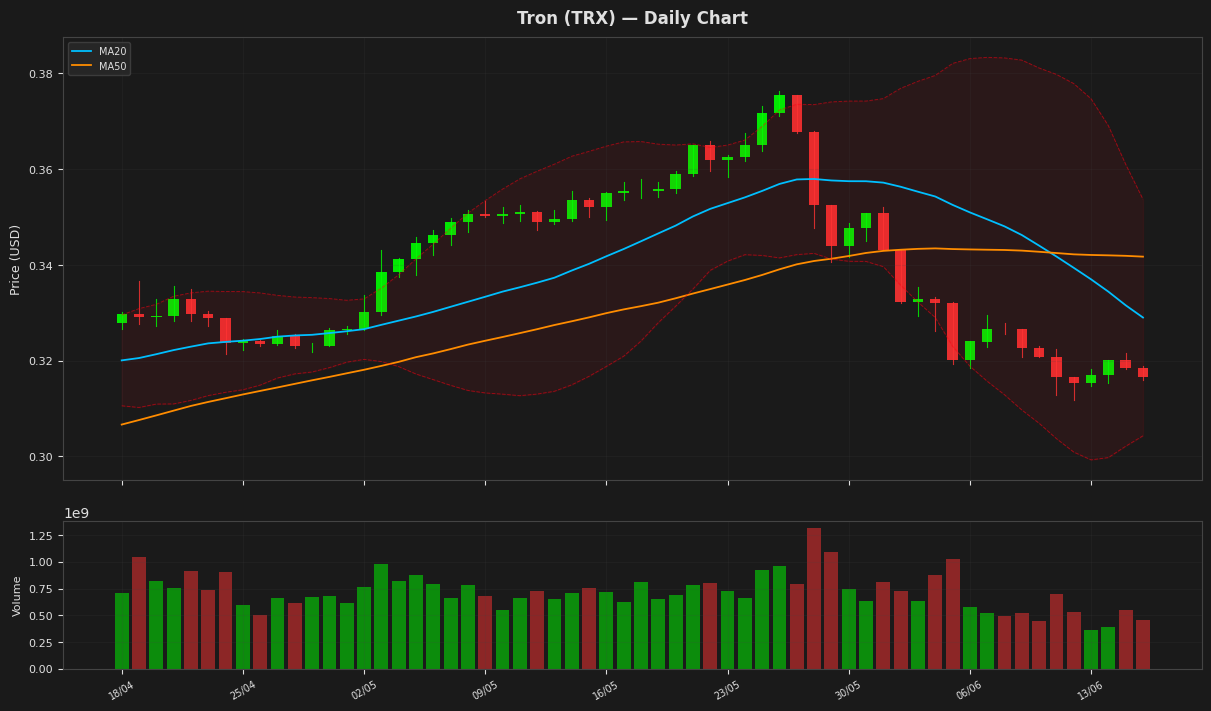
Tron's price is currently at $0.316611, showing a minor decline of 0.58% and is positioned near the lower Bollinger Band at $0.304312, indicating potential oversold conditions. The RSI(14) at 30.211703 further supports this, suggesting the asset may be undervalued. The MACD is below its signal line, indicating a bearish trend, but the proximity to the lower Bollinger Band may signal a potential reversal.
Dogecoin (DOGE) — -0.35%
$0.086810 52W: $0.078095 — $0.255709
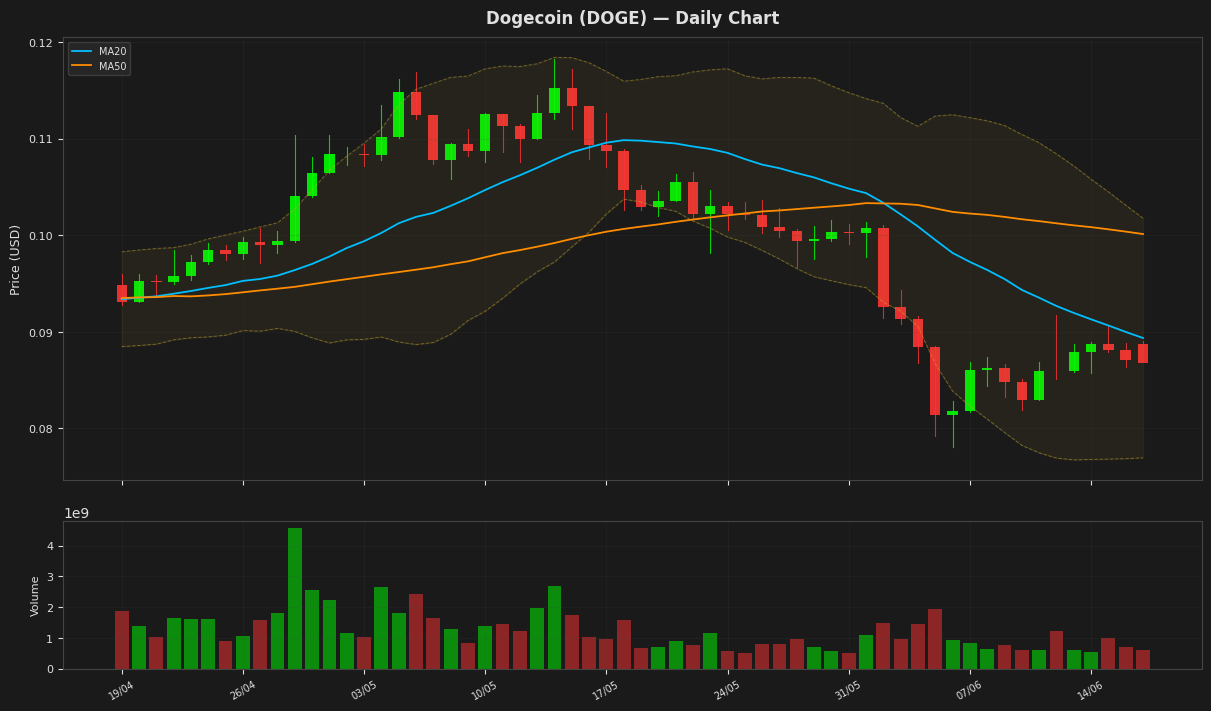
Dogecoin's price is currently at $0.086810, showing a minor decline of 0.35% for the day, and is positioned below both its 20-day and 50-day moving averages, indicating a bearish trend. The Relative Strength Index (RSI) stands at 41.27, suggesting the cryptocurrency is nearing oversold territory. The Bollinger Bands indicate a squeeze, with the price near the lower band at $0.076952, potentially setting up for a move. The MACD is negative and below its signal line, reinforcing the bearish sentiment.
Disclaimer
The content on MarketsFN.com is provided for educational and informational purposes only. It does not constitute financial advice or investment recommendations. All investments involve risk. Past performance does not guarantee future results.