Crypto Market Slumps: Solana, Dogecoin, and Ripple Lead Today's Losses
· Crypto · QuoteReporter
Crypto Market Slumps: Solana, Dogecoin, and Ripple Lead Today's Losses
Crypto Market Report | July 08, 2026
📊 Crypto Market Overview
The cryptocurrency market is currently experiencing a downturn, with most major assets trading in the red. Bitcoin, the largest cryptocurrency by market capitalization, has seen its value decrease by 2.03% over the past 24 hours, trading at $62,014.8789. The Relative Strength Index (RSI) for Bitcoin stands at 54.4, indicating a neutral market sentiment, while the Moving Average Convergence Divergence (MACD) is negative at -757.6103, suggesting a bearish trend.
Other major cryptocurrencies, such as Ethereum, Ripple, and Solana, have also seen declines, with losses ranging from 2.19% to 4.39%. Ethereum's RSI is at 62.2, indicating a slightly overbought condition, while its MACD is negative, signaling a potential downturn. Solana's RSI is at 66.9, also indicating overbought conditions, but its MACD is positive, suggesting a bullish divergence.
The macroeconomic context remains uncertain, with regulatory developments continuing to shape the market. The EU is set to vote again on the 'chat control' rules, and the SEC has crypto rule changes high on its 2026 agenda. Additionally, the CFTC has charged a commodity and crypto pool operator with $14 million in fraud, highlighting the ongoing regulatory scrutiny.
Notable technical signals include Dogecoin's RSI at 37.2, indicating oversold conditions, and BNB's RSI at 49.2, suggesting a neutral market sentiment. Overall, the market is experiencing a period of consolidation, with some assets showing signs of potential reversal. The recent news and developments in the regulatory landscape are likely influencing market sentiment, contributing to the current downturn.
Other major cryptocurrencies, such as Ethereum, Ripple, and Solana, have also seen declines, with losses ranging from 2.19% to 4.39%. Ethereum's RSI is at 62.2, indicating a slightly overbought condition, while its MACD is negative, signaling a potential downturn. Solana's RSI is at 66.9, also indicating overbought conditions, but its MACD is positive, suggesting a bullish divergence.
The macroeconomic context remains uncertain, with regulatory developments continuing to shape the market. The EU is set to vote again on the 'chat control' rules, and the SEC has crypto rule changes high on its 2026 agenda. Additionally, the CFTC has charged a commodity and crypto pool operator with $14 million in fraud, highlighting the ongoing regulatory scrutiny.
Notable technical signals include Dogecoin's RSI at 37.2, indicating oversold conditions, and BNB's RSI at 49.2, suggesting a neutral market sentiment. Overall, the market is experiencing a period of consolidation, with some assets showing signs of potential reversal. The recent news and developments in the regulatory landscape are likely influencing market sentiment, contributing to the current downturn.
📰 Crypto News
- EU to again vote to extend ‘chat control’ rules
- Here’s what happened in crypto today
- StarkWare CEO suggests 4% annual Bitcoin inflation to replace 21M cap
- Swyftx eyes crypto payments after securing Australian license
- Secret Network cites AI exploit risks in proposed Arbitrum move
- CFTC charges commodity, crypto pool operator with $14M fraud
- Strike launches ‘volatility-proof’ Bitcoin loans amid bear market, but at a cost
- SEC crypto rule changes are high on its 2026 agenda
- Ether climbs toward $2K as Bitmine buys ETH, Robinhood L2 boost
- Vanguard seeks digital assets chief after years of crypto skepticism
- New Hampshire lawmakers to hold hearing on $100M Bitcoin bonds
- Live markets: Japan's collapsing yen is pushing companies into bitcoin and XRP
- Bitcoin under pressure as U.S.-Iran escalation lifts oil
- Anthropic Removes Hidden Claude Code Tracker After Researchers Raise Privacy Concerns
- SEC's Long-Promised Crypto Safe Harbor to Be Introduced as Soon as This Month
🔍 Technical Analysis
Bitcoin (BTC) — -2.03%
$62,014.88 52W: $57,747.77 — $111,612.35
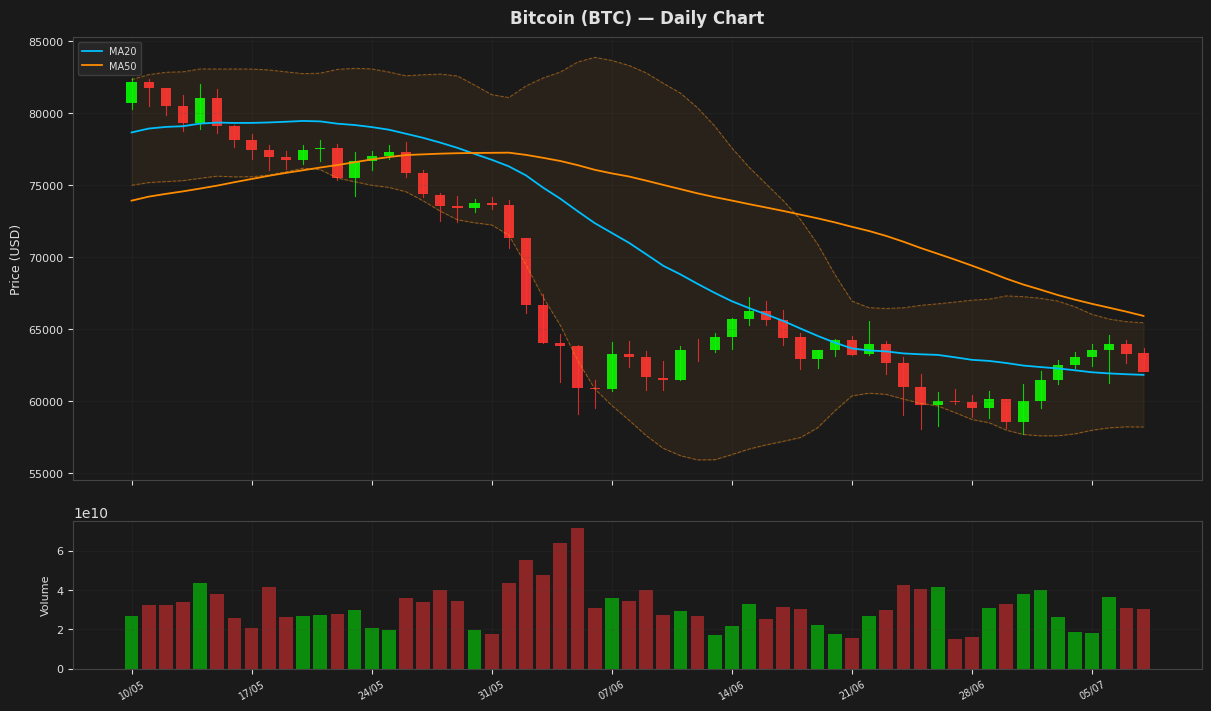
Bitcoin is currently trading at $62,014.88, slightly above its 20-day moving average of $61,825.89, indicating a relatively stable trend. The Relative Strength Index (RSI) at 54.38 suggests a neutral market sentiment, while the MACD line is above its signal line, indicating a potential bullish signal. The price is also within the Bollinger Bands, with the upper and lower bands at $65,442.73 and $58,209.05 respectively.
Ethereum (ETH) — -2.19%
$1,729.75 52W: $1,506.51 — $3,948.22
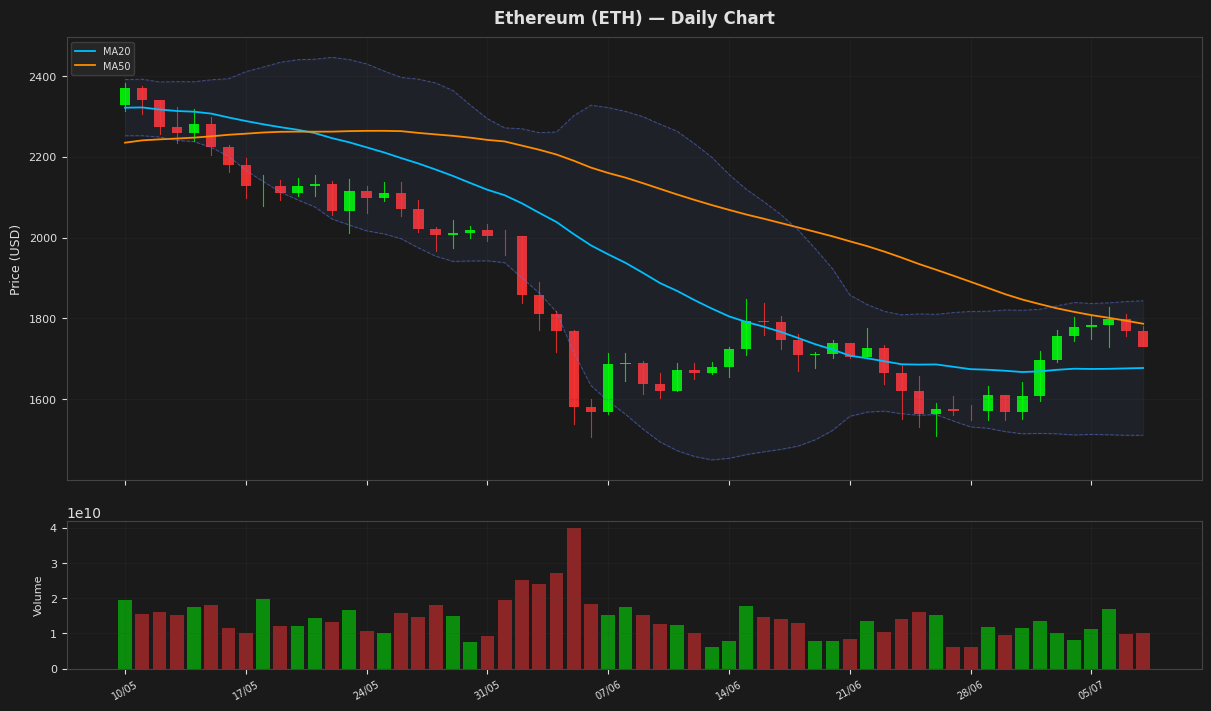
Ethereum's price is currently at $1,729.75, showing a slight decline, and is positioned between its 20-day moving average of $1,677.57 and 50-day moving average of $1,786.95, indicating a potential consolidation phase. The Relative Strength Index at 62.22 suggests the asset is nearing overbought territory but hasn't reached it yet. The MACD line is above its signal line, indicating a potential buy signal, although both are in negative territory.
Ripple (XRP) — -2.89%
$1.0796 52W: $1.0098 — $2.5898
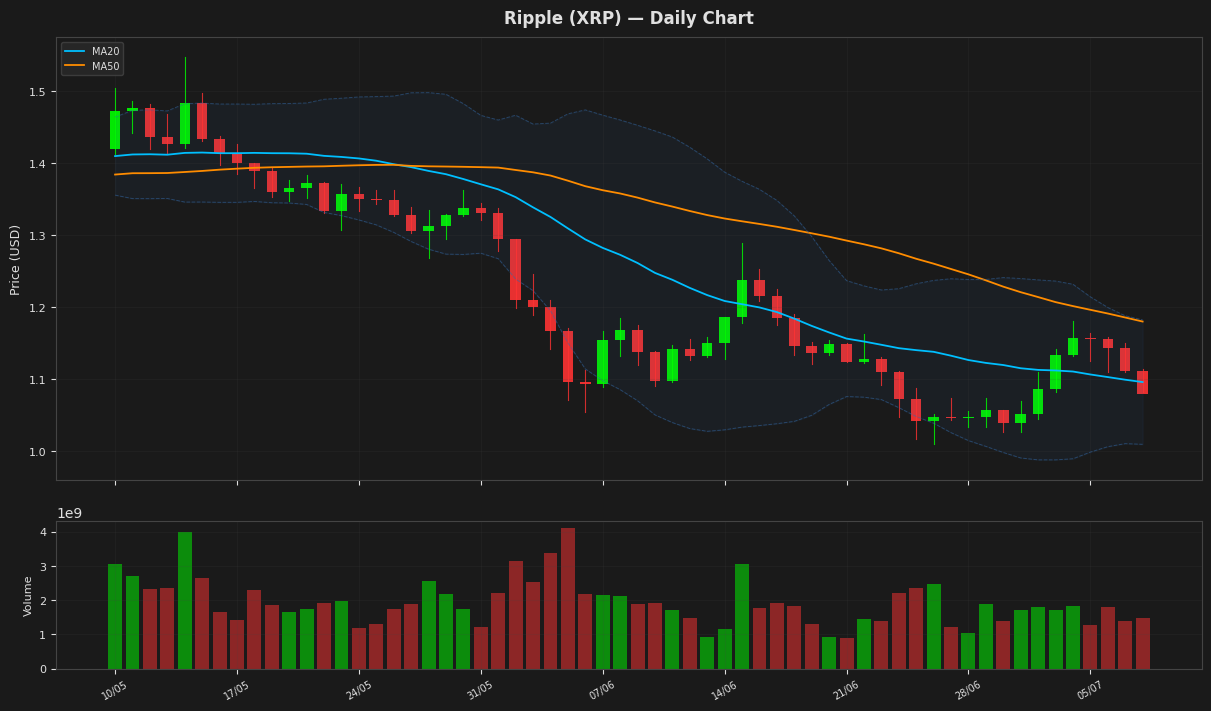
Ripple's price is currently at $1.079600, showing a minor decline, and is positioned near the middle of its Bollinger Bands, indicating a lack of strong directional momentum. The RSI is at 51.400668, suggesting a neutral market sentiment. The MACD is above its signal line, indicating a potential bullish crossover, while the ATR suggests moderate volatility. The price is still below both MA20 and MA50, indicating a downtrend.
Solana (SOL) — -4.39%
$77.1100 52W: $60.4147 — $198.0395
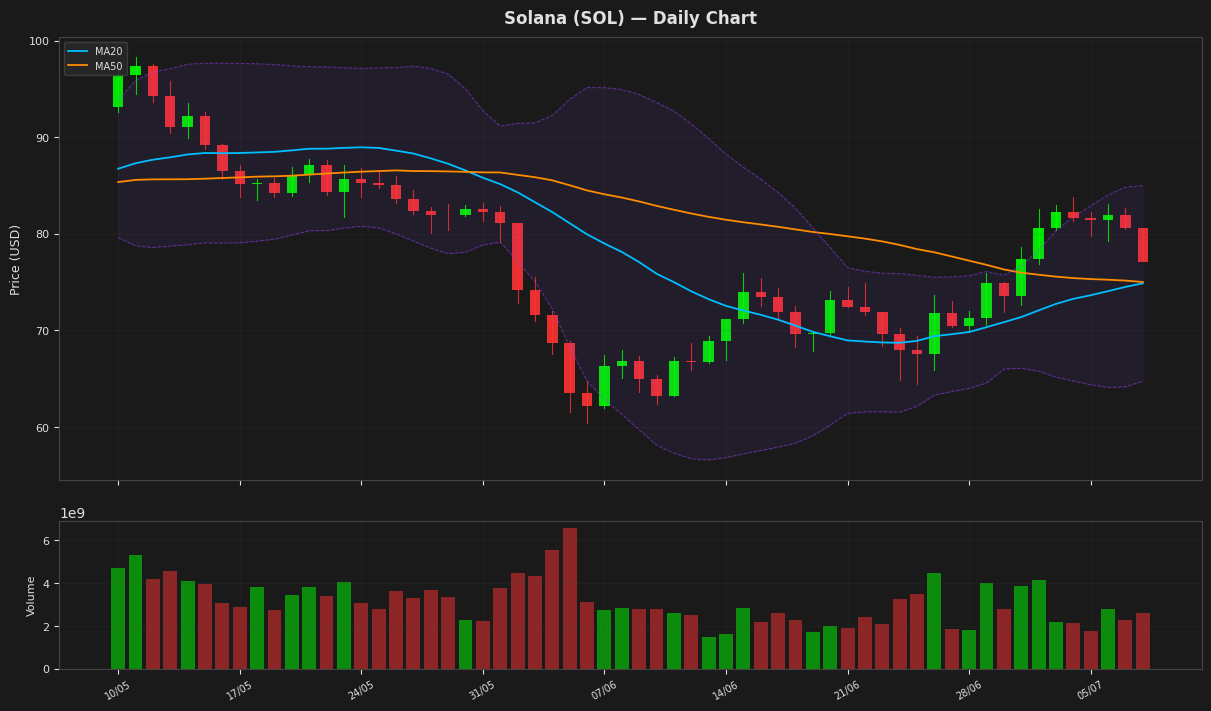
Solana's price is currently at $77.11, showing a decline of 4.39% for the day, yet it remains above both its MA20 and MA50, indicating a maintained short to medium-term uptrend. The RSI is at 66.92, suggesting the asset is nearing overbought territory but hasn't reached it. The MACD is above its signal line, indicating a bullish signal. The price is below the upper Bollinger Band at $85.00, indicating there is room for further upside before it reaches overbought levels.
BNB (BNB) — -2.59%
$561.8800 52W: $538.5992 — $1,123.70
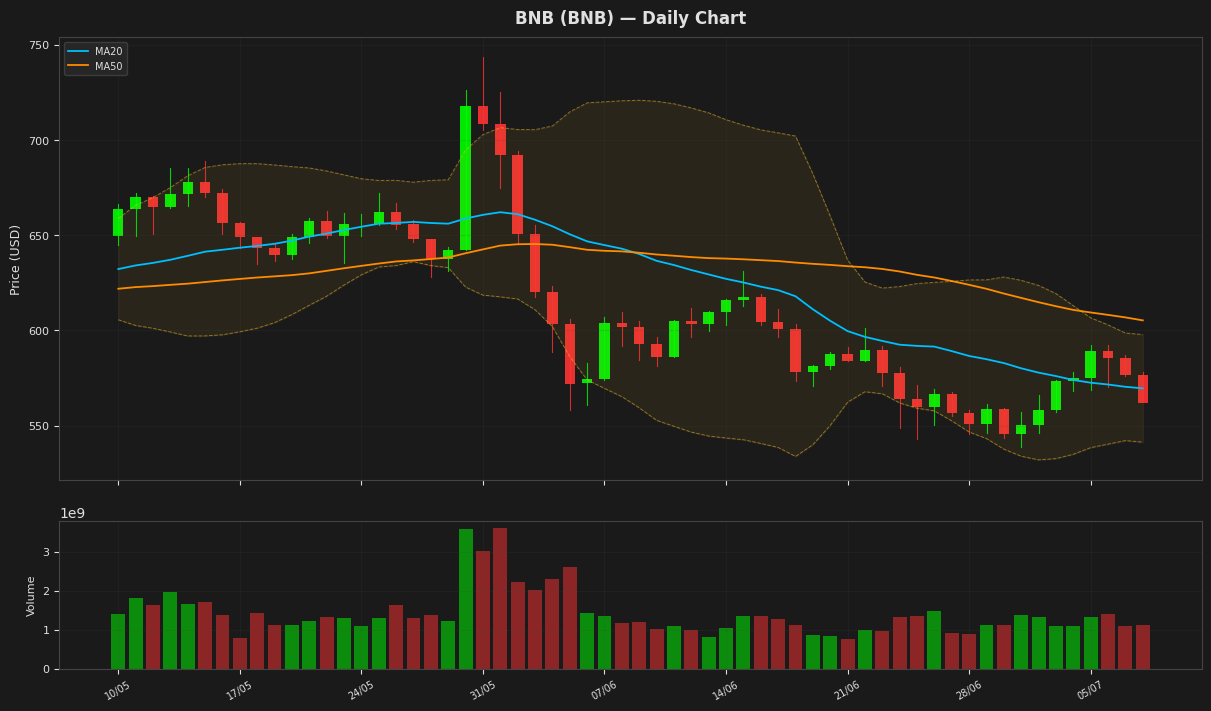
BNB is currently trading at $561.88, slightly above its 52-week low, and is experiencing a minor decline. The price is positioned between the lower Bollinger Band at $541.33 and the MA20 at $569.58, indicating a potential consolidation phase. The RSI is near neutral at 49.20, while the MACD is below its signal line, suggesting a bearish trend. The ATR indicates moderate volatility.
Tron (TRX) — -0.92%
$0.328461 52W: $0.268138 — $0.376332
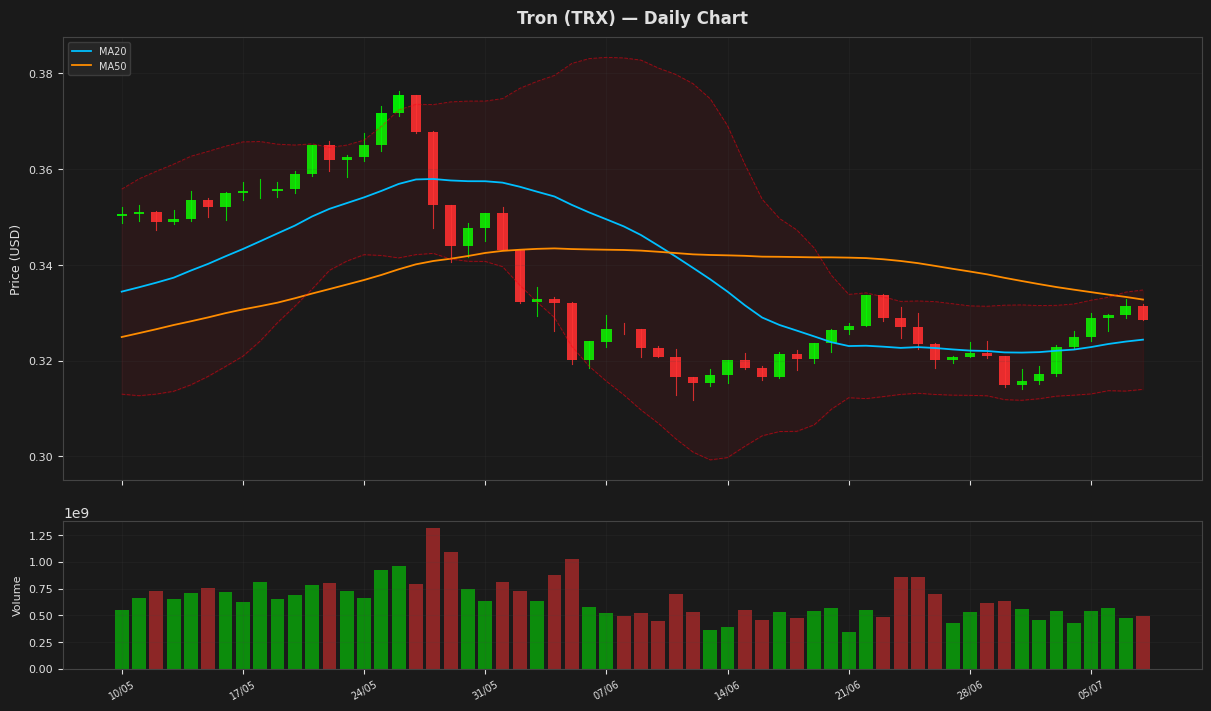
Tron's price is currently at $0.328461, slightly above its 20-day moving average of 0.324385, indicating a neutral to slightly bullish trend. The Relative Strength Index (RSI) at 52.16061 suggests a balanced market with no extreme buying or selling pressure. The Bollinger Bands indicate that the price is near the upper band at 0.334756, suggesting potential resistance at this level. The MACD is negative but showing a potential crossover with its signal line.
Dogecoin (DOGE) — -3.86%
$0.071320 52W: $0.069611 — $0.194489
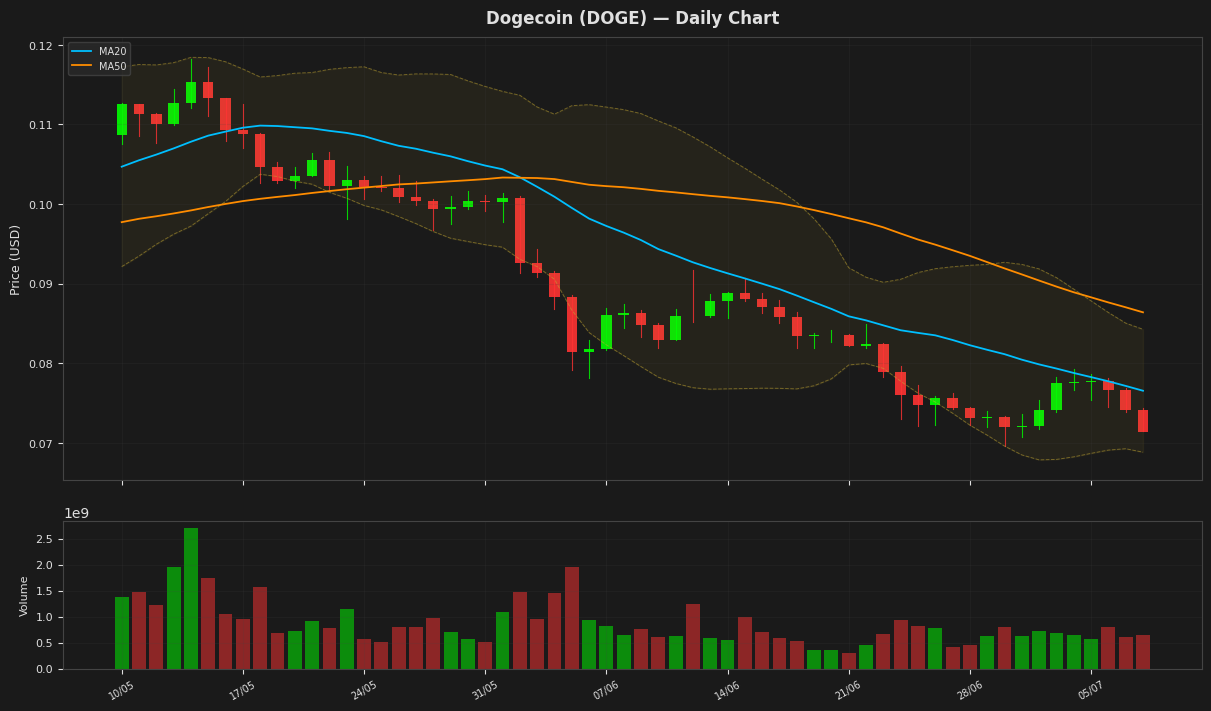
Dogecoin's price is currently at $0.071320, down 3.86% for the day, and is trading near the lower end of its Bollinger Bands, with the lower band at $0.068828. The RSI is at 37.19, indicating oversold conditions, while the MACD is below its signal line, suggesting a bearish trend. The price is also below both the 20-day and 50-day moving averages, further indicating a downtrend.
Disclaimer
The content on MarketsFN.com is provided for educational and informational purposes only. It does not constitute financial advice or investment recommendations. All investments involve risk. Past performance does not guarantee future results.