Crypto Market Update: Ripple Surges as Bitcoin Gains, Ethereum Slips Slightly
· Crypto · QuoteReporter
Crypto Market Update: Ripple Surges as Bitcoin Gains, Ethereum Slips Slightly
Crypto Market Report | July 29, 2026
📊 Crypto Market Overview
The cryptocurrency market is currently displaying a mixed sentiment, with some assets experiencing gains while others decline. Bitcoin, the largest cryptocurrency by market capitalization, is trading at $64,208, having risen by 0.53% over the past 24 hours. The Relative Strength Index (RSI) for Bitcoin stands at 47.4, indicating a neutral position, while the Moving Average Convergence Divergence (MACD) is at 213.5863, suggesting a potential for further price movement.
Among the key movers, Ripple (XRP) has seen a notable increase of 1.51%, reaching $1.0841. In contrast, Ethereum (ETH) has declined by 0.50% to $1,910.2700, and Solana (SOL) has decreased by 0.05% to $73.6600. The RSI values for these assets are 49.2, 43.5, and 38.2, respectively, indicating varying levels of market sentiment.
The macroeconomic context is influencing the cryptocurrency market, with recent news highlighting regulatory developments and institutional involvement. The UK has identified cross-border payments as a primary use case for stablecoins, and South Korea is planning to introduce regulations for stablecoins. Additionally, Tether has signed a tokenization deal with the Nairobi Securities Exchange, indicating growing interest in the application of blockchain technology.
From a technical perspective, the MACD values for various cryptocurrencies are providing insight into their current trends. Bitcoin's MACD is positive, while Ethereum's is also positive but decreasing. In contrast, Ripple's MACD is negative, and Solana's is also negative, indicating potential downward pressure. Overall, the cryptocurrency market is characterized by a complex interplay of factors, with both positive and negative influences at play. The current technical signals and macroeconomic context are shaping the market's dynamics, with various assets responding differently to these factors.
Among the key movers, Ripple (XRP) has seen a notable increase of 1.51%, reaching $1.0841. In contrast, Ethereum (ETH) has declined by 0.50% to $1,910.2700, and Solana (SOL) has decreased by 0.05% to $73.6600. The RSI values for these assets are 49.2, 43.5, and 38.2, respectively, indicating varying levels of market sentiment.
The macroeconomic context is influencing the cryptocurrency market, with recent news highlighting regulatory developments and institutional involvement. The UK has identified cross-border payments as a primary use case for stablecoins, and South Korea is planning to introduce regulations for stablecoins. Additionally, Tether has signed a tokenization deal with the Nairobi Securities Exchange, indicating growing interest in the application of blockchain technology.
From a technical perspective, the MACD values for various cryptocurrencies are providing insight into their current trends. Bitcoin's MACD is positive, while Ethereum's is also positive but decreasing. In contrast, Ripple's MACD is negative, and Solana's is also negative, indicating potential downward pressure. Overall, the cryptocurrency market is characterized by a complex interplay of factors, with both positive and negative influences at play. The current technical signals and macroeconomic context are shaping the market's dynamics, with various assets responding differently to these factors.
📰 Crypto News
- Trump teleprompter operator accused over Kalshi bets leaves government: AP
- Bitcoin ETFs extend outflow streak as BTC fails to hold $65K
- UK policy sprint finds cross-border payments are stablecoins’ top use case
- Telegram founder Pavel Durov internationally wanted, Russia’s FSB says
- Trade.xyz to cover SK Hynix perp liquidation losses tied to price anomaly
- Uniswap founder rejects claims v4 fees reduce LP earnings
- South Korea plans stablecoin rules as opposition pushes crypto tax repeal
- Celsius-linked Bitcoin miner Ionic Digital gains 26% in Nasdaq debut
- Tether signs tokenization deal with Nairobi Securities Exchange
- Zcash says Ironwood proof rules out undetectable counterfeiting bugs
- European financial institutions launch RL1 cooperative blockchain network
- Myanmar Parliament passes crypto scam bill with penalties up to life
- Visa outlines stablecoin strategy during Q3 earnings call
- SpaceX is a battleground Solana must win
- Live updates: Bitcoin clears $64,000 in Asia hours ahead of Fed decision
🔍 Technical Analysis
Bitcoin (BTC) — +0.53%
$64,208.43 52W: $57,747.77 — $97,860.60
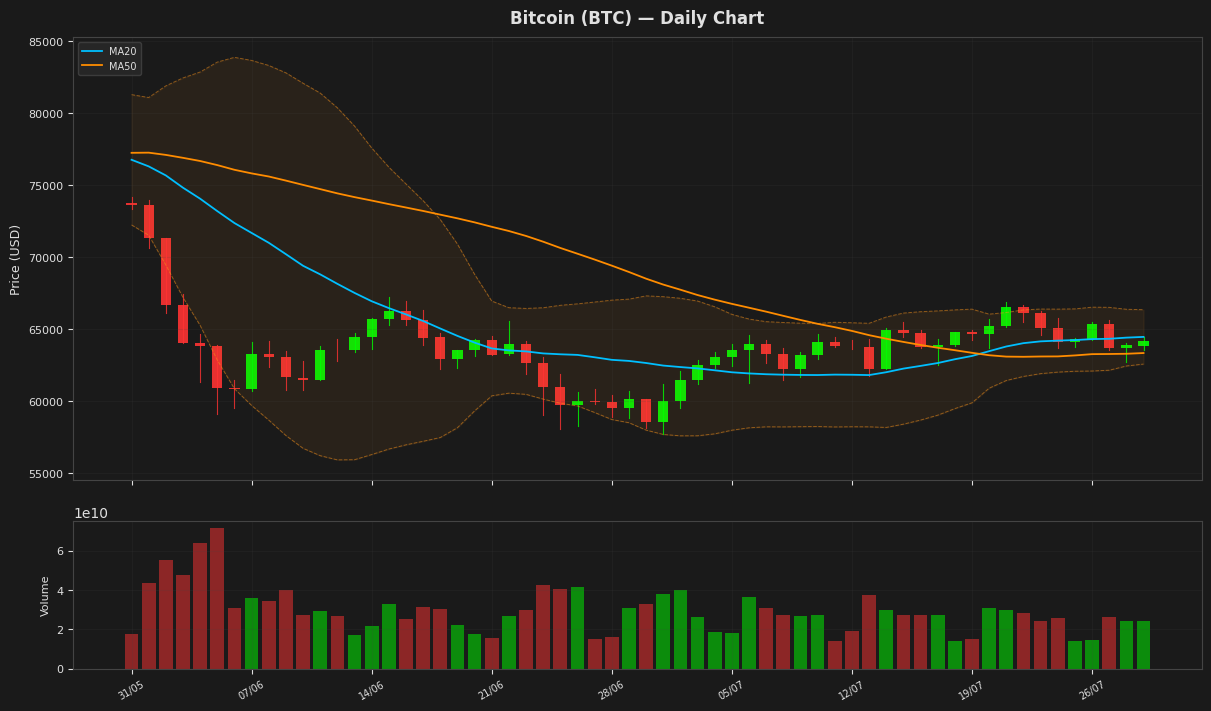
Bitcoin is currently trading at $64,208 with a slight increase of 0.53% in a day, near its 20-day moving average of $64,460, indicating a neutral short-term trend. The RSI at 47.37 suggests that the asset is neither overbought nor oversold. The MACD is below its signal line, indicating a potential bearish signal, while the price remains within the Bollinger Bands, suggesting a stable volatility.
Ethereum (ETH) — -0.50%
$1,910.27 52W: $1,506.51 — $3,446.62
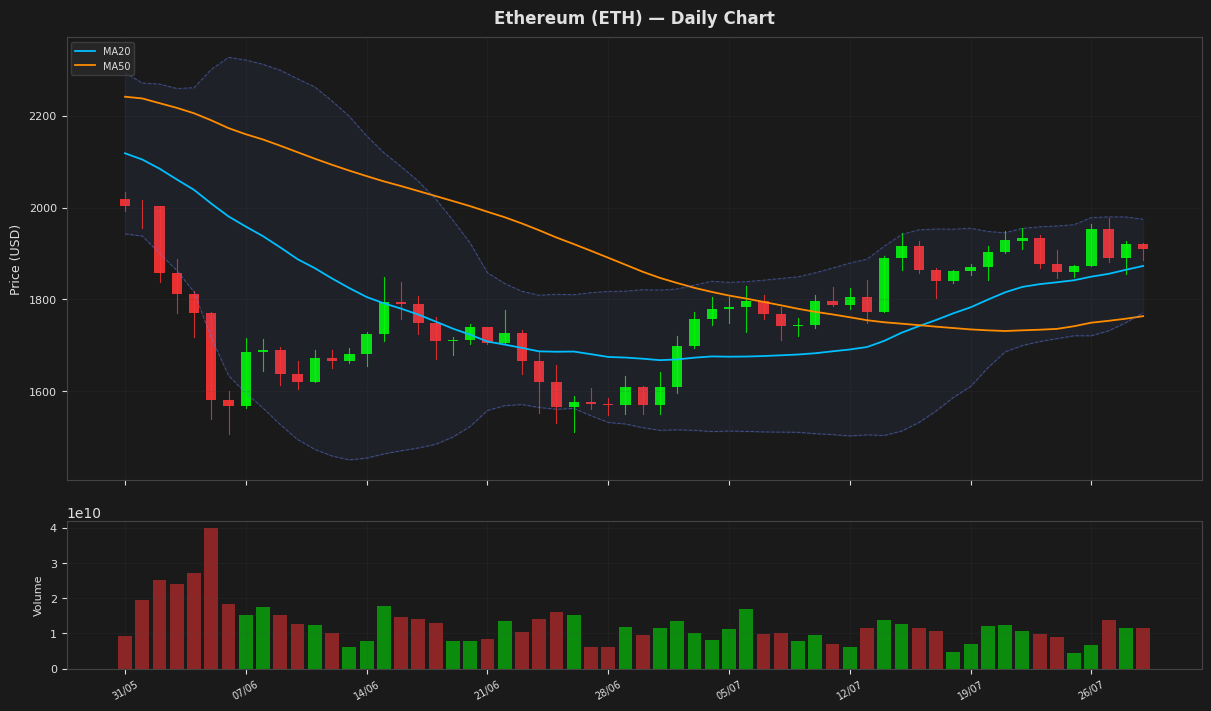
Ethereum is currently trading at $1,910.27 with a slight decline of 0.50% in a day, positioned above its MA20 and MA50, indicating a relatively stable trend. The RSI is at 49.24, suggesting a neutral market sentiment, while the MACD is close to its signal line, indicating a potential consolidation. The price is also within the Bollinger Bands, with the upper and lower bands at $1,974.71 and $1,770.99 respectively.
Ripple (XRP) — +1.51%
$1.0841 52W: $1.0098 — $2.4103
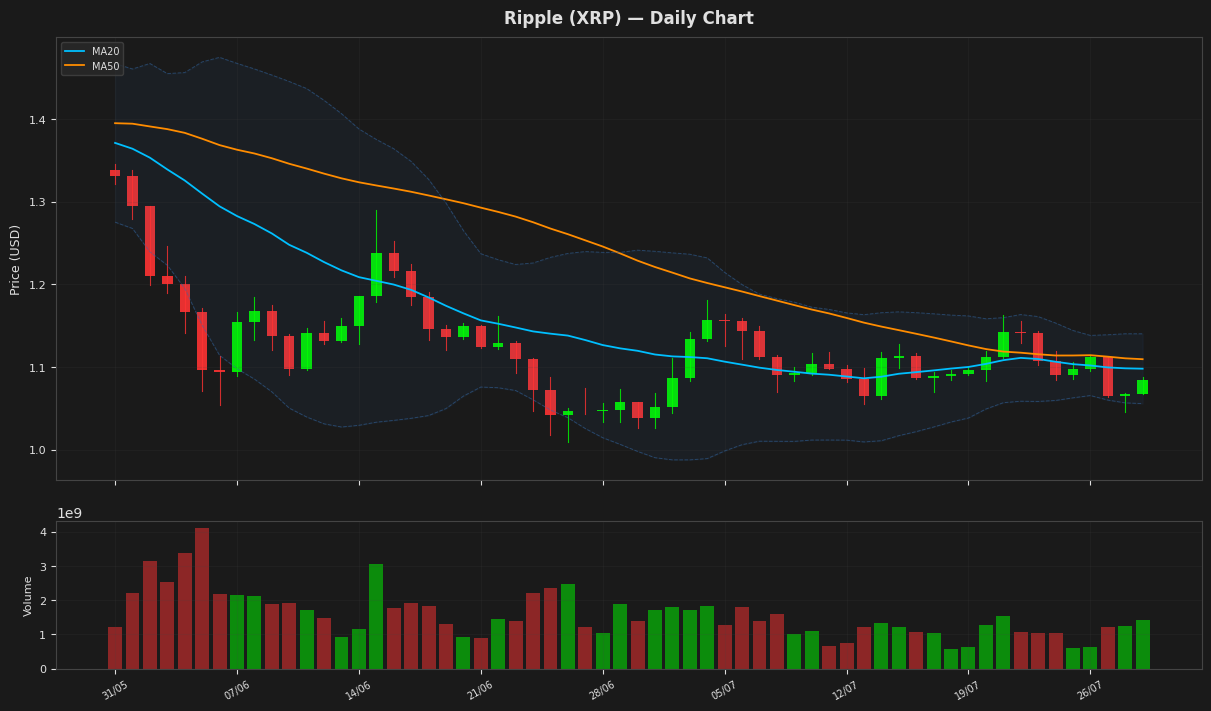
Ripple's price is currently at $1.084100, showing a slight increase, and is positioned near the middle of its Bollinger Bands, with the upper and lower bands at $1.140198 and $1.055796 respectively. The RSI is at 43.489951, indicating that the asset is not in extreme oversold or overbought territory. The MACD is below its signal line, suggesting a bearish signal, while the ATR indicates moderate volatility.
Solana (SOL) — -0.05%
$73.6600 52W: $60.4147 — $148.2160
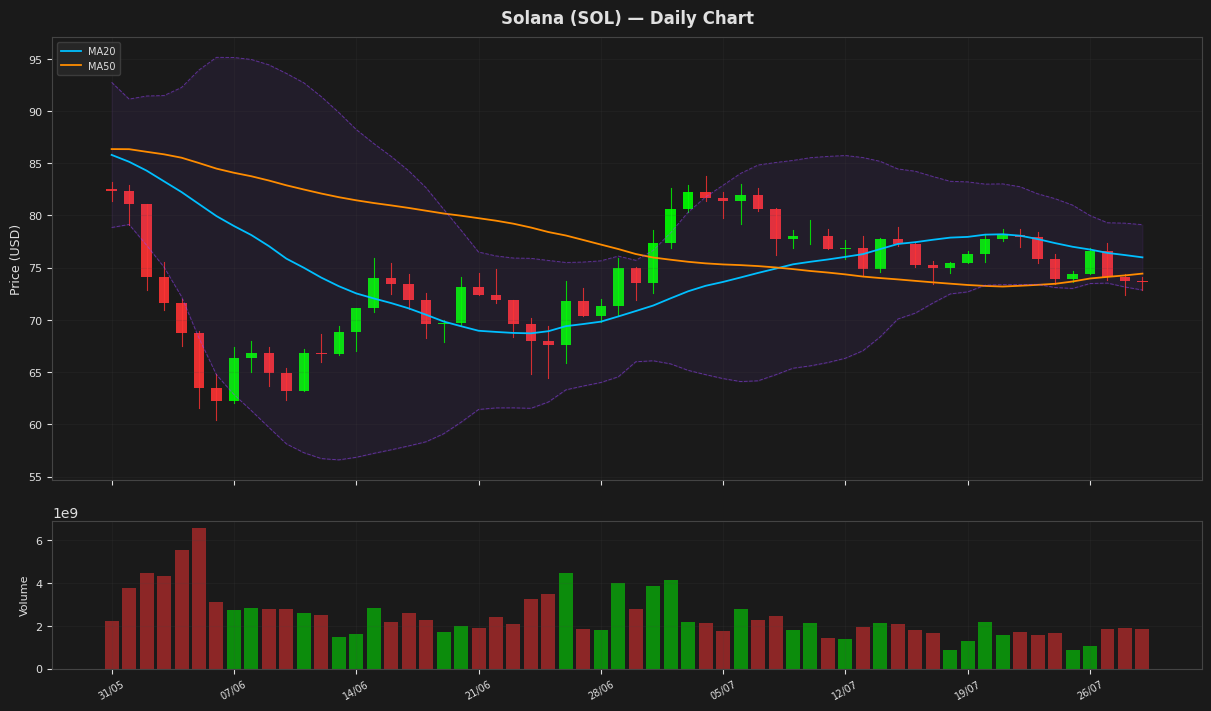
Solana's price is currently at $73.66, showing a minimal decline of 0.05% for the day, and is positioned between its 20-day and 50-day moving averages, indicating a lack of clear direction. The RSI is at 38.18, suggesting that the asset is nearing oversold territory. The MACD is below its signal line, indicating a bearish signal. The price is also closer to the lower Bollinger Band at $72.86, which could act as a support level.
BNB (BNB) — -0.13%
$569.7400 52W: $538.5992 — $954.8583
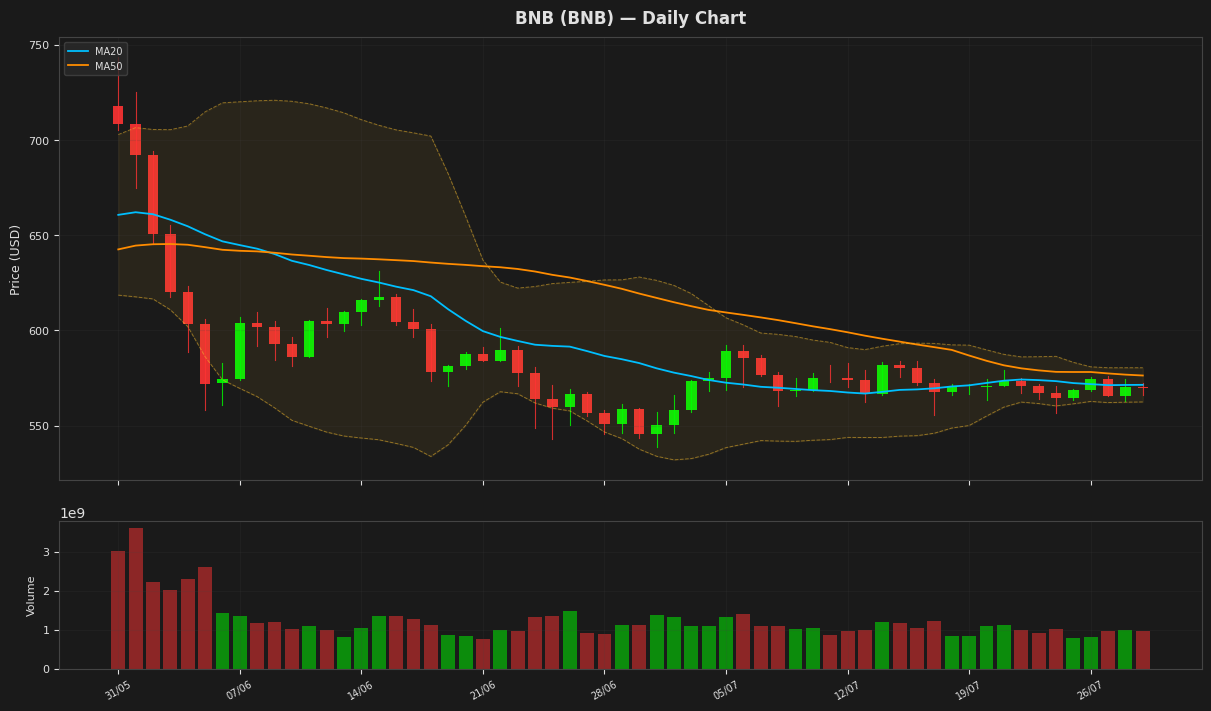
BNB is currently trading at $569.74, slightly below its MA20 and MA50, indicating a neutral to slightly bearish trend. The RSI is at 40.01, suggesting the asset is nearing oversold territory, while the MACD is below its signal line, reinforcing the bearish sentiment. The price is also near the lower band of the Bollinger Bands, at $562.44, indicating potential support.
Tron (TRX) — +0.40%
$0.325769 52W: $0.268138 — $0.376332
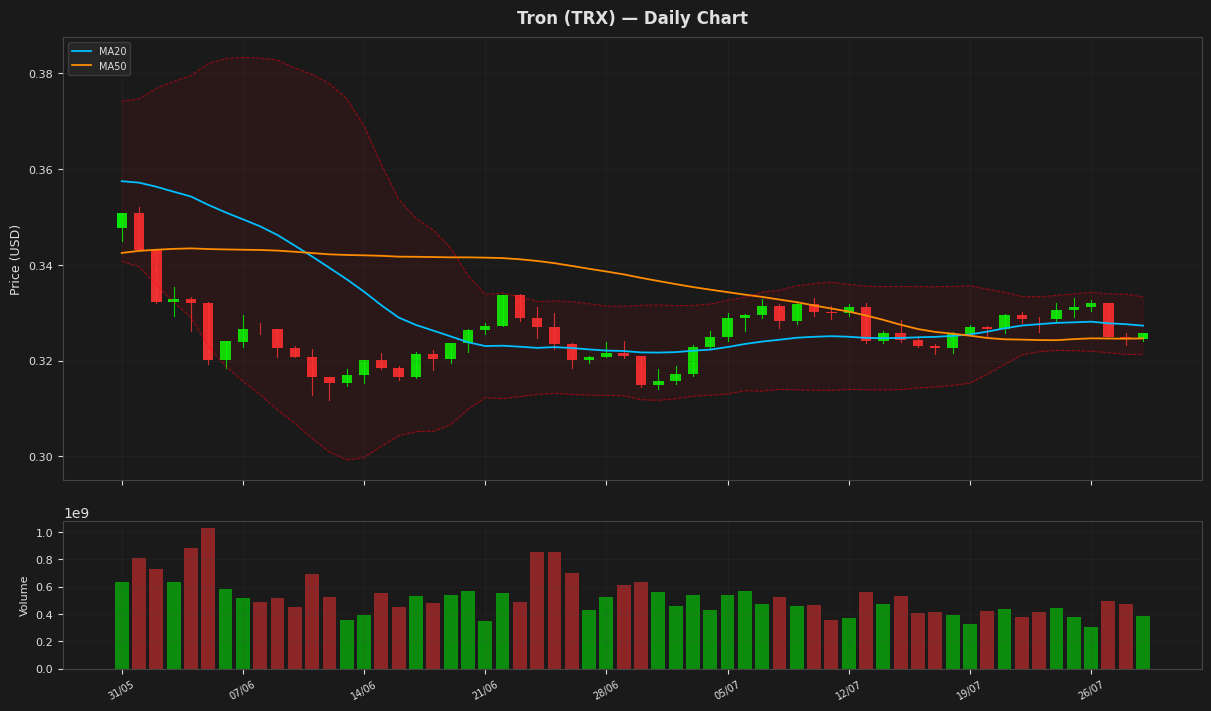
Tron's price is currently at $0.325769, showing a minor increase of 0.40% and trading near its 20-day and 50-day moving averages, indicating a lack of clear direction. The Relative Strength Index is at 53.14, suggesting a neutral market sentiment. The Bollinger Bands indicate that the price is near the upper band at $0.333316, potentially facing resistance.
Dogecoin (DOGE) — -0.48%
$0.070410 52W: $0.068293 — $0.159100
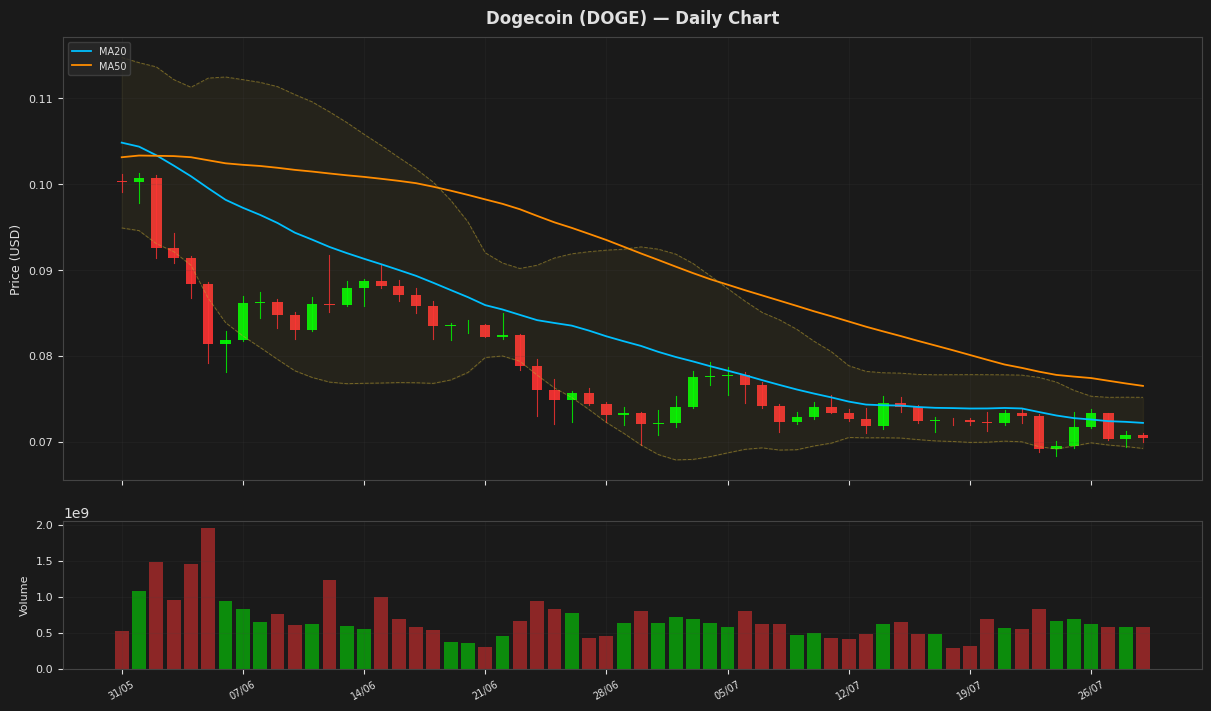
Dogecoin's price is currently at $0.070410, showing a slight decline of 0.48% and trading near the lower Bollinger Band at 0.069196, indicating potential oversold conditions. The RSI(14) at 38.216605 further supports this, as it is below 40, suggesting the cryptocurrency may be due for a bounce. The MACD is negative and below its signal line, indicating a bearish trend. The price is also below both MA20 and MA50, reinforcing the downtrend.
Disclaimer
The content on MarketsFN.com is provided for educational and informational purposes only. It does not constitute financial advice or investment recommendations. All investments involve risk. Past performance does not guarantee future results.