Dogecoin at Key Support: Oversold RSI Hints Rebound Ahead
· Crypto · QuoteReporter
Dogecoin at Key Support: Oversold RSI Hints Rebound Ahead
Dogecoin (DOGE/USD) | July 06, 2026 $0.0768 -1.15%
🔍 Technical Analysis
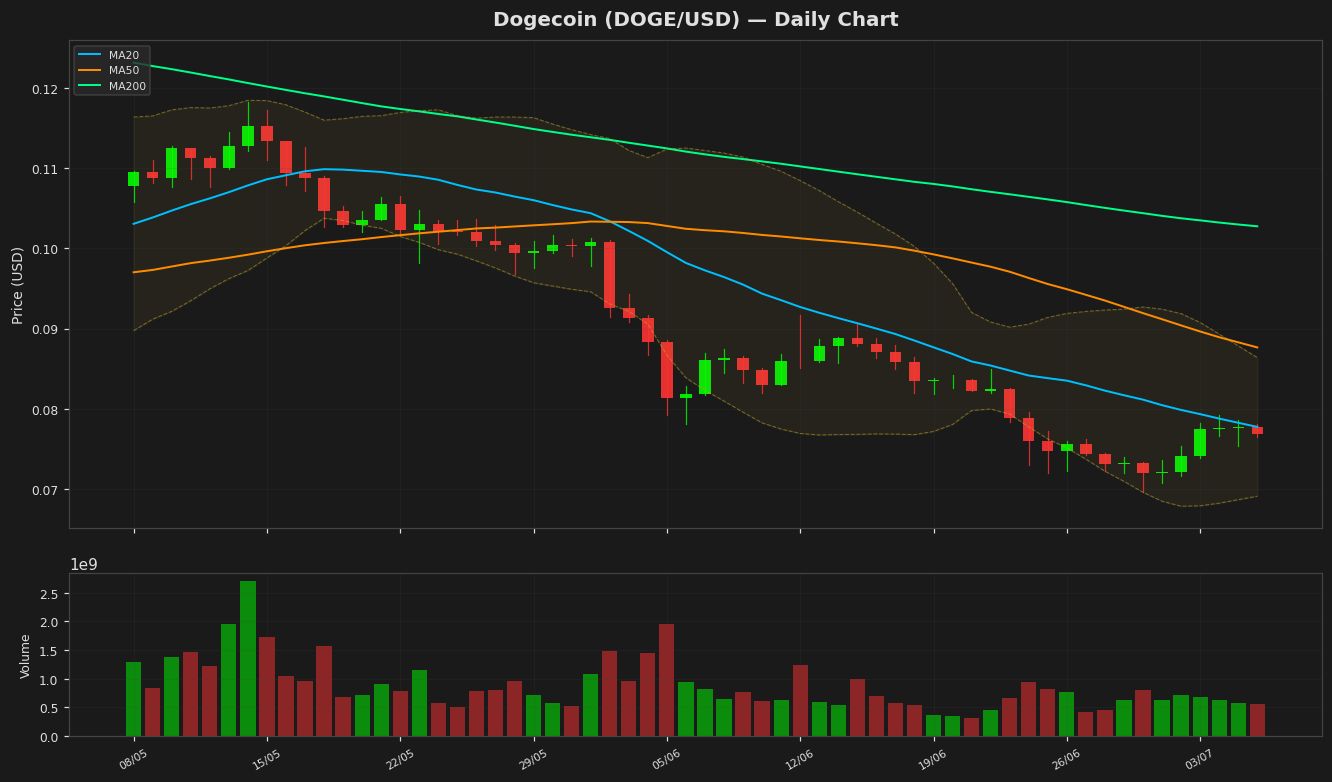
Dogecoin (DOGE) is currently trading at $0.076840, down 1.15% on the day, reflecting bearish sentiment in the short term. The price remains below key moving averages, with the MA20 at $0.077747 and the MA50 at $0.087646, indicating sustained downward pressure. The MA200 at $0.102736 further underscores the long-term downtrend. Bollinger Bands show a narrowing range, with the upper band at $0.086384 and the lower band at $0.06911, suggesting reduced volatility and potential consolidation. The price is hovering near the lower band, which may act as temporary support. The RSI(14) at 35.49 is approaching oversold territory but has not yet signaled a reversal. The MACD histogram is negative at -0.003338, with the signal line at -0.004218, confirming bearish momentum. Key support lies at the 52-week low of $0.069611, while immediate resistance is at the MA20 level of $0.077747. A break above this level could target the MA50 at $0.087646. The ATR(14) of $0.003451 indicates low volatility, suggesting limited near-term price movement. Dogecoin remains in a broader downtrend, with buyers needing to reclaim higher moving averages to shift momentum.
Technical Metrics
| Metric | Value |
|---|---|
| Current Price | $0.0768 |
| Daily Change | -1.15% |
| MA 20 | $0.0777 |
| % from MA20 | -1.17% |
| MA 50 | $0.0876 |
| % from MA50 | -12.33% |
| MA 200 | $0.1027 |
| % from MA200 | -25.21% |
| BB Upper | $0.0864 |
| % from BB Upper | -11.05% |
| BB Lower | $0.0691 |
| % from BB Lower | +11.19% |
| RSI (14) | 35.49 |
| MACD | -0.003338 |
| MACD Signal | -0.004218 |
| ATR (14) | 0.003451 |
| 3-Day High | $0.0792 |
| 3-Day Low | $0.0754 |
| 52-Week High | $0.2029 |
| % from 52W High | -62.13% |
| 52-Week Low | $0.0696 |
| % from 52W Low | +10.38% |
| YTD High | $0.1561 |
| % from YTD High | -50.77% |
| YTD Low | $0.0696 |
| % from YTD Low | +10.38% |
📊 Market Commentary
Dogecoin (DOGE) is trading at $0.0768, down 1.15% today, as the meme coin continues to face mild selling pressure amid broader market uncertainty. The Relative Strength Index (RSI) sits at 35.5, indicating DOGE is nearing oversold territory but not yet at levels that typically signal a strong reversal. Over the past 52 weeks, DOGE has fluctuated between $0.0696 and $0.2029, with the current price hovering closer to the lower end of that range.
Market sentiment remains cautious, with traders closely monitoring Bitcoin’s price action for directional cues. DOGE’s correlation with BTC remains significant, and any sustained downturn in the broader crypto market could push DOGE toward its yearly low. Key support levels to watch include $0.0750, a psychological level, followed by the 52-week low of $0.0696. On the upside, resistance is seen near $0.0800, a level that has acted as both support and resistance in recent weeks.
Traders are also paying attention to trading volume, which has been subdued, suggesting limited conviction from both buyers and sellers. The lack of strong momentum in either direction indicates a wait-and-see approach among market participants. While the RSI suggests DOGE is approaching oversold conditions, a clear catalyst or shift in broader market sentiment may be needed for a meaningful rebound. For now, DOGE remains range-bound, with traders watching key levels for potential breakout or breakdown signals.
Market sentiment remains cautious, with traders closely monitoring Bitcoin’s price action for directional cues. DOGE’s correlation with BTC remains significant, and any sustained downturn in the broader crypto market could push DOGE toward its yearly low. Key support levels to watch include $0.0750, a psychological level, followed by the 52-week low of $0.0696. On the upside, resistance is seen near $0.0800, a level that has acted as both support and resistance in recent weeks.
Traders are also paying attention to trading volume, which has been subdued, suggesting limited conviction from both buyers and sellers. The lack of strong momentum in either direction indicates a wait-and-see approach among market participants. While the RSI suggests DOGE is approaching oversold conditions, a clear catalyst or shift in broader market sentiment may be needed for a meaningful rebound. For now, DOGE remains range-bound, with traders watching key levels for potential breakout or breakdown signals.
Disclaimer
The content on MarketsFN.com is provided for educational and informational purposes only. It does not constitute financial advice or investment recommendations. All investments involve risk. Cryptocurrency markets are highly volatile. Past performance does not guarantee future results.