Tron Price Dips to $0.3268 as RSI Nears Oversold Zone
· Crypto · QuoteReporter
Tron Price Dips to $0.3268 as RSI Nears Oversold Zone
Tron (TRX/USD) | July 06, 2026 $0.3268 -0.66%
🔍 Technical Analysis
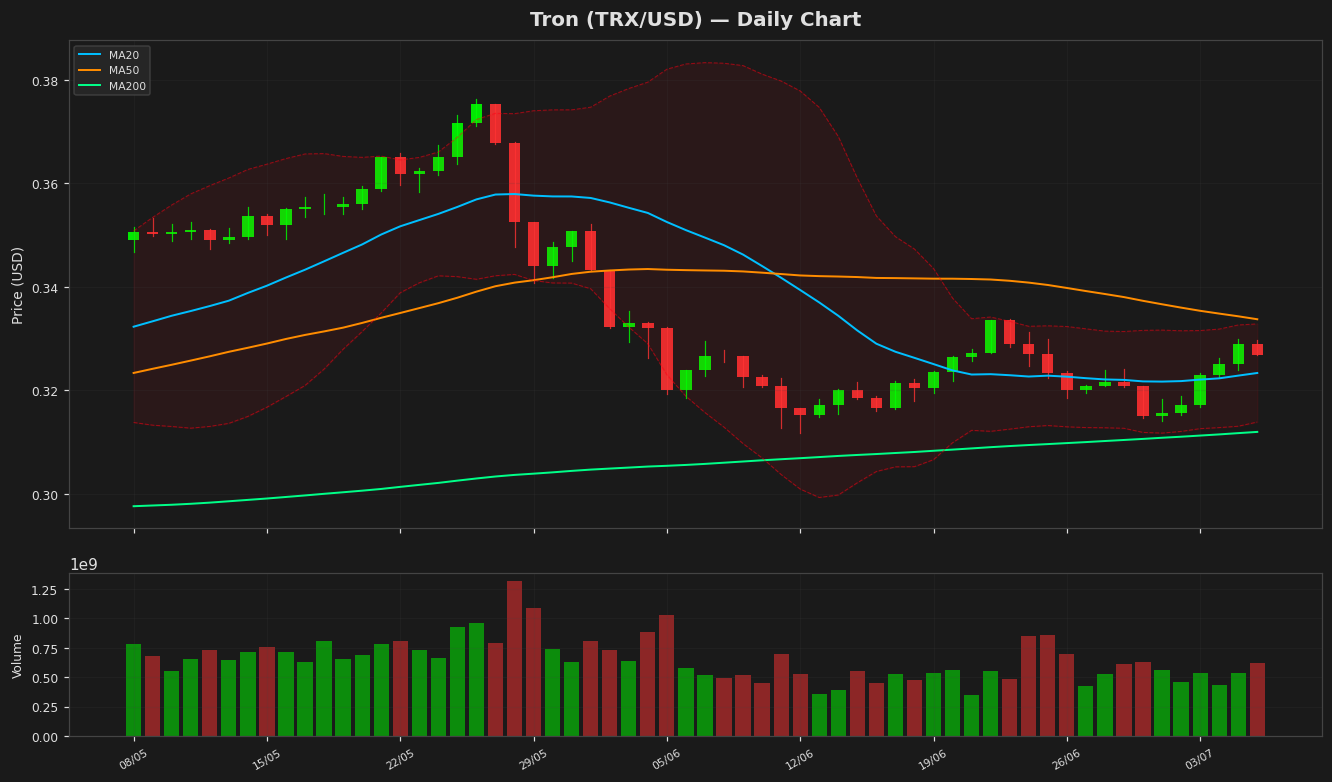
Tron (TRX) is currently trading at $0.326813, showing a minor daily decline of 0.66%. The price action remains confined within a consolidation phase, hovering near the 20-day moving average (MA20) at $0.323348, while the 50-day moving average (MA50) at $0.333732 acts as overhead resistance. The MA200 at $0.311961 provides a key long-term support level. Bollinger Bands indicate a narrowing range, with the upper band at $0.332826 and the lower band at $0.313871, suggesting reduced volatility and potential for a breakout. The RSI(14) at 40.987317 reflects neutral momentum, neither oversold nor overbought, while the MACD histogram shows a bearish crossover with the MACD line at -0.001546 below the signal line at -0.002919, indicating weak short-term momentum. The Average True Range (ATR) of 0.00472 highlights low volatility. Key resistance levels to watch are the YTD high of $0.37633201 and the MA50, while support lies at the MA200 and the 52-week low of $0.26813799. A break above the MA50 could signal bullish momentum, whereas a drop below the MA200 may trigger further downside. Traders should monitor these levels closely for potential directional cues.
Technical Metrics
| Metric | Value |
|---|---|
| Current Price | $0.3268 |
| Daily Change | -0.66% |
| MA 20 | $0.3233 |
| % from MA20 | +1.07% |
| MA 50 | $0.3337 |
| % from MA50 | -2.07% |
| MA 200 | $0.3120 |
| % from MA200 | +4.76% |
| BB Upper | $0.3328 |
| % from BB Upper | -1.81% |
| BB Lower | $0.3139 |
| % from BB Lower | +4.12% |
| RSI (14) | 40.99 |
| MACD | -0.001546 |
| MACD Signal | -0.002919 |
| ATR (14) | 0.004720 |
| 3-Day High | $0.3299 |
| 3-Day Low | $0.3227 |
| 52-Week High | $0.3763 |
| % from 52W High | -13.16% |
| 52-Week Low | $0.2681 |
| % from 52W Low | +21.88% |
| YTD High | $0.3763 |
| % from YTD High | -13.16% |
| YTD Low | $0.2681 |
| % from YTD Low | +21.88% |
📊 Market Commentary
Tron (TRX) is currently trading at $0.3268, down 0.66% today, as the broader crypto market shows mixed sentiment. The Relative Strength Index (RSI) at 41.0 suggests TRX is in neutral territory, neither oversold nor overbought, indicating a balanced market with no immediate directional bias. Over the past 52 weeks, TRX has fluctuated between $0.2681 and $0.3763, with the current price sitting closer to the mid-range, reflecting moderate stability.
Market sentiment for TRX remains cautious, influenced by broader macroeconomic factors and fluctuating demand for layer-1 blockchain platforms. Traders are closely watching the $0.3200 level as near-term support, with a break below potentially testing the yearly low of $0.2681. On the upside, resistance near $0.3500 and the yearly high of $0.3763 remain key hurdles for bullish momentum.
Volume trends have been subdued, suggesting limited speculative interest in the short term. The network’s steady adoption and recent developments, including partnerships and decentralized application growth, provide underlying support, but market participants remain wary of volatility. For now, TRX appears to be consolidating within its established range, with traders monitoring Bitcoin’s movements and overall crypto market sentiment for directional cues. A sustained move above $0.3400 could renew buying interest, while failure to hold $0.3200 may invite further downside pressure.
Market sentiment for TRX remains cautious, influenced by broader macroeconomic factors and fluctuating demand for layer-1 blockchain platforms. Traders are closely watching the $0.3200 level as near-term support, with a break below potentially testing the yearly low of $0.2681. On the upside, resistance near $0.3500 and the yearly high of $0.3763 remain key hurdles for bullish momentum.
Volume trends have been subdued, suggesting limited speculative interest in the short term. The network’s steady adoption and recent developments, including partnerships and decentralized application growth, provide underlying support, but market participants remain wary of volatility. For now, TRX appears to be consolidating within its established range, with traders monitoring Bitcoin’s movements and overall crypto market sentiment for directional cues. A sustained move above $0.3400 could renew buying interest, while failure to hold $0.3200 may invite further downside pressure.
Disclaimer
The content on MarketsFN.com is provided for educational and informational purposes only. It does not constitute financial advice or investment recommendations. All investments involve risk. Cryptocurrency markets are highly volatile. Past performance does not guarantee future results.