Dogecoin Holds Steady at $0.0743 as RSI Nears Neutral Zone
· Crypto · QuoteReporter
Dogecoin Holds Steady at $0.0743 as RSI Nears Neutral Zone
Dogecoin (DOGE/USD) | July 15, 2026 $0.0743 -0.12%
🔍 Technical Analysis
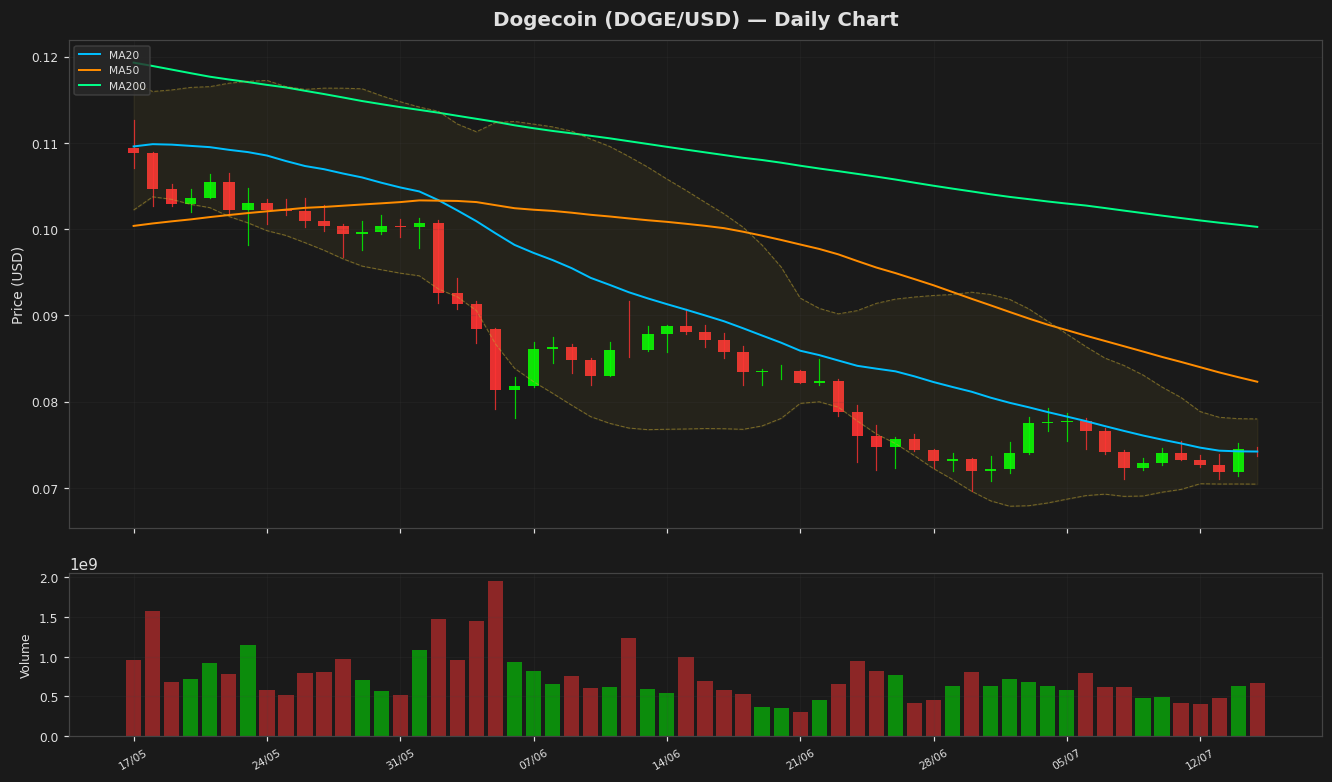
Dogecoin (DOGE) is currently trading at $0.074350, showing minimal daily movement with a slight decline of 0.12%. The price is hovering near the 20-day moving average (MA20) at $0.074206, indicating a neutral short-term trend, while the 50-day (MA50) and 200-day (MA200) moving averages at $0.082299 and $0.100259, respectively, suggest a bearish medium to long-term outlook as the price remains below these levels. The Bollinger Bands show a narrowing range, with the upper band at $0.077985 and the lower band at $0.070426, signaling reduced volatility and potential consolidation. The RSI(14) at 56.18 is in neutral territory, neither overbought nor oversold, while the MACD histogram is slightly negative at -0.002521, below its signal line (-0.003091), indicating weak bearish momentum. Key support lies at the 52-week low of $0.069611, while immediate resistance is at the upper Bollinger Band ($0.077985). The 52-week high at $0.185346 and YTD high at $0.156091 remain distant resistance levels. The ATR(14) of $0.002759 reflects low volatility. Overall, DOGE is in a consolidation phase with no clear directional bias, requiring a breakout above MA50 or a drop below $0.070426 for a decisive trend.
Technical Metrics
| Metric | Value |
|---|---|
| Current Price | $0.0743 |
| Daily Change | -0.12% |
| MA 20 | $0.0742 |
| % from MA20 | +0.19% |
| MA 50 | $0.0823 |
| % from MA50 | -9.66% |
| MA 200 | $0.1003 |
| % from MA200 | -25.84% |
| BB Upper | $0.0780 |
| % from BB Upper | -4.66% |
| BB Lower | $0.0704 |
| % from BB Lower | +5.57% |
| RSI (14) | 56.18 |
| MACD | -0.002521 |
| MACD Signal | -0.003091 |
| ATR (14) | 0.002759 |
| 3-Day High | $0.0752 |
| 3-Day Low | $0.0710 |
| 52-Week High | $0.1853 |
| % from 52W High | -59.89% |
| 52-Week Low | $0.0696 |
| % from 52W Low | +6.81% |
| YTD High | $0.1561 |
| % from YTD High | -52.37% |
| YTD Low | $0.0696 |
| % from YTD Low | +6.81% |
📊 Market Commentary
Dogecoin (DOGE) is currently trading at $0.0743, showing a slight decline of 0.12% today. The Relative Strength Index (RSI) at 56.2 suggests a neutral to slightly bullish momentum, indicating neither overbought nor oversold conditions. Over the past 52 weeks, DOGE has fluctuated between $0.0696 and $0.1853, reflecting its volatile nature amid broader market trends.
Market sentiment for DOGE remains mixed. While the meme coin continues to benefit from its strong community support and occasional social media hype, its price action has been subdued recently, lacking significant catalysts. Traders are closely watching Bitcoin’s performance, as DOGE often correlates with broader crypto market movements. Key resistance levels to monitor include $0.0800, a psychological barrier, and $0.0850, which has acted as a previous resistance zone. On the downside, support lies near $0.0700, aligning with the lower end of its 52-week range.
Volume has been relatively low, suggesting limited conviction among traders. The lack of major developments or adoption news has kept DOGE in a consolidation phase. However, any spikes in trading activity or notable mentions from influential figures could reignite short-term volatility. For now, DOGE remains range-bound, with traders awaiting clearer signals from either macroeconomic conditions or crypto-specific trends to dictate its next move.
Market sentiment for DOGE remains mixed. While the meme coin continues to benefit from its strong community support and occasional social media hype, its price action has been subdued recently, lacking significant catalysts. Traders are closely watching Bitcoin’s performance, as DOGE often correlates with broader crypto market movements. Key resistance levels to monitor include $0.0800, a psychological barrier, and $0.0850, which has acted as a previous resistance zone. On the downside, support lies near $0.0700, aligning with the lower end of its 52-week range.
Volume has been relatively low, suggesting limited conviction among traders. The lack of major developments or adoption news has kept DOGE in a consolidation phase. However, any spikes in trading activity or notable mentions from influential figures could reignite short-term volatility. For now, DOGE remains range-bound, with traders awaiting clearer signals from either macroeconomic conditions or crypto-specific trends to dictate its next move.
Disclaimer
The content on MarketsFN.com is provided for educational and informational purposes only. It does not constitute financial advice or investment recommendations. All investments involve risk. Cryptocurrency markets are highly volatile. Past performance does not guarantee future results.