Tron Eyes Breakout as RSI Nears Overbought at $0.3277
· Crypto · QuoteReporter
Tron Eyes Breakout as RSI Nears Overbought at $0.3277
Tron (TRX/USD) | July 15, 2026 $0.3277 +0.60%
🔍 Technical Analysis
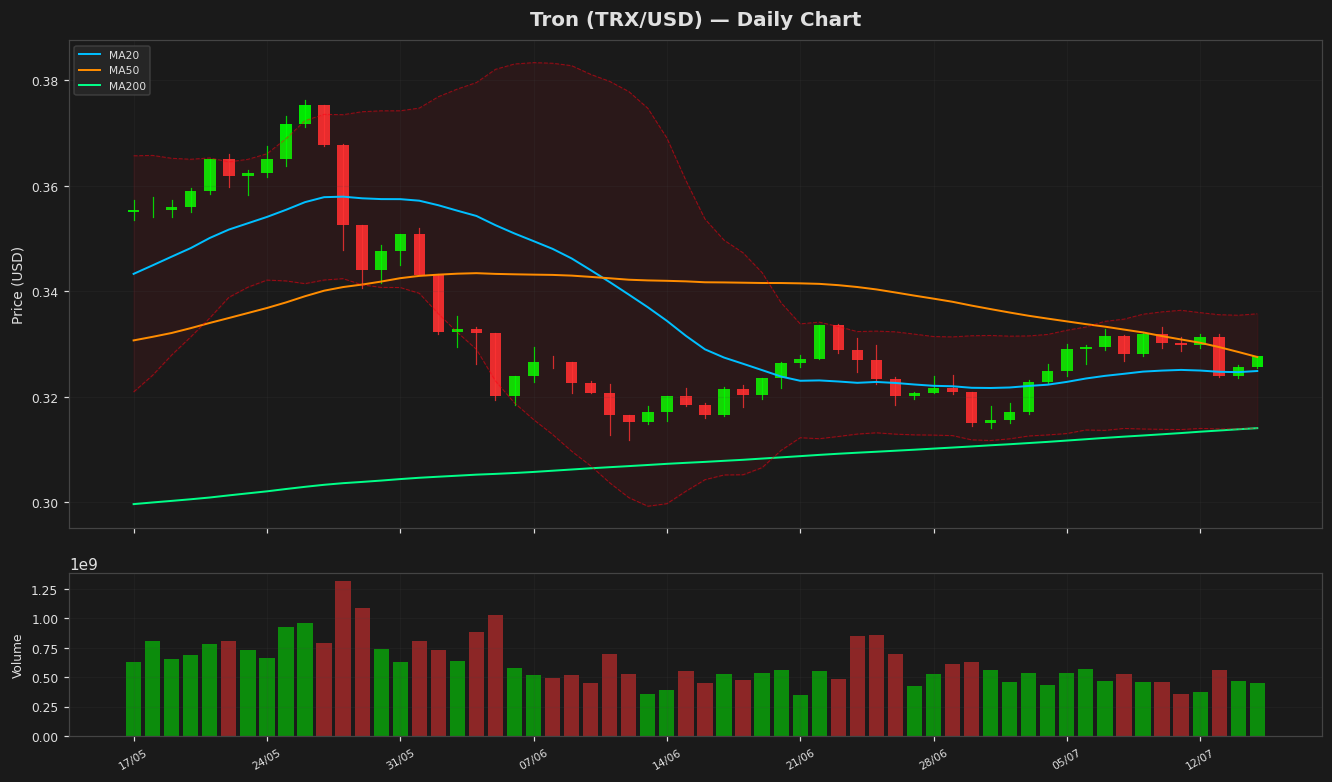
Tron (TRX) is currently trading at $0.327666, showing a modest daily gain of 0.60%. The price action indicates a consolidation phase near the 20-day moving average (MA20) at $0.324901, while the 50-day moving average (MA50) at $0.327558 is nearly aligned with the current price, suggesting a neutral short-term trend. The 200-day moving average (MA200) at $0.314075 acts as a key long-term support level. Bollinger Bands reveal a tightening range, with the upper band at $0.335741 and the lower band at $0.31406, signaling reduced volatility and potential for a breakout. The Relative Strength Index (RSI) at 66.096081 is approaching overbought territory but remains below the 70 threshold, indicating moderate bullish momentum. The MACD histogram shows a slight positive divergence at 0.00042, though the signal line is nearly flat at 1.2e-05, suggesting weak but positive momentum. Key resistance levels to watch include the yearly high at $0.37633201, while support lies at the MA200 and the 52-week low of $0.26813799. The Average True Range (ATR) at 0.004191 reflects low volatility, reinforcing the consolidation narrative. Traders should monitor a breakout above the upper Bollinger Band or a drop below MA20 for directional cues.
Technical Metrics
| Metric | Value |
|---|---|
| Current Price | $0.3277 |
| Daily Change | +0.60% |
| MA 20 | $0.3249 |
| % from MA20 | +0.85% |
| MA 50 | $0.3276 |
| % from MA50 | +0.03% |
| MA 200 | $0.3141 |
| % from MA200 | +4.33% |
| BB Upper | $0.3357 |
| % from BB Upper | -2.41% |
| BB Lower | $0.3141 |
| % from BB Lower | +4.33% |
| RSI (14) | 66.10 |
| MACD | 0.000420 |
| MACD Signal | 0.000012 |
| ATR (14) | 0.004191 |
| 3-Day High | $0.3319 |
| 3-Day Low | $0.3236 |
| 52-Week High | $0.3763 |
| % from 52W High | -12.93% |
| 52-Week Low | $0.2681 |
| % from 52W Low | +22.20% |
| YTD High | $0.3763 |
| % from YTD High | -12.93% |
| YTD Low | $0.2681 |
| % from YTD Low | +22.20% |
📊 Market Commentary
Tron (TRX) is trading at $0.3277, up 0.60% today, as the broader crypto market shows cautious optimism. The Relative Strength Index (RSI) at 66.1 suggests TRX is approaching overbought territory but remains below the critical 70 threshold, indicating room for further upside before a potential pullback. Over the past 52 weeks, TRX has fluctuated between $0.2681 and $0.3763, with the current price sitting comfortably above the midpoint of this range.
Market sentiment around TRX appears cautiously bullish, supported by steady network activity and recent developments in the Tron ecosystem, including growth in decentralized applications (dApps) and stablecoin transactions. Traders are closely watching the $0.3300 level as immediate resistance, with a break above potentially testing the upper bounds of the yearly range near $0.3763. On the downside, support lies near $0.3000, a psychological and technical level that has held firm in recent weeks.
Volume remains moderate, suggesting neither strong accumulation nor distribution at current levels. Given the RSI’s position, traders are monitoring for signs of exhaustion or consolidation before committing to larger positions. The broader market’s direction, particularly Bitcoin’s stability, will likely influence TRX’s near-term momentum. For now, TRX remains in a consolidation phase within its yearly range, with traders awaiting clearer signals for the next directional move.
Market sentiment around TRX appears cautiously bullish, supported by steady network activity and recent developments in the Tron ecosystem, including growth in decentralized applications (dApps) and stablecoin transactions. Traders are closely watching the $0.3300 level as immediate resistance, with a break above potentially testing the upper bounds of the yearly range near $0.3763. On the downside, support lies near $0.3000, a psychological and technical level that has held firm in recent weeks.
Volume remains moderate, suggesting neither strong accumulation nor distribution at current levels. Given the RSI’s position, traders are monitoring for signs of exhaustion or consolidation before committing to larger positions. The broader market’s direction, particularly Bitcoin’s stability, will likely influence TRX’s near-term momentum. For now, TRX remains in a consolidation phase within its yearly range, with traders awaiting clearer signals for the next directional move.
Disclaimer
The content on MarketsFN.com is provided for educational and informational purposes only. It does not constitute financial advice or investment recommendations. All investments involve risk. Cryptocurrency markets are highly volatile. Past performance does not guarantee future results.