Dogecoin Tests Key Support at $0.085 as RSI Nears Oversold
· Crypto · QuoteReporter
Dogecoin Tests Key Support at $0.085 as RSI Nears Oversold
Dogecoin (DOGE/USD) | June 18, 2026 $0.0851 -0.85%
🔍 Technical Analysis
### **Dogecoin (DOGE) Technical Analysis**
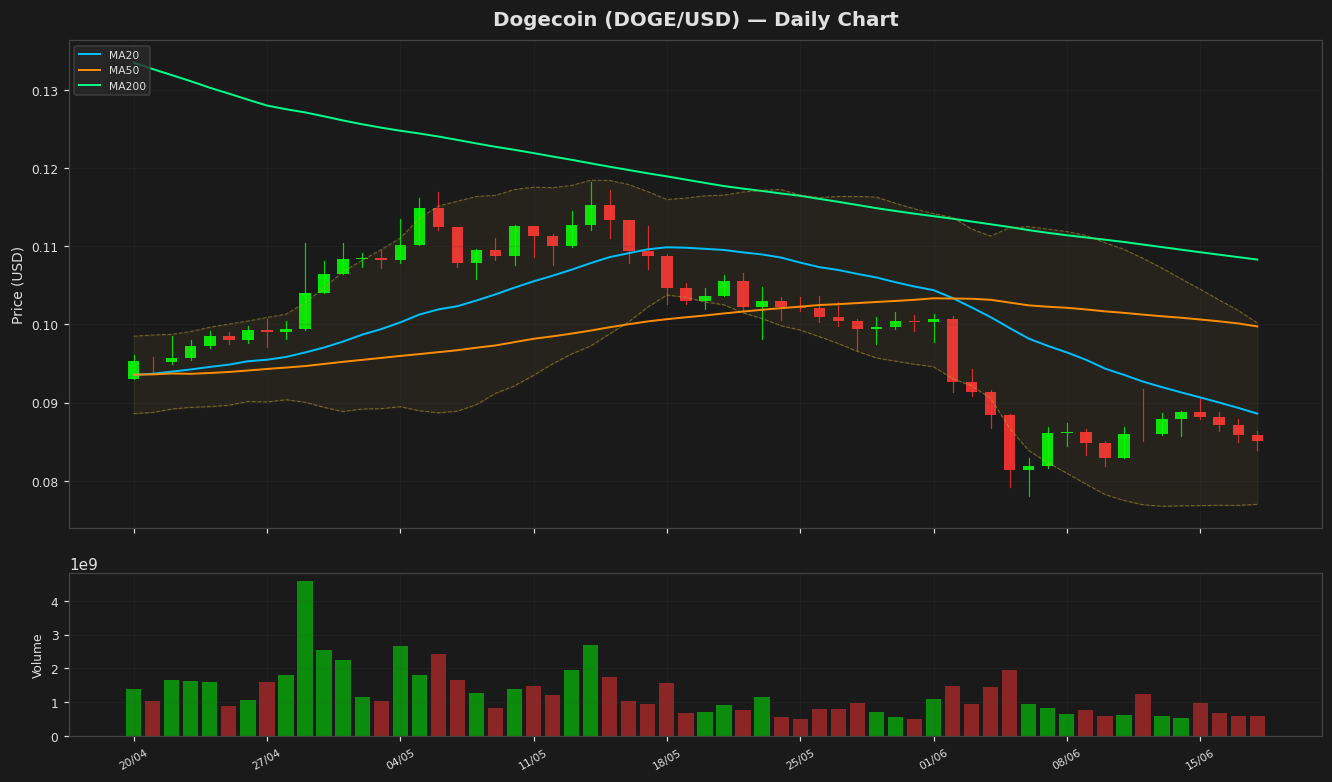
Dogecoin is currently trading at **$0.085070**, down **0.85%** on the day, reflecting short-term bearish momentum. The price remains below key moving averages, with the **20-day MA at $0.088585**, the **50-day MA at $0.099732**, and the **200-day MA at $0.108283**, indicating a broader downtrend. The widening gap between the 50-day and 200-day MA suggests persistent bearish pressure.
Bollinger Bands show the price near the lower band (**$0.076989**), signaling potential oversold conditions, while the upper band sits at **$0.10018**. A break below the lower band could trigger further downside, whereas a rebound may test the middle band (20-day MA). The **RSI(14) at 43.329** is neutral but leaning toward bearish territory, lacking strong momentum in either direction.
The **MACD histogram is negative (-0.003676)**, with the signal line (-0.00415) reinforcing bearish sentiment. A crossover above the signal line is needed to shift momentum.
Key support lies at the **52-week low of $0.078095**, while resistance levels include the 20-day MA ($0.088585) and the psychological $0.10 level. The **ATR(14) of 0.004015** suggests low volatility, indicating consolidation before a potential breakout.
In summary, Dogecoin remains in a downtrend, with weak technical indicators. A break above the 20-day MA could signal short-term recovery, but sustained bullish momentum requires reclaiming higher MAs and key resistance levels.
Technical Metrics
| Metric | Value |
|---|---|
| Current Price | $0.0851 |
| Daily Change | -0.85% |
| MA 20 | $0.0886 |
| % from MA20 | -3.97% |
| MA 50 | $0.0997 |
| % from MA50 | -14.70% |
| MA 200 | $0.1083 |
| % from MA200 | -21.44% |
| BB Upper | $0.1002 |
| % from BB Upper | -15.08% |
| BB Lower | $0.0770 |
| % from BB Lower | +10.50% |
| RSI (14) | 43.33 |
| MACD | -0.003675 |
| MACD Signal | -0.004150 |
| ATR (14) | 0.004015 |
| 3-Day High | $0.0888 |
| 3-Day Low | $0.0840 |
| 52-Week High | $0.2536 |
| % from 52W High | -66.46% |
| 52-Week Low | $0.0781 |
| % from 52W Low | +8.93% |
| YTD High | $0.1561 |
| % from YTD High | -45.50% |
| YTD Low | $0.0781 |
| % from YTD Low | +8.93% |
📊 Market Commentary
**Dogecoin (DOGE) Market Commentary**
Dogecoin (DOGE) is currently trading at $0.0851, down 0.85% today, as the broader crypto market shows mixed sentiment. The Relative Strength Index (RSI) at 43.3 suggests DOGE is in neutral territory, neither oversold nor overbought, indicating a lack of strong directional momentum. Over the past 52 weeks, DOGE has fluctuated between $0.0781 and $0.2536, reflecting its high volatility and meme-driven nature.
Market sentiment around DOGE remains cautious, with traders closely monitoring Bitcoin’s price action for broader market cues. The lack of significant catalysts—such as major exchange listings or ecosystem developments—has kept DOGE in a consolidation phase. Key support levels to watch include $0.0800, a psychological and technical floor, followed by the yearly low of $0.0781. On the upside, resistance is seen near $0.0900, a level that has previously acted as both support and resistance.
Traders are also watching trading volume, which has been subdued recently, suggesting limited conviction from buyers or sellers. Given DOGE’s history of sharp rallies fueled by social media hype, any resurgence in retail interest could trigger volatility. However, without a clear catalyst, DOGE may continue to trade range-bound in the near term, mirroring the broader altcoin market’s indecision.
Disclaimer
The content on MarketsFN.com is provided for educational and informational purposes only. It does not constitute financial advice or investment recommendations. All investments involve risk. Cryptocurrency markets are highly volatile. Past performance does not guarantee future results.