Dow Hits Record Close as Tech Slumps; Jobs Data Shows Cooling Labor Market
· Market News · MarketsFN Team
Dow Rides Industrials to Record High While Nasdaq Slides 1.6% on Chip Rout
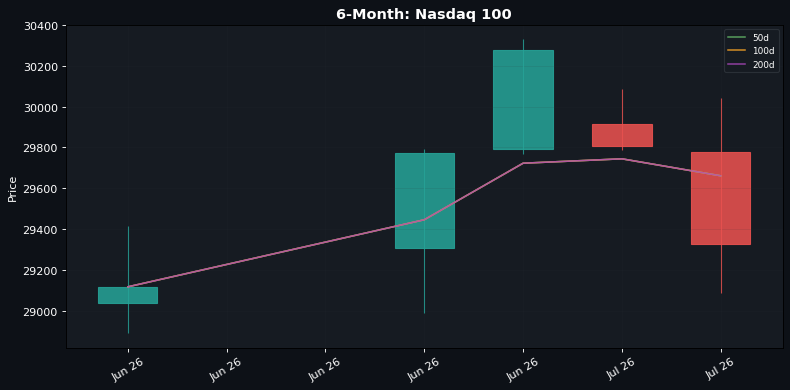
The Dow Jones Industrial Average surged 1.14% to a record close at 52,900.07 as investors rotated into value stocks, while the Nasdaq 100 tumbled 1.61% amid a semiconductor selloff. Mixed June jobs data showed payrolls growth cooling to 57,000 but unemployment dipping to 4.2%, fueling debate about Fed policy.
🇺🇸 US Session Overview
The S&P 500 closed flat at 7,483.24 in a bifurcated session, with industrials and financials lifting the index while tech dragged. The Dow's 600-point rally was led by Caterpillar and Goldman Sachs, benefiting from softer Treasury yields after the jobs report. Meanwhile, the Nasdaq 100 suffered its worst day in three weeks as Nvidia dropped 4% following reports of former President Trump's pre-tariff tech stock purchases. The Russell 2000 slipped 0.55% as small caps failed to participate in the rally.
📅 Economic Calendar Highlights
June's nonfarm payrolls came in at just 57,000 versus 114,000 expected, marking the slowest job growth since December 2023. However, the unemployment rate unexpectedly fell to 4.2% as labor force participation dipped to 61.5% - its lowest outside pandemic periods since 1977. Wage growth met expectations at 0.3% MoM and 3.5% YoY. Factory orders disappointed at -1.3%, though this followed May's 5.3% surge.
💱 FX & Commodities
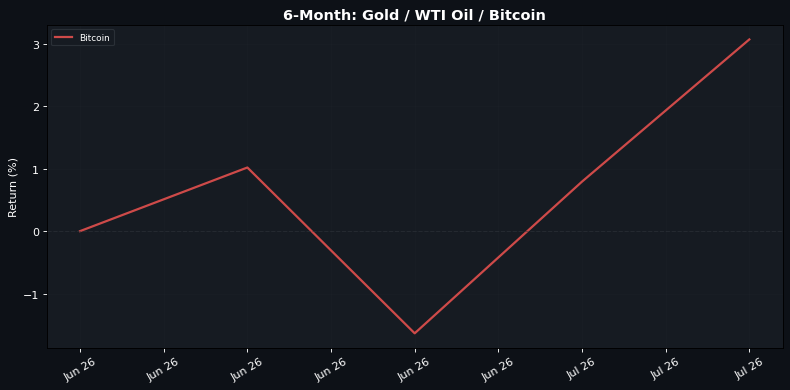
The dollar weakened broadly, with USD/JPY falling 0.95% to 161.09 as Treasury yields retreated. GBP/USD led G10 gains, rallying 0.74% to 1.3349. Precious metals shone, with gold jumping 1.63% to $4,134.60 and silver up 2.07% at $61.33. Oil was mixed with WTI dipping 0.15% to $68.48 despite a 5-rig increase in U.S. drilling activity. Cryptos rebounded sharply, with Ethereum surging 5.54%.
Markets await Friday's ISM Services PMI for confirmation of the economic slowdown hinted at in today's data. Asian session focus will be on Japan's wage data and whether the yen can extend gains below 160. Earnings season kicks off next week with major banks reporting.
🇺🇸 US Indices — Session Close
| Index | Price | Change | Change % |
|---|---|---|---|
| S&P 500 | 7,483.24 | ▲ +0.01 | ▲ +0.00% |
| Nasdaq 100 | 29,329.21 | ▼ -479.92 | ▼ -1.61% |
| Dow Jones | 52,900.07 | ▲ +594.83 | ▲ +1.14% |
| Russell 2000 | 2,996.11 | ▼ -16.48 | ▼ -0.55% |
💱 FX Majors
| Pair | Rate | Change % |
|---|---|---|
| EUR/USD | 1.1438 | ▲ +0.21% |
| GBP/USD | 1.3349 | ▲ +0.74% |
| USD/JPY | 161.09 | ▼ -0.95% |
| AUD/USD | 0.6925 | ▲ +0.17% |
| USD/CHF | 0.8033 | ▼ -0.67% |
🛢️ Commodities & Crypto
| Asset | Price (USD) | Change % |
|---|---|---|
| Gold (XAU/USD) | 4,134.60 | ▲ +1.63% |
| Silver (XAG/USD) | 61.33 | ▲ +2.07% |
| Crude Oil (WTI) | 68.48 | ▼ -0.15% |
| Brent Oil | 71.59 | ▲ +0.03% |
| Natural Gas | 3.22 | ▼ -0.12% |
| Bitcoin | 61,358.36 | ▲ +2.26% |
| Ethereum | 1,698.09 | ▲ +5.54% |
📋 Today's Earnings
| Ticker | Company | Timing | Market Cap |
|---|---|---|---|
| LNN | Lindsay Corp | BMO | 1270000000.0 |
📅 Economic Calendar
All times in UTC — Actual highlighted where available
| Time | Currency | Event | Imp. | Actual | Forecast | Previous |
|---|---|---|---|---|---|---|
| 12:30 | USD | Average Hourly Earnings (MoM) (Jun) | 🔴🔴🔴 | 0.3% | 0.3% | 0.3% |
| 12:30 | USD | Initial Jobless Claims | 🔴🔴🔴 | 215K | 219K | 216K |
| 12:30 | USD | Nonfarm Payrolls (Jun) | 🔴🔴🔴 | 57K | 114K | 129K |
| 12:30 | USD | Unemployment Rate (Jun) | 🔴🔴🔴 | 4.2% | 4.3% | 4.3% |
| 01:30 | AUD | Trade Balance (May) | 🟡🟡 | -3.018B | 2.190B | 1.383B |
| 03:35 | JPY | 10-Year JGB Auction | 🟡🟡 | 2.730% | 2.649% | |
| 06:30 | CHF | CPI (MoM) (Jun) | 🟡🟡 | 0.0% | 0.1% | 0.2% |
| 07:00 | EUR | Spanish Unemployment Change (Jun) | 🟡🟡 | -28.7K | -40.8K | -36.3K |
| 09:00 | BRL | IPC-Fipe Inflation Index (MoM) (Jun) | 🟡🟡 | 0.18% | 0.45% | |
| 09:00 | EUR | Unemployment Rate (May) | 🟡🟡 | 6.2% | 6.3% | 6.2% |
| 12:30 | USD | Average Hourly Earnings (YoY) (YoY) (Jun) | 🟡🟡 | 3.5% | 3.5% | 3.4% |
| 12:30 | USD | Continuing Jobless Claims | 🟡🟡 | 1,814K | 1,810K | 1,812K |
| 12:30 | USD | Participation Rate (Jun) | 🟡🟡 | 61.5% | 61.8% | |
| 12:30 | USD | Private Nonfarm Payrolls (Jun) | 🟡🟡 | 49K | 110K | 97K |
| 12:30 | USD | U6 Unemployment Rate (Jun) | 🟡🟡 | 7.9% | 8.1% | |
| 14:00 | USD | Factory Orders (MoM) (May) | 🟡🟡 | -1.3% | -1.7% | 5.3% |
| 17:00 | USD | U.S. Baker Hughes Oil Rig Count | 🟡🟡 | 445 | 440 | |
| 17:00 | USD | U.S. Baker Hughes Total Rig Count | 🟡🟡 | 580 | 573 | |
| 07:30 | EUR | German Buba Vice President Buch Speaks | 🟡🟡 | — | ||
| 08:30 | GBP | BOE Credit Conditions Survey | 🟡🟡 | — | ||
| 10:00 | EUR | ECB's Elderson Speaks | 🟡🟡 | — | ||
| 11:45 | USD | FOMC Member Daly Speaks | 🟡🟡 | — | ||
| 15:45 | GBP | BoE MPC Member Mann Speaks | 🟡🟡 | — | ||
| 20:30 | USD | Fed's Balance Sheet | 🟡🟡 | — | 6,736B |
Report published: July 02, 2026 — 22:21 CET
Disclaimer
The content on MarketsFN.com is provided for educational and informational purposes only. It does not constitute financial advice, investment recommendations, or trading guidance. All investments involve risks, and past performance does not guarantee future results. You are solely responsible for your investment decisions and should consult a qualified financial adviser before acting. MarketsFN.com and its authors are not liable for any losses arising from your use of this information.