Straits Times Index Rises 1.03% Amid Mixed Asian Market Performance
· Market News · MarketsFN Team
Straits Times Index Rises 1.03% Amid Mixed Asian Market Performance
Note: This analysis covers the Asian trading session close for July 02, 2026. All times are in US Eastern Time (ET).
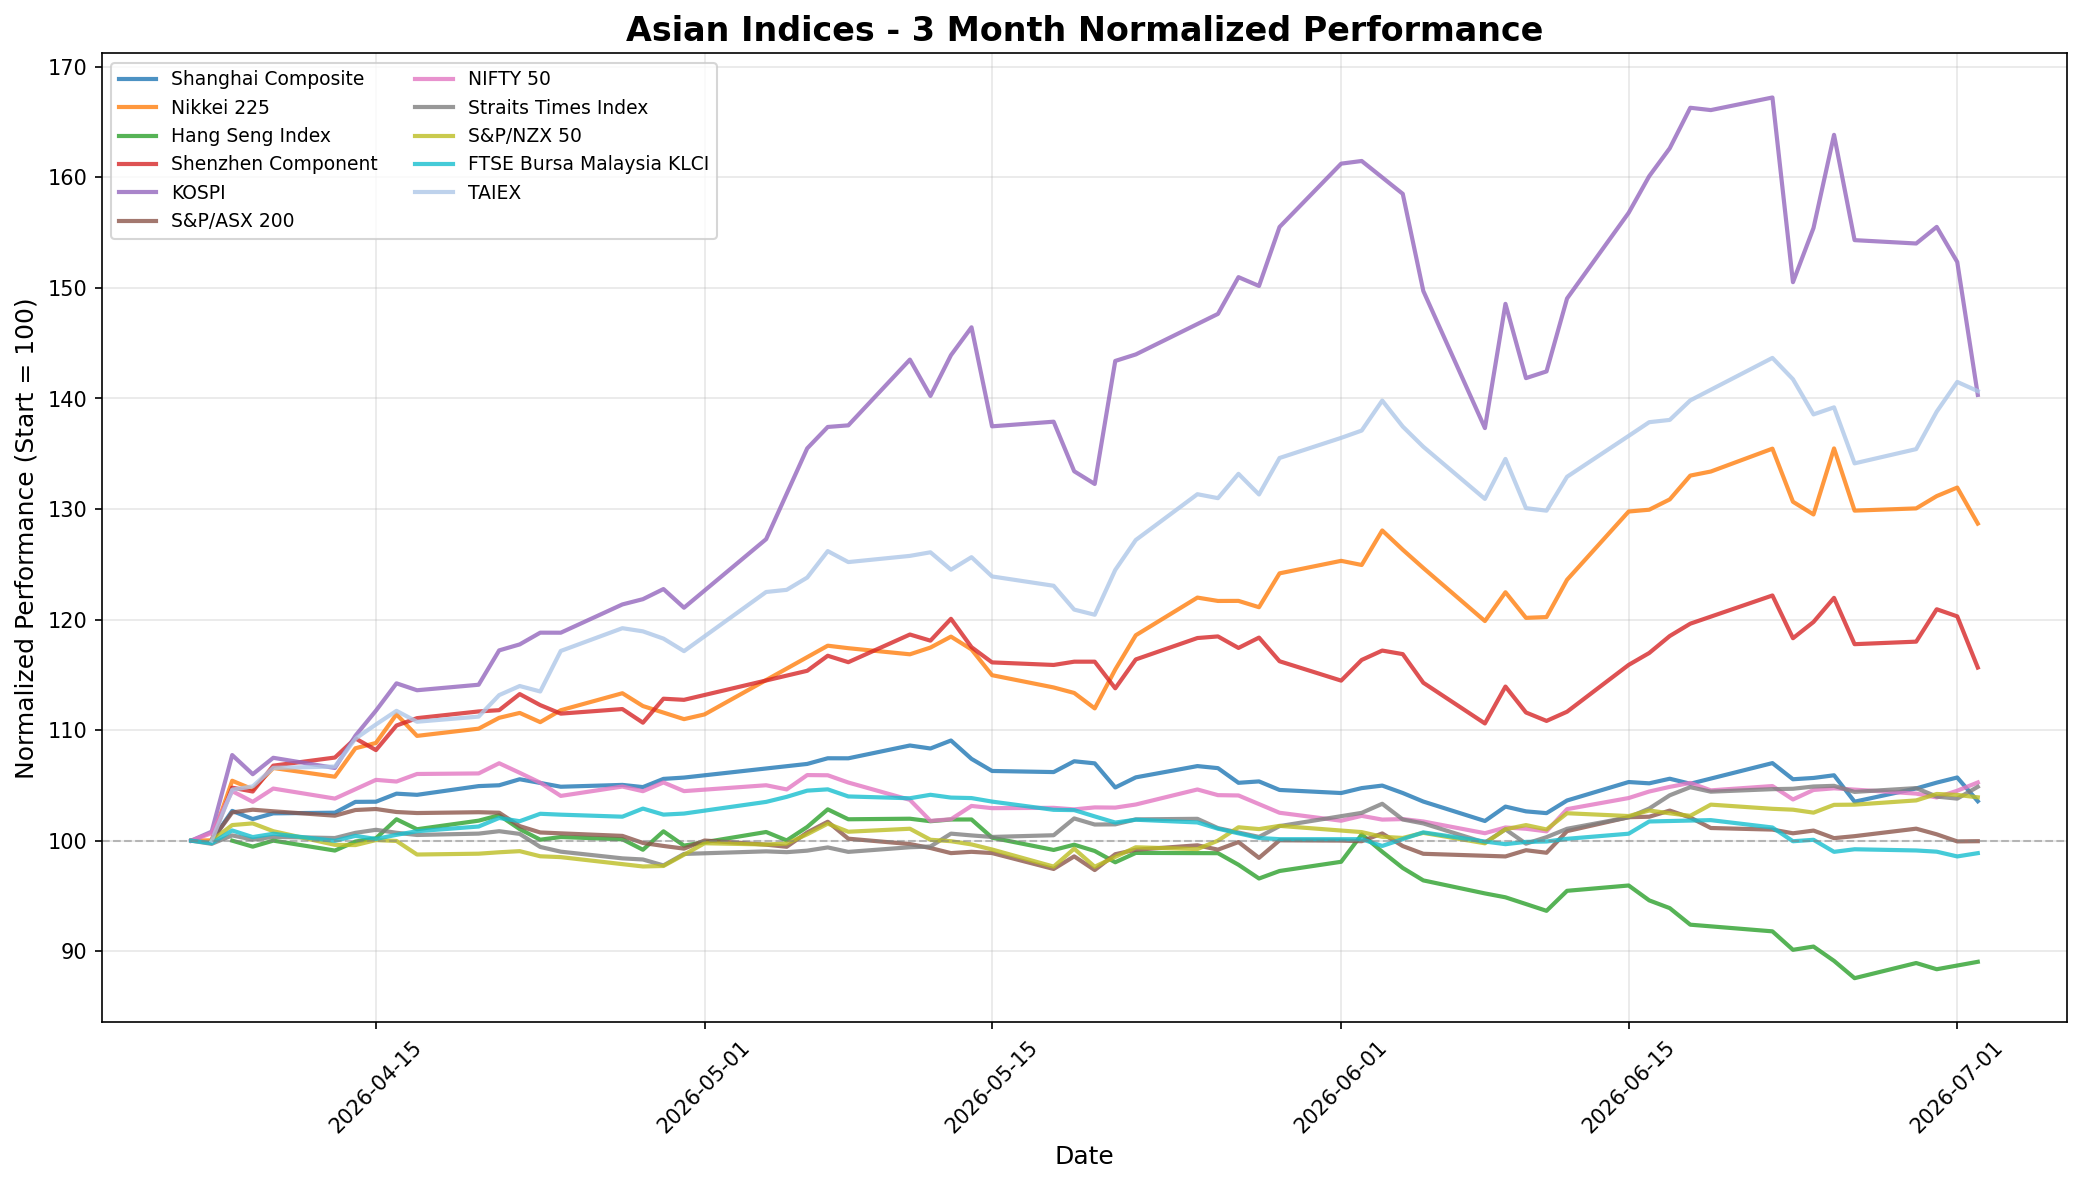
📊 Asian Indices Performance
| Index | Price | Daily Change (%) |
|---|---|---|
| Shanghai Composite | 4,028.90 | -2.03% |
| Nikkei 225 | 68,733.15 | -2.47% |
| Hang Seng Index | 23,055.03 | +0.76% |
| Shenzhen Component | 15,498.81 | -3.85% |
| KOSPI | 7,648.09 | -7.89% |
| S&P/ASX 200 | 8,724.50 | +0.02% |
| NIFTY 50 | 24,174.30 | +0.70% |
| Straits Times Index | 5,214.66 | +1.03% |
| S&P/NZX 50 | 13,582.19 | -0.21% |
| FTSE Bursa Malaysia KLCI | 1,661.83 | +0.30% |
| TAIEX | 46,744.16 | -0.58% |
📰 Market Commentary
On July 02, 2026, Asian markets exhibited a mixed performance, influenced by various regional economic developments and market sentiment. **Key Events Impacting Asian Indices:** - The Tokyo stock market closed mixed, primarily due to selling pressure on semiconductor-related shares, which reflected a cautious sentiment following recent gains. The Nikkei 225 index fell by 2.47%, while the Hang Seng Index in Hong Kong managed a modest gain of 0.76% amid a broader recovery in its equity capital markets. - Notably, Hong Kong's equity capital markets (ECM) reported their strongest first half since 2021, driven by a surge in IPOs and secondary listings, particularly from Chinese technology companies. This resurgence is reflected in the Hang Seng Index's performance, contrasting with the declines seen in other regional indices. - The Shanghai Composite and Shenzhen Component indices faced significant declines of 2.03% and 3.85%, respectively, as market participants reacted to ongoing economic uncertainties in China. **Market Sentiment and Price Movements:** - Overall market sentiment in Asia appeared cautious, with several indices experiencing declines. The KOSPI in South Korea was notably impacted, dropping 7.89%, indicating a particularly bearish outlook among investors. - In Japan, retail investors capitalized on the recent tech selloff by purchasing a record amount of local shares, suggesting a potential rebound sentiment among domestic investors despite the broader market decline. - The mixed performance of indices highlights a divergence in market sentiment, with some regions, like Hong Kong, showing resilience due to strong IPO activity, while others, particularly in mainland China and South Korea, faced significant selling pressure. **Regional Economic Developments:** - Japan's tax revenue for fiscal 2025 is projected to exceed 84 trillion yen, marking a record high for the sixth consecutive year, which may support future government spending and economic stability. - In Hong Kong, the restructuring of Beijing's liaison office signals a renewed focus on economic and youth initiatives, which may influence future market dynamics and investor confidence. - Meanwhile, the pilot's tragic crash into Beijing’s Citic Tower raised concerns about aviation safety and mental health, potentially impacting public sentiment and regulatory scrutiny in the region. In summary, the Asian markets on July 02, 2026, displayed a complex landscape of mixed performances, driven by sector-specific dynamics, regional economic indicators, and shifting investor sentiments.
📅 Economic Calendar - Asian Session
All times are in US Eastern Time (ET)
| Date | Time | Cur | Imp | Event | Actual | Forecast |
|---|---|---|---|---|---|---|
| 2026-07-02 | 20:30 | 🇯🇵 | Medium | S&P Global Services PMI (Jun) | 51.8 | |
| 2026-07-02 | 21:45 | 🇨🇳 | Medium | RatingDog Services PMI (Jun) | 53.6 |
On July 02, 2026, significant economic data releases from Asia have implications for traders, particularly concerning the Japanese and Chinese markets. 1. **Japan - S&P Global Services PMI (June)** - **Forecast**: 51.8 - **Actual**: Data not provided - **Market Implications**: The S&P Global Services PMI is a key indicator of the health of the services sector in Japan. A reading above 50 indicates expansion, while below 50 suggests contraction. Traders should closely monitor the actual figure once released, as it will influence market sentiment towards the Japanese yen and could impact the Nikkei 225 index. A result below forecast could indicate a slowdown in services, potentially leading to bearish sentiment. 2. **China - RatingDog Services PMI (June)** - **Forecast**: 53.6 - **Actual**: Data not provided - **Market Implications**: The RatingDog Services PMI serves as a crucial gauge of the services sector in China. A reading above 50 signifies growth, with higher values reflecting stronger expansion. As with Japan, the actual figure will be pivotal for traders. If the actual PMI falls short of the forecast, it may signal weakening economic momentum, adversely affecting the Chinese yuan and the Shanghai Composite index. In summary, traders should remain vigilant for the actual PMI figures for both Japan and China, as these will provide critical insights into the economic conditions of these major Asian economies and influence market movements in their respective indices.
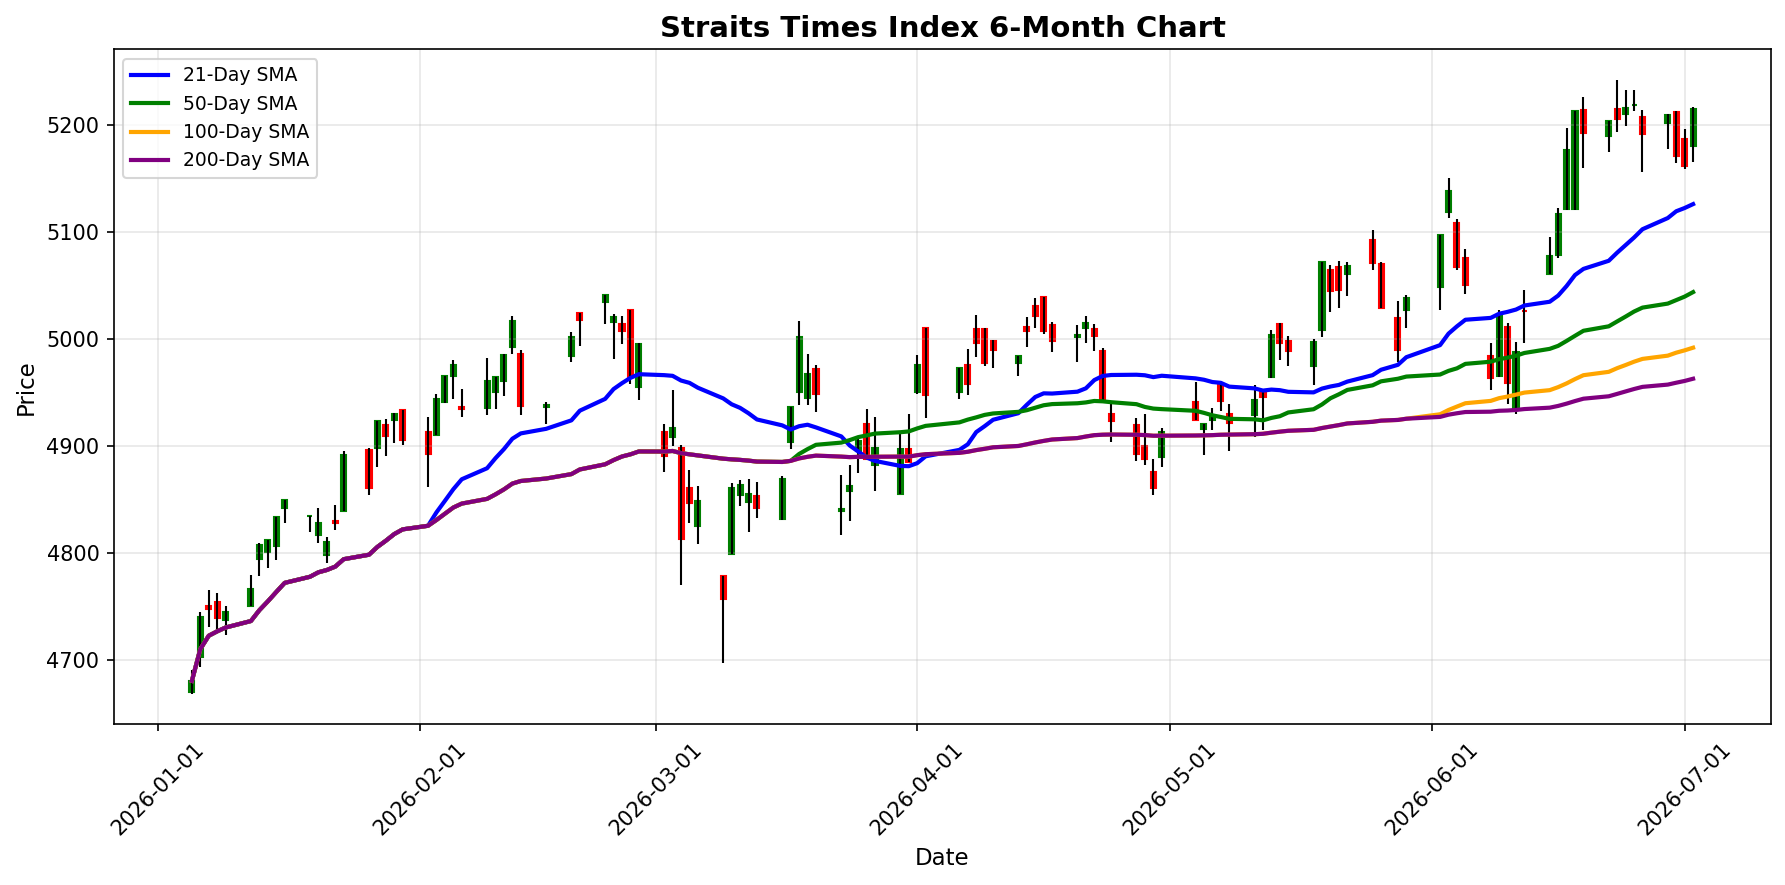
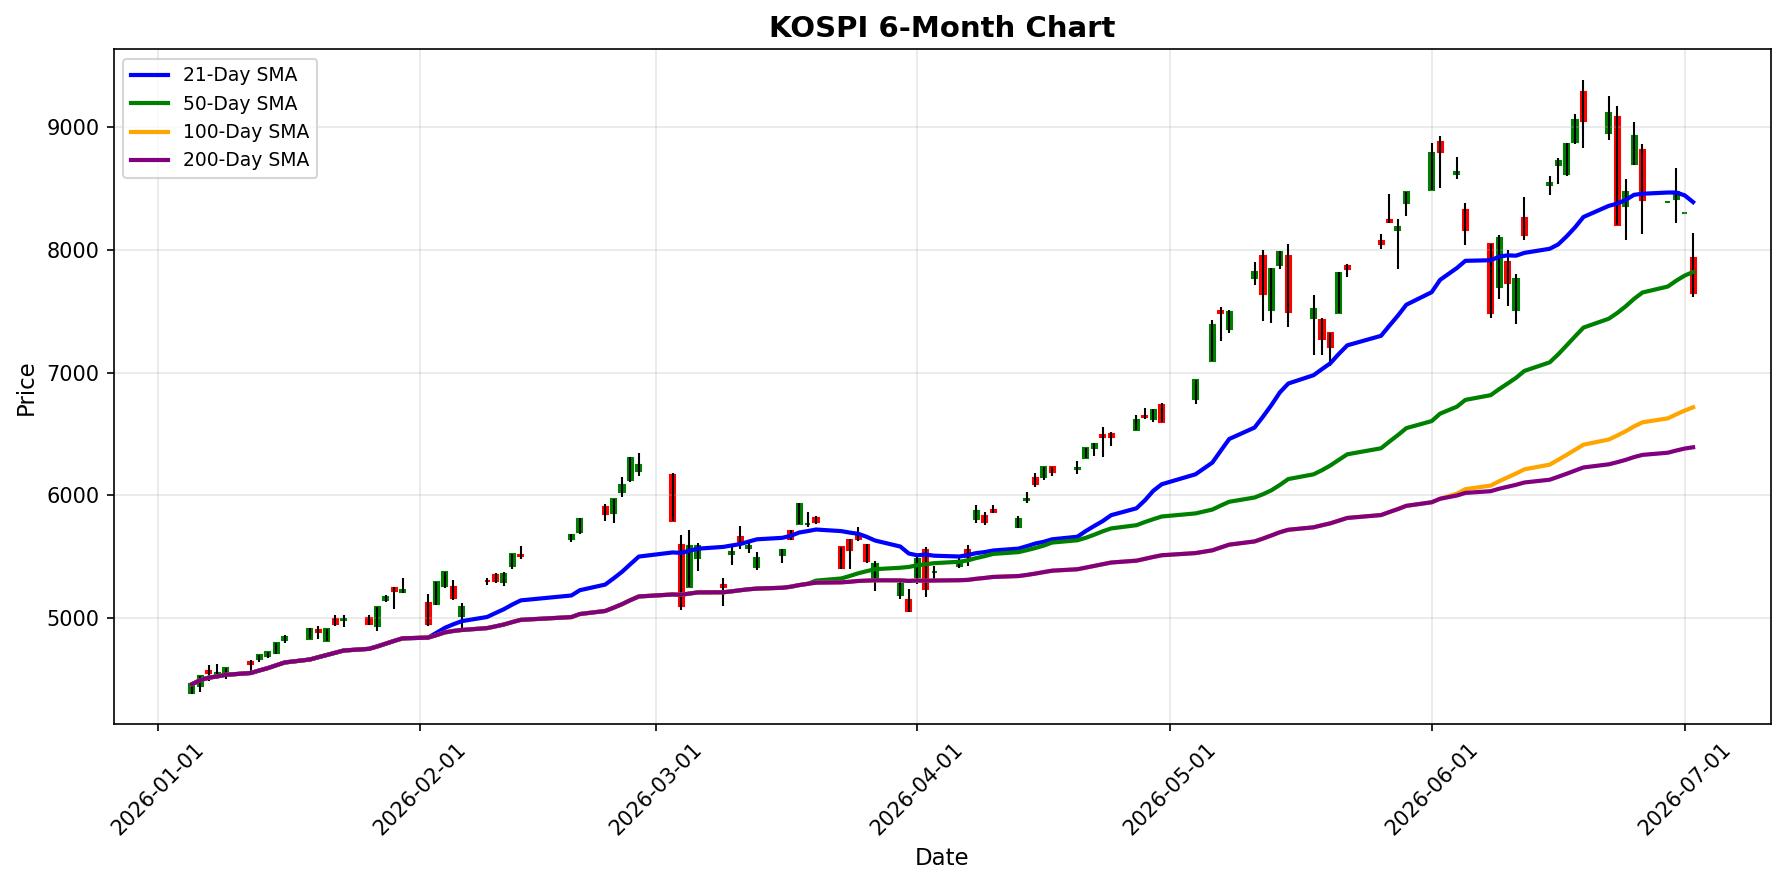
📈 Index Performance Charts
Best Performer: Straits Times Index
Worst Performer: KOSPI
💱 FX, Commodities & Crypto
### FX Pairs Performance 1. **USD/JPY**: The pair is trading at 161.2450, reflecting a daily decrease of 0.78%. This movement may be influenced by market sentiment surrounding U.S. interest rate expectations and Japan's monetary policy stance. 2. **USD/CNY**: Currently at 6.7881, the pair shows a marginal decline of 0.08%. Factors such as China's economic data releases and U.S.-China trade relations are likely influencing this pair. 3. **AUD/USD**: The Australian dollar is slightly up at 0.6902, with a daily change of 0.03%. The performance may be driven by commodity price fluctuations, particularly in iron ore and coal, which are crucial for the Australian economy. 4. **NZD/USD**: Trading at 0.5685, the New Zealand dollar has seen a modest increase of 0.19%. This movement could be attributed to positive sentiment in the agricultural sector and broader risk appetite in the markets. ### Commodities Performance 1. **Gold**: Priced at $4,084.20, gold has increased by 0.39% today. The rise is likely driven by ongoing geopolitical tensions and inflation concerns, prompting investors to seek safe-haven assets. 2. **Silver**: Currently at $60.39, silver has gained 0.51%. Similar to gold, silver's performance may be bolstered by investment demand amid economic uncertainty. 3. **Crude Oil (WTI)**: Trading at $67.62, WTI crude oil has experienced a decline of 1.40%. This drop can be attributed to concerns over global demand, particularly in
Currency Pairs
| Pair | Price | Daily Change (%) |
|---|---|---|
| USD/JPY | 161.25 | -0.78% |
| USD/CNY | 6.79 | -0.08% |
| AUD/USD | 0.69 | +0.03% |
| NZD/USD | 0.57 | +0.19% |
Commodities
| Commodity | Price | Daily Change (%) |
|---|---|---|
| Gold | $4084.20 | +0.39% |
| Silver | $60.39 | +0.51% |
| Crude Oil (WTI) | $67.62 | -1.40% |
Cryptocurrencies
| Asset | Price | Daily Change (%) |
|---|---|---|
| Bitcoin | $60,532 | +0.88% |
| Ethereum | $1,627 | +1.15% |
Disclaimer
The content on MarketsFN.com is provided for educational and informational purposes only. It does not constitute financial advice, investment recommendations, or trading guidance. All investments involve risks, and past performance does not guarantee future results. You are solely responsible for your investment decisions and should conduct independent research and consult a qualified financial advisor before acting. MarketsFN.com and its authors are not liable for any losses or damages arising from your use of this information.